
 ?Mathematical formulae have been encoded as MathML and are displayed in this HTML version using MathJax in order to improve their display. Uncheck the box to turn MathJax off. This feature requires Javascript. Click on a formula to zoom.
Abstract
Mobility as a Service (MaaS) is an innovative concept, enabled by the ubiquitous availability of digital technologies. Many cities around the world envision MaaS as a way to improve sustainable transportation by reducing the use of fossil fuel-based transportation modes. However, MaaS may also trigger users of environmentally-friendly transportation modes to switch to less sustainable modes, such as taxi and ridesharing. The aim of this study is to explore how different bundling and pricing schemes of MaaS contribute to improving sustainable transportation. In order to analyze individuals’ intended choice of MaaS, a stated portfolio choice experiment was developed. A mixed logit model is estimated to investigate the bundle of transportation modes individuals configure when subscribing to MaaS. We explore empirical issues such as which transportation modes they prefer to include in the bundle, and how pricing schemes affect the composition of the bundle. Furthermore, scenario analyses are conducted to assess the impact of pricing schemes on sustainable transportation. Results show that MaaS contributes to improving sustainable transportation in a non-linear manner as a function of decreasing monthly subscription fees and/or increasing length of the subscription.
1. Introduction
Travel behavior is commonly seen as the result of individuals’ decisions that are triggered by their need or desire to engage in activities and based on their expectations about the state of the transportation system that are updated over time through learned experiences. However, the recent ubiquitous availability of digital technologies allows individuals to actively and dynamically acquire information about the real time state of the transportation system in deciding when, where, and/or how to travel. Moreover, digital technology allows travelers to book and pay for transportation services with less effort and more convenience. Based on these developments, Mobility as a Service (MaaS) has emerged as a new, innovative concept. Heikkilä (Citation2014) defined MaaS as: “a system, which provides a comprehensive range of mobility services to customers by various mobility operators”. MaaS concerns a digital platform that integrates a variety of public and private transportation modes, including on demand transportation services. That is, depending on their subscription, travelers subscribing to the service can use the platform to access the different transportation modes, included in their bundle, and order and pay for the service through the same platform. Thus, MaaS provides the optimum combination of transportation modes at the consumer’s request through searching, ticketing, and paying for a combination of transportation services. This encourages the concept of usership of transportation as an alternative to the classic concept of ownership of transportation represented by private cars (Caiati et al., Citation2018).
In-depth discussions about the impact of MaaS on changes in travel behavior and vehicle ownership have started only recently. Most MaaS projects and studies concern European countries, such as Sweden (Sochor et al., Citation2015, Citation2016; Strömberg et al., Citation2018; Karlsson et al., Citation2020; Hesselgren et al., Citation2020), the Netherlands (Meurs & Timmermans, Citation2017; Jittrapirom et al., Citation2017; Ebrahimi et al., Citation2018; Feneri et al., Citation2020; Meurs et al., Citation2020), the United Kingdom (Kamargianni & Matyas, Citation2017; Matyas & Kamargianni, Citation2019a; Cottrill, Citation2020), Finland (Hartikainen et al., Citation2019), Austria (König et al., Citation2016), Switzerland (Becker et al., Citation2020), Greece (Polydoropoulou et. al., 2020a), Hungary (Esztergár-Kiss & Kerény, Citation2019), and Germany (Schikofsky et al., Citation2020). Other important MaaS studies relate to Australia (Wong & Hensher, Citation2020; Mulley et al., Citation2018; Merkert et al., Citation2020), the United States (Beheshtian et al., Citation2020), Hong Kong (Pickford & Chung, Citation2019), and India (Singh, Citation2020).
In this line of research, individuals’ preferences for particular MaaS bundles and their willingness to pay have emerged as key research issues on the demand side. Consequently, several recent studies have designed stated preference surveys to predict consumers’ subscriptions to MaaS and their willingness to pay. Ho et al. (Citation2018) investigated what kind of subscription plans are most appealing to consumers in Sydney, Australia. They argued that lowering public transport fares, especially by implementing a daily and/or weekly cap, reducing operating costs and/or offering individual plans that consider subscribers’ travel patterns would be necessary to increase the adoption of MaaS. Matyas and Kamargianni (Citation2019b) designed a stated preference experiment that attempts to capture the complex decision making process leading to the purchase of MaaS products. They introduced a smartphone-based travel survey tool for MaaS plan choices. Respondents could choose between four hypothetical MaaS plans, three of which were fixed and one was a menu option. Caiati et al. (Citation2020) explored individuals’ intention to subscribe to MaaS, preferences for bundle configurations and willingness to pay for extra features of the service, using a web-based survey, in the Amsterdam and Eindhoven regions in the Netherlands. They developed an experimental design approach based on portfolio choice. Results indicated that the overall willingness to subscribe to MaaS is limited. Service attributes, especially the fee of a monthly subscription, pricing schemes of the transportation modes, and socio-demographic characteristics significantly influenced the intention to subscribe to MaaS. Ho et al. (Citation2020) explored consumer response to MaaS in Tyneside, United Kingdom. Their results showed that consumers value the convenience of MaaS. However, they are not willing to pay for it, leading to the suggestion that some discounts are necessary to guarantee a widespread adoption of MaaS. Kim et al. (Citation2020) explored differences in MaaS adoption behavior between car and public transportation users in Seoul, South Korea and found that public transportation users are more willing to adopt MaaS plans. This is caused by differences in not only their value of time but also in their latent attitudes and work environments. Polydoropoulou et al. (Citation2020b) investigated individual preferences for MaaS in Budapest, Hungary and Greater Manchester, United Kingdom. They found that individuals who are more prone to using multimodal mobility options are willing to pay more for traditional and emerging mobility services as part of a monthly MaaS plan.
One of the major reasons for the widespread interest in MaaS in many countries around the world are policy makers’ high expectations about the impact of MaaS on reducing the purchase and use of non-environmentally-friendly transportation modes, which in turn leads to reduced congestion and pollution, and an increasing attractiveness of cities (Hensher, Citation2017; Jittrapirom et al., Citation2020). Thus, one of the argued benefits of MaaS is that it will improve sustainable transportation. Whether these claims are justified is, however, not immediately clear. Similar expectations have been formulated about ride-hailing services, such as Uber and Lyft. It was expected that many private car users would switch to ride-sourcing services, leading to improved sustainable transportation. However, Clewlow and Mishra (Citation2017) pointed out that in the United States the transition to ride-hailing services was only marginally caused by car users; public transportation users attributed to the major share of the transition. In fact, these new services caused an increase in the total miles traveled. Consumers were not just substituting trips, but were adding new ones. Therefore, the anticipated effects of the introduction of ride sourcing services on sustainable transportation may have been exaggerated if these results can be generalized.
The same question can be posed about the impact of MaaS. We should consider the nature of the transitions to MaaS. A MaaS offering may also include non-environmentally-friendly transportation modes, such as taxi and car rental. If current public transportation users choose these modes in their MaaS bundle as replacement of their public transportation trips, it will adversely affect sustainable transportation. Therefore, in order to improve sustainability, MaaS should achieve two objectives: 1) Maximize the use of environmentally-friendly transportation modes by consumers who previously used “non-environmentally-friendly” modes for their daily travel and 2) Minimize the use of “non-environmentally-friendly” modes by consumers who used environmentally-friendly modes. The sustainability effects of MaaS depend on how many people subscribe to MaaS, their current transportation modes and which bundle they choose and use. The fee setting and duration of the subscription of MaaS and the pricing schemes of each mode included in the MaaS bundle influence these decisions.
The aim of this study, therefore, is to assess how much different bundling and pricing schemes of MaaS contribute to achieving a more sustainable transportation system. The analysis focuses on transportation mode choice transitions, derived from a stated portfolio choice experiment. We realize the results of these analyses only give a partial answer. More detailed analyses, based on actual MaaS use, are planned for the future.
The reminder of the paper is organized as follows. We will first investigate consumer interest to subscribe to MaaS and preferences for bundle composition. Next, scenario analyses will be conducted to assess the effect of transition probabilities on sustainable transportation. The paper is completed with a discussion of the results and avenues of future research.
2. Consumer choice of MaaS
In order to analyze how the transition from the currently used transportation mode to different configurations of bundled public and shared transportation modes in MaaS affects sustainable transportation, we need to first understand how consumers compose their MaaS bundles when they subscribe to MaaS. The chosen bundle of modes depends on consumers’ inherent preferences for transportation modes, the pricing scheme of each mode, monthly subscription fees, duration of the subscription, and consumers’ socio-demographic profiles.
2.1. Survey design
The data used in this study stem from a stated portfolio choice experiment, which was administered in August 2017 and March 2018. Whereas classic stated choice experiments ask respondents to choose a single alternative from sets of choice sets, portfolio choice experiments are based on a “pick-any” task (e.g. Wiley & Timmermans, Citation2009; Christelis et al., Citation2010; Charness & Gneezy, Citation2010; Bateman et al., Citation2016). The main goal of the choice experiment was to investigate individual preferences for MaaS subscription options, with a particular focus on bundle configuration. Choice of MaaS concerns a mobility decision, in which the decision is whether or not to subscribe to MaaS, allowing users to purchase a particular mobility package. Therefore, respondents were requested to indicate whether they would subscribe to the service under a set of specified features and, if so, to configure their preferred bundle by picking from one to four transportation modes from the given choice set composed of seven available modes. The available options were public transportation, e-bike sharing, e-car sharing, taxi, car rental, ride sharing, and on demand bus. These are all services currently available in the Netherlands. The choice situations systematically varied three platform attributes, seven transportation modes attributes, and four social influence attributes. Four levels were chosen for each attribute. shows the attribute levels used in the choice experiment.
Table 1. Attribute levels.
The first step in the design of a stated choice experiment is to elicit the attributes that are assumed to influence the behavior of interest. Usually, the elicitation process is based on either original qualitative research or on an examination of prior research. However, due to the limited number of available studies on consumers’ preferences for MaaS, the application of these elicitation methods seemed limited. Therefore, we identified the attributes and their levels based on the properties of MaaS schemes currently implemented around the world. This was particularly useful to elicit the core characteristics of this new type of service and create a realistic choice for respondents. We then looked at the emerging academic literature on MaaS, often based on individual and household interviews and focus groups conducted with some participants of a MaaS pilot (Sochor et al., Citation2016, Karlsson et al., Citation2016; Smile mobility, Citation2019). Lastly, we looked at research streams, such as adoption of innovations, bundling and multi-part tariff strategies, in fields other than transportation, such as marketing and social science (Caiati et al., Citation2020).
The combination of attributes and attribute levels gave rise to a 414 full factorial design. Because the number of profiles would be overwhelming and the experimental task impossible to complete by respondents, an orthogonal fractional factorial design in 128 runs was created to satisfy conditions of orthogonality and attribute level balance. The experiment was blocked into 16 orthogonal subsets, which were randomly assigned to the respondents.
A total of 1078 respondents from the Amsterdam and Eindhoven regions in the Netherlands were recruited through a Dutch market research company that maintains a representative online panel. Both areas currently have a variety of shared transportation services, making it easier for residents to imagine how MaaS services will work once implemented. In the experiment, respondents were asked to configure a bundle of transportation modes they would choose (they could choose up to four out of seven alternative modes). If they were not interested in MaaS, they did not have to configure a bundle. Note this task differs from the more commonly applied approach of choosing between given menu choice options of MaaS (e.g. Ho et al., Citation2018; Citation2020; Matyas & Kamargianni, Citation2019b). After having completed the bundle configuration task, respondents were presented a second choice experiment. Specifically, they were asked to choose between two possible sets of extra features to add to the basic service at an additional fee. A no-extra features option was added to the choice set. However, since this paper focuses on the mode choice perspective, only the first choice experiment is used in the present analyses. Since MaaS is still a largely unfamiliar concept, the survey started with an explanation of the concept. Caiati et al. (Citation2020) provide a more detailed description of the data collection and the distribution of socio-demographic characteristics of the sample.
2.2. Subscription
In this survey, only 17% of the choice sets led the respondents to state their intention to subscribe to MaaS. This low percentage may be indicative of the early stage of the adoption of MaaS. Therefore, individuals may think it is too risky to change their current travel behavior. If the theory of the diffusion of innovations (Rogers, 1964) that classifies consumers adopting new technologies into innovators, early adopters, early majority, late majority, and laggards would hold for MaaS, this percentage will likely increase once the service is implemented and used by the early adopters. Results also indicate that the probability of subscribing to MaaS strongly depends on the monthly fee and contract length.
2.3. Bundle choice
The percentage of the modes chosen in the MaaS bundles is shown in . Public transportation was chosen the most. It was included 831 times in a MaaS bundle out of the total of 1362 times across all experimental conditions respondents stated to take a subscription (61.0%). The least chosen mode is on-demand bus. It was only included 372 times (27.3%). Taxi also has a low percentage (33.6%). The other four modes (e-bike sharing, e-car sharing, car rental, ride sharing) show similar percentages (between 35% and 40%). also shows ownership or membership status of MaaS adopters for current public and shared transportation services. Only 204 consumers out of 369 MaaS adopters own a car (55.3%). Considering that 81% of the Dutch population owns a car (CBS, Citation2018), it seems that MaaS is preferred more among consumers who do not own a car. The percentage of bike owners among MaaS adopters is 86.7%, which is slightly higher than the percentage (84%) in the Dutch population (CBS, Citation2018). 13.3% of MaaS adopters own an e-bike, which is slightly higher than the 12.5% for the Netherlands (Kroesen & Harms, Citation2018). The percentage car-sharing memberships is 11.4%, while about half of the MaaS adopters (49.9%) own a season ticket for public transportation.
Table 2. Percentage of chosen mode in MaaS bundles and possessed ownership/membership of MaaS adopters.
To predict the probability of configuring a particular combination of transportation modes (bundle), the portfolio choice approach (e.g. Wiley & Timmermans, Citation2009) was applied. Note that because the experimental task was to choose one to four modes from seven possible mode alternatives in MaaS, the total number of possible bundles that respondents could configure is 98 Two combinations were never chosen, implying the total number of observed bundles of different composition equals
A mixed logit model was estimated to investigate the stated configuration of the bundles for the total of 369 respondents who indicated interest in MaaS. It should be noted that these data have been used before to estimate a portfolio choice model with a slightly different specification (Caiata, et al., 2020). More precisely, the specification of this study is extended with additional consideration of i) effect of platform attributes (monthly price and time commitment), ii) direct effect of socio-demographics, iii) effect of current mode choice behavior (environmentally friendly consumers vs. non-environmentally friendly consumers), and iv) interactions between platform attributes and pricing schemes.
The utility of each bundle can be formulated as:
(1)
(1)
where,
is the utility of bundle
(i = 1, …, 96) in the MaaS plan for individual n.
represents the deterministic utility and
is an error term.
The deterministic utility is specified as:
(2)
(2)
The first part indicates the total utility of subscription plan attributes l. Two such attributes were included in the model: monthly subscription fee and duration (contract length) of the subscription
(3)
(3)
The second part is the total utility of modes
that are included in bundle
configured by individual n. Mode-specific constants
and the pricing scheme
of mode m in bundle i are considered. That is,
(4)
(4)
where,
equals 1 if mode m is included in bundle i of individual n, and zero otherwise.
EquationEquation 4(4)
(4) assumes that the alternative specific utility for each mode in a bundle is independent of the composition of the bundle. To account for possible competition or synergy effects, cross effects between modes were estimated. A cross effect measures the change in utility of a mode due to the presence of another mode in the bundle. Thus,
(5)
(5)
Further, allowing for the common finding that the utility of mode may vary across individuals with a different socio-demographic profile and that the utility of subscription plan attributes may depend on socio-demographic characteristics, we estimated interaction effects between mode
and socio-demographic characteristics z, and between platform attributes l and pricing schemes.
(6)
(6)
Finally, we assumed that individual preferences for both subscription plan attributes (monthly subscription fee and subscription duration) and mode-specific utilities are heterogeneous. Therefore, random parameters for these attributes were estimated.
(7)
(7)
where
denotes the vector of means values of random coefficients. Choice probabilities were computed based on the simulated likelihood maximization approach with 2000 Halton draws using Nlogit 5 (Greene, Citation2012). Linear utility functions were estimated for subscription fee and duration of the subscription. All remaining categorical variables were effect-coded.
shows the estimation results. The upper part lists the parameter estimates of the platform attributes ( Equationequation 3
(3)
(3) ). The results indicate that consumers tend to prefer cheaper MaaS product bundles. This is consistent with our intuition and results of other studies (Ho et al., Citation2018, Citation2020; Matyas and Kamargianni, Citation2019a,Citationb). More specifically, the sign of the mean parameter is positive when the price is 150 €/month (0.59) and 180 €/month (0.24), whereas it is negative for a price of 210 €/month (−0.15) and 240 €/month (-0.68). Note the part-worth utility function is nonlinear with increasing price. In addition, consumers do not prefer MaaS product bundles with a subscription duration of less than 6 months. For subscriptions lasting longer than 6 months, their preferences become almost invariant. When the time commitment is 1 month, the mean parameter is negative (−0.34). i.e. lower than the average across all observations. Otherwise, it is positive: 0.03, 0.15, and 0.16 for respectively for 3, 6 and 12 months subscriptions. To the best of our knowledge, the effect of time commitment on the preference for MaaS product bundles has not been examined before, and hence this finding cannot be compared with the results of other studies.
Table 3. Bundle configuration decision – estimation results.
The middle part of shows the parameter estimates of the mode indicators and pricing schemes of each mode ( Equationequation 4
(4)
(4) ). The parameters for the mode indicators were estimated using the random parameter approach and the pricing schemes were effect-coded. The parameters for the mode-indicators show that public transportation is most preferred in the bundle. This is consistent with a previous finding (Matyas and Kamargianni, Citation2019a,Citationb). The mean of the parameter for the public transportation indicator is positive (0.90), whereas the means of the parameters for other mode indicators are all negative. Taxi is the least preferred mode (-2.78). The standard deviations for the mode indicators are statistically significant, implying that consumer preferences for modes are heterogeneous. The results of pricing schemes indicate that the largest negative value is for “pay per ride” for all alternative modes (PT-4, EB-4, EC-4, TX-4, CR-4, RS-4, and OD-4). This implies that consumer preferences for a mode strongly decrease for the “pay-per-ride” scheme. Also, if a mode includes the “unlimited rides” option (PT-1, EB-1, RS-1, and OD-1), that mode is the most preferred one, compared to the other pricing schemes. The results of socio-demographics reveal that MaaS bundles are more preferred by younger consumers (18–25). Also, they are less preferred by lower income consumers (< 1250 euros per month). The results of the currently used mode reveal that the MaaS bundles are more preferred by environmentally friendly consumers.
The lower part of shows the estimated cross-effects and interactions. Most cross-effects between modes are statistically significant. The cross-effect is highest for the combination e-bike sharing and taxi. This result indicates that respondents prefer to include both E-bike and taxi in their bundle. The cross-effect is most negative for the combination of car rental and on-demand bus. This result implies that respondents tend not to include both these modes in their bundle, suggesting substitution between these modes. Results show significant interactions between modes and some socio-demographics and transportation-related characteristics. The preference for public transportation is higher for the elderly (older than 65 years) and lower for younger consumers (younger than 25 years). Moreover, it is higher for males and low-income earners (less than 1250 euro per month). Shared E-bike is chosen less in the bundle by both younger and older consumers. On the other hand, female consumers and lower income groups (less than 1250 euro per month) tend to include this mode in their bundle. Shared E-car is chosen more by the group aged between 25 and 65, males, and the lower income group. High-income earners are more likely to include taxi in their bundle, while the lower income group is less likely to include it. A similar interaction is found for car rental. In addition, the elderly are less likely to include car rental in their bundle. Ride sharing is preferred by younger consumers, females, and the lower income group. On demand bus is preferred more by the elderly, while high-income earners prefer it less.
The results of the estimated interactions between platform attributes and pricing schemes are listed in . Common across the modes, the interactions are most negative for the pricing scheme of “pay-per-ride” (PT-4, EB-4, EC-4, TX-4, CR-4, RS-4, and OD-4) and monthly fees/time commitment. Interactions are most positive between the pricing scheme of “unlimited rides” (PT-1, EB-1, RS-1, and OD-1) and monthly fees/time commitment, meaning that the preference of the mode increases for the pricing scheme “unlimited rides”, as the fee increases and/or time commitment is longer. The pricing schemes involving a discount on the standard fare (PT-3, EB-3, EC-3, TX-3, CR-3, RS-3, and OD-3) have positive interactions with time commitment.
3. Scenario analysis
As discussed, policy makers are interested in the introduction of MaaS because this smart mobility solution is expected to decrease the purchase and use of private cars. That is, drivers are expected to shift their mode choice to environmental-friendly modes provided in MaaS bundles. The transition to the environmental-friendly modes is expected to decrease pollution, improving sustainable transportation. However, MaaS may also include non-environmental-friendly modes such as taxi and car rental. If current environmentally-friendly consumers who currently use environmentally-friendly modes such as bus, metro and bike switch to non-environmental-friendly modes (e.g. taxi and car rental), it has adverse effects on sustainability. Therefore, to maximize sustainable transportation, 1) the transitions of current non-environmentally-friendly consumers to MaaS bundles with only environmentally-friendly modes should be maximized, and 2) the transitions of current environmentally-friendly consumers to non-environmentally-friendly modes in their MaaS bundle should be minimized. These transitions depend on which bundles consumers subscribe to and their current transportation modes. Bundle choice in turn depends on pricing schemes and time commitment of the subscription. Therefore, scenario analyses were performed to assess the contribution of MaaS to improving sustainable transportation. Using the parameter estimates listed in , we will explore how consumer bundle choice will vary for different scenarios.
Based on the choice situations in the stated portfolio choice experiment, we varied the monthly subscription fees and time commitment from -30% to 30% at 10% intervals based on the interpolation or extrapolation of parameter estimates. Four scenarios were examined. shows the scenario settings. Scenario 1 varies only the monthly subscription fee. Scenario 2 varies only time commitment. Scenarios 3 and 4 vary both the subscription fees and time commitment. Specifically, Scenario 3 considers both changes in the same direction: monthly subscription fees and time commitment both increase or decrease. Scenario 4 varies the attributes in oppose direction: i) monthly subscription fee is increased and time commitment is decreased, and ii) monthly subscription fee is decreased and time commitment is increased.
Table 4. Scenario settings.
To quantify the effect, we first classified the 369 MaaS adopters (N) into two classes, based on their current transportation mode choice behavior: i) Current non-environmentally-friendly consumers (N1=249), and ii) Current environmentally-friendly consumers (N2=120). Environmentally friendly consumers were defined as respondents who do not use a private car, while all other respondents were classified as non-environmentally friendly consumers. The stated portfolio experiments led to 1362 cases, in which respondents indicated to subscribe to MaaS. Of these 1362 subscriptions, 837 subscriptions (O1) concerned non-environmentally-friendly consumers, while 525 subscriptions (O2) involved environmentally-friendly consumers. Next, the seven transportation modes provided by MaaS were categorized into two groups: a) non-environmentally-friendly modes, which included taxi, car rental and ride sharing, and b) environmentally-friendly modes, which included public transportation, e-bike sharing, e-car sharing and on-demand bus. Of the 837 subscriptions of current non-environmentally-friendly consumers (O1), subscriptions
only involved environmentally-friendly modes, while of the 525 subscriptions of environmentally-friendly consumers (O2), 184 subscriptions
included non-environmental-friendly modes in their MaaS bundle.
To assess the effect on sustainable transportation, the following index was constructed:
(8)
(8)
where,
denotes the number of current non-environmentally-friendly consumers,
indicates the number of MaaS subscriptions of current non-environmentally-friendly consumers,
refers to the number of MaaS subscriptions of current non-environmentally-friendly consumers only composed of environmentally-friendly modes in scenario s. Likewise,
represents the number of current environmentally-friendly consumers,
indicates the number of MaaS subscriptions of current environmentally-friendly consumers,
refers to the number of MaaS subscriptions of current environmentally-friendly consumers that include non-environmentally-friendly modes in scenario s. N denotes the total number of respondents. Therefore, by definition,
and
and
are relative weights, and the term 1/N normalizes the scale of the index.
By normalizing the scale, index Q has a value between -1 and 1. There are two extreme cases: (i) when there are no current non-environmentally-friendly consumers indicating that all the respondents are current environmentally-friendly consumers
and they always include non-environmental-friendly modes in their MaaS bundle
Consequently, Q = −1, and ii) when there are no current environmentally-friendly consumers
indicating that all respondents are current non-environmentally-friendly consumers
and they only include environmentally-friendly modes in their bundle
Consequently, Q = 1. Thus, a higher value of index Q indicates more sustainable transportation.
shows the number of MaaS subscriptions for the different scenarios. First, the number of MaaS subscriptions in which current non-environmentally-friendly consumers only consider environmentally-friendly modes in MaaS
are shown in . In scenario 1, current non-environmentally-friendly consumers more include non-environmentally-friendly modes in their MaaS bundle with an increasing monthly subscription fee. As time commitment is longer in scenario 2, current non-environmentally-friendly consumers tend to select MaaS bundles with only environmentally-friendly modes. The number of MaaS subscriptions in which current non-environmentally-friendly consumers include only environmentally-friendly modes is more sensitive to differences in the monthly subscription fee than to differences in time commitment. When the monthly fee increases and time commitment is longer (scenario 3), the number of MaaS subscriptions of non-environmentally-friendly consumers that only include environmentally-friendly modes slightly. As the monthly subscription fee becomes more expensive and time commitment becomes shorter (scenario 4), current non-environmentally-friendly consumers dramatically include non-environmentally-friendly modes in their bundle.
Table 5. Changes in frequencies by scenario.
(a) The number of times non-environmentally-friendly consumers compose a MaaS bundle with only environmentally-friendly modes
(b) The number of times environmentally-friendly consumers include non-environmentally-friendly modes in a MaaS bundle
(a)
Second, the number of MaaS subscriptions of current environmentally-friendly consumers that include non-environmentally-friendly modes via MaaS is reported in . As the monthly subscription fee becomes more expensive in scenario 1, current environmental-friendly consumers choose more non-environmental-friendly modes, whereas they choose less non-environmental-friendly modes as time commitment becomes longer in the scenario 2. The number does not change much as the monthly fee increases and time commitment is longer in scenario 3. This may be because the effects of a higher expensive monthly subscription fee and longer time commitment are at odds with each other. In scenario 4, as the monthly subscription fee becomes more expensive and time commitment becomes shorter, current environmental-friendly consumers dramatically choose more non-environmental-friendly modes.
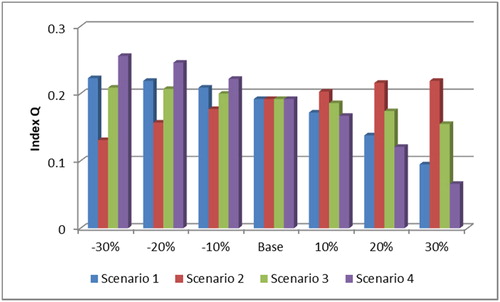
shows the effect of each scenario on the index of sustainability (equation 7) by combining changes in both and
In scenario 1, the value of the index decreases with increasing monthly subscription fees. This implies that higher fees undermine sustainable transportation. This is because both current non-environmentally-friendly consumers and environmentally-friendly consumers tend to include more non-environmentally-friendly modes in their MaaS bundle as shown in . On the other hand, the value of the index only slightly increases as the monthly subscription fee decreases. In scenario 2, the longer time commitment leads to improved sustainable transportation. However, the effect of varying time commitment is smaller than the effect of monthly subscription fee. In scenario 3, the change in the value of index Q across the selected variables is smaller than for any other scenario. Especially when the monthly subscription fee becomes cheaper, and time commitment becomes shorter, only a marginal change in the value of index Q is observed, implying their effects largely canceled out each other. The change in the value of index Q is the biggest for scenario 4. The synergy effect of a higher monthly subscription fee and a shorter time commitment is smaller, compared to the effect of a higher monthly subscription fee in scenario 2. In summary, the monthly subscription fee and time commitment of MaaS have a non-linear effect on the index. Lower subscription fees and longer time commitment contribute most to a change toward improved sustainable transportation.
Figure 1. The effect of the scenarios on the index of sustainable transportation.
4. Concluding remarks
Very recently, MaaS has attracted the attention of many researchers and policy makers as an innovative solution to improving sustainable transportation systems. It is expected that the use of state-of-the-art technology to book, schedule and pay for door-to-door transportation services will reduce the need of consumers to use private cars, and even postpone and ultimately stop buying a car, leading to an improvement of sustainable transportation. This study critically examines this expectation. We argue that MaaS may indeed improve but also deteriorate the sustainability of the transportation system, depending on the kind of transitions between transportation modes that are induced. In turn, subscriptions to the new service depend on attributes such as monthly subscription fee, time commitment, and pricing schemes for the transportation modes, associated with particular MaaS bundles. On the one hand, current car owners may switch to MaaS and choose bundles that only include public and active transportation modes. On the other hand, current users of public transportation and slow modes may choose bundles that include car-rental and car-sharing options. The ultimate effect of MaaS on the sustainability of the transportation system then depends on the magnitude of these two different transitions.
In order to understand these conflicting processes, a stated portfolio choice experiment was designed, and administered in two main regions in the Netherlands. The survey results show that at the current state of development respondents are not inclined to subscribe to the new service in large numbers, implying that more publicity is required to help consumers understand the service. Respondents who indicate to subscribe to the new service mostly include public transportation in their MaaS bundle. It suggests that public transportation is the key to implementing MaaS. The estimated cross effects between transportation modes are significant. Whereas the cross-effect is most positive for the combination of e-bike sharing and taxi, it is most negative for the combination of car rental and on-demand bus. The interactions between pricing schemes of different modes and platform attributes (monthly subscription fee and time commitment) are statistically significant. Especially the pricing scheme of non-environmentally-friendly modes (taxi, car rental) show significant interactions with platform attributes. Some socio-demographic characteristics show significant interactions with the modes.
The estimated portfolio choice model was used as the basis for scenario analyses which were performed to assess the contribution of MaaS to improved sustainable transportation. The impact of MaaS was quantified in terms of the difference in expected number of transitions of current non-environmentally-friendly consumers to environmentally-friendly modes in MaaS, and the number of transitions of current environmentally-friendly consumers to non-environmentally-friendly modes. The results show that the effect of MaaS is non-linear. With decreasing monthly subscription fees between 105 and 312 euro and/or increasing time commitment between 0.7 and 15.6 months, the results of the scenario analyses suggest an increasing contribution of MaaS to improved sustainable transportation.
To complete this paper, some final comments are in order. First, although the focus of the present paper is about sustainability, this is not the only policy goal underlying MaaS. Although the overall effect on improving sustainable transportation systems may be small, there may be other good reasons for implementing MaaS. Second, it should be emphasized that the current scenario results are based on the data collected in two regions in the Netherlands. Further analyses are needed to differentiate between areas, differing in terms of degree of congestion, ease of finding a parking lot, price of parking, quality of the public transportation system, etc. Third, the adoption of MaaS and its effect on sustainable transportation highly depend on the share of the current modes in the targeted city/region. As discussed, the early adopters of MaaS are expected to be current public transportation users. Therefore, if the share of public transportation is high in the target city, we expect the adoption rate to be higher. However, in this case, the impact of MaaS on improving the sustainability of the transportation system would be lower, or even worse. Vice versa, a lower share of public transportation likely leads to a lower adoption rate, but to a higher impact of MaaS on the sustainability of the transportation system. Fourth, the transitions between modes are based on consumers’ stated choices. Finally, and most importantly, the current analyses are based on bundle composition and thus do not relate to changes in the use of transportation modes and activity-travel patterns and the associated changes in emissions. For a more elaborate analysis of the effects of MaaS on sustainable transportation, future studies should collect such behavioral data and incorporate these in the scenario analysis.
Acknowledgements
This research was conducted as part of the project “Smart Cities Responsive Intelligent Public Transportation System – SCRIPTS”, financially supported by the Netherlands Organization for Scientific Research (NWO) as part of the program “Smart Urban Regions in the Future” (SURF).
References
- Bateman, H., Eckert, C., Geweke, J., Louviere, J., Satchell, S., & Thorp, S. (2016). Risk presentation and portfolio choice. Review of Finance, 20(1), 201–229. https://doi.org/10.1093/rof/rfv001
- Becker, H., Balac, M., Ciari, F., & Axhausen, K. W. (2020). Assessing the welfare impacts of shared mobility and mobility as a service (MaaS). Transportation Research Part A: Policy and Practice, 131, 228–243. https://doi.org/10.1016/j.tra.2019.09.027
- Beheshtian, A., Geddes, R. R., Rouhani, O. M., Kockelman, K. M., Ockenfels, A., Cramton, P., & Do, W. (2020). Bringing the efficiency of electricity market mechanisms to multimodal mobility across congested transportation systems. Transportation Research Part A: Policy and Practice, 131, 58–69. https://doi.org/10.1016/j.tra.2019.09.021
- Caiati, V., Rasouli, S., & Timmermans, H. J. P. (2018). Innovation adoption and diffusion in transportation: Modelling the long-term demand for new mobility services based on platform technology [Paper presentation]. Paper Presented at the 97th Annual Meeting of Transportation Research Board, Washington, DC.
- Caiati, V., Rasouli, S., & Timmermans, H. J. P. (2020). Bundling, pricing schemes and extra features preferences for mobility as a service: Sequential portfolio choice experiment. Transportation Research Part A: Policy and Practice, 131, 123–148. https://doi.org/10.1016/j.tra.2019.09.029
- CBS. (2018). Trends in the Netherlands 2018. https://longreads.cbs.nl/trends18-eng/society/figures/traffic/.
- Charness, G., & Gneezy, U. R. I. (2010). Portfolio choice and risk attitudes: An experiment. Economic Inquiry, 48(1), 133–146. https://doi.org/10.1111/j.1465-7295.2009.00219.x
- Christelis, D., Jappelli, T., & Padula, M. (2010). Cognitive abilities and portfolio choice. European Economic Review, 54(1), 18–38. https://doi.org/10.1016/j.euroecorev.2009.04.001
- Clewlow, R. R., & Mishra, G. S. (2017). Disruptive transportation: The adoption, utilization, and impacts of ride-hailing in the United States. Institute of Transportation Studies, University of California. Research Report UCD-ITS-RR-17-07.
- Cottrill, C. D. (2020). MaaS surveillance: Privacy considerations in mobility as a service. Transportation Research Part A: Policy and Practice, 131, 50–57. https://doi.org/10.1016/j.tra.2019.09.026
- Ebrahimi, S., Sharmeen, F., & Meurs, H. (2018). Innovative business architectures (BAs) for mobility as a service (MaaS): Exploration, assessment, and categorization using operational MaaS cases [Paper presentation]. Paper Presented at the 97th Annual Meeting of the Transportation Research Board, Washington, DC.
- Esztergár-Kiss, D., & Kerény, T. (2019). Creation of mobility packages based on the MaaS concept. Travel Behaviour and Society, https://doi.org/10.1016/j.tbs.2019.05.007
- Feneri, A. M., Rasouli, S., & Timmermans, H. J. P. (2019). Mobility-as-a service in the Netherlands: The implementation of a stated choice experiment to examine travel behavior adaptations [Paper presentation]. Paper Presented at the 15th Biannual Network on European Communications and Transport Activities Research (NECTAR) Conference, Helsinki, Finland.
- Greene, W. H. (2012). NLOGIT. Version 5. Reference guide, p. 667. http://people.stern.nyu.edu/wgreene/DiscreteChoice/Software/NLOGIT5Referencel.pdf.
- Hartikainen, A., Pitkänen, J. P., Riihelä, A., Räsänen, J., Sacs, I., Sirkiä, A., Uteng, A. (2019). WHIMPACT: Insights from the world’s first Mobility-as-a-Service (MaaS) system. https://maas-alliance.eu/whimpact-insights-from-the-worlds-first-mobility-as-a-service-maas-system.
- Heikkilä, S. (2014). Mobility as a Service - A proposal for action for the public administration, case Helsinki [Master’s thesis, Aalto University, Helsinki].
- Hensher, D. A. (2017). Future bus transport contracts under a mobility as a service (MaaS) regime in the digital age: Are they likely to change? Transportation Research Part A: Policy and Practice, 98, 86–96. https://doi.org/10.1016/j.tra.2017.02.006
- Hesselgren, M., Sjöman, M., & Pernestål, A. (2020). Understanding user practices in mobility service systems: Results from studying large scale corporate MaaS in practice. Travel Behaviour and Society. https://doi.org/10.1016/j.tbs.2018.12.005
- Ho, C. Q., Hensher, D. A., Mulley, C., & Wong, Y. Z. (2018). Potential uptake and willingness-to-pay for mobility as a service (MaaS): A stated choice study. Transportation Research Part A: Policy and Practice, 117, 302–318. https://doi.org/10.1016/j.tra.2018.08.025
- Ho, C. Q., Mulley, C., & Hensher, D. A. (2020). Public preferences for mobility as a service: Insights from stated preference surveys. Transportation Research Part A, 131, 70–90.
- Jittrapirom, P., Caiati, V., Feneri, A. M., Ebrahimigharehbaghi, S., Alonso-González, M. J., & Narayan, J. (2017). Mobility as a service: A critical review of definitions, assessments of schemes, and key challenges. Urban Planning, 2(2), 13–25. https://doi.org/10.17645/up.v2i2.931
- Jittrapirom, P., Marchau, V., van der Heijden, R., & Meur, H. (2020). Future implementation of mobility as a service (MaaS): Results of an international Delphi study. Travel Behavior and Society. in press.
- Kamargianni, M., & Matyas, M. (2017). The business ecosystem of mobility-as-a-service [Paper presentation]. Paper Presented at the 96th Annual Meeting of the Transportation Research Board, Washington, DC.
- Karlsson, I. C. M., Mukhtar-Landgren, D., Smith, G., Koglin, T., Kronsell, A., Lund, E., Sarasini, S., & Sochor, J. (2020). Development and implementation of mobility-as-a-service: A qualitative study of barriers and enabling factors. Transportation Research Part A: Policy and Practice, 131, 283–295. https://doi.org/10.1016/j.tra.2019.09.028
- Karlsson, I. C. M., Sochor, J., & Strömberg, H. (2016). Developing the ‘service’ in mobility as a service: Experiences from a field trial of an innovative travel brokerage. Transportation Research Procedia, 14, 3265–3273. https://doi.org/10.1016/j.trpro.2016.05.273
- Kim, Y., Kim, E., Jang, S., & Kim, D. (2020). Mode choice models of private car user and public transportation user towards mobility-as-a-service: Integrated choice and latent variable approach [Paper presentation]. Paper Presented at the 99th Annual Meeting of the Transportation Research Board, Washington, DC.
- König, D., Eckhardt, J., Aapaoja, A., Sochor, J., Karlsson, M. (2016). Deliverable 3: Business and Operator Models for MaaS. MAASiFie Project Funded by CEDR. https://www.vtt.fi/sites/maasifie/PublishingImages/results/cedr_mobility_MAASiFiE_deliverable_3_revised_final.pdf.
- Kroesen, M., & Harms, L. (2018). User characteristics and trip patterns of e-bike use in the Netherlands: Results from the Dutch national travel survey and the mobility panel Netherlands. KiM Netherlands Institute for Transport Policy Analysis. Available at: https://english.kimnet.nl/publications/presentations/2018/04/10/user-characteristics-and-trip-patterns-of-e-bike-use-in-thenetherland
- Matyas, M., & Kamargianni, M. (2019a). The potential of mobility as a service bundles as a mobility management tool. Transportation, 46(5), 1951–1968. https://doi.org/10.1007/s11116-018-9913-4
- Matyas, M., & Kamargianni, M. (2019b). Survey design for exploring demand for Mobility as a Service plans. Transportation, 46(5), 1525–1558. https://doi.org/10.1007/s11116-018-9938-8
- Merkert, R., Bushell, J., & Beck, M. J. (2020). Collaboration as a service (CaaS) to fully integrate public transportation–Lessons from long distance travel to reimagine mobility as a service. Transportation Research Part A: Policy and Practice, 131, 267–282. https://doi.org/10.1016/j.tra.2019.09.025
- Meurs, H., & Timmermans, H. J. P. (2017). Mobility as a Service as a multi-sided market: Challenges for modeling [Paper presentation]. Paper Presented at the 96th Annual Meeting of the Transportation Research Board, Washington, DC.
- Meurs, H., Sharmeen, F., Marchau, V., & van der Heijden, R. (2020). Organizing integrated services in mobility-as-a-service systems: Principles of alliance formation applied to a MaaS-pilot in the Netherlands. Transportation Research Part A: Policy and Practice, 131, 178–195. https://doi.org/10.1016/j.tra.2019.09.036
- Mulley, C., Nelson, J. D., & Wright, S. (2018). Community transport meets mobility as a service: On the road to a new a flexible future. Research in Transportation Economics, 69, 583–591. https://doi.org/10.1016/j.retrec.2018.02.004
- Pickford, A., & Chung, E. (2019). The shape of MaaS: The potential for MaaS Lite. IATSS Research, 43(4), 219–225. https://doi.org/10.1016/j.iatssr.2019.11.006
- Polydoropoulou, A., Pagoni, I., Tsirimpa, A., Roumboutsos, A., Kamargianni, M., & Tsouros, I. (2020a). Prototype business models for Mobility-as-a-Service. Transportation Research Part A: Policy and Practice, 131, 149–162. https://doi.org/10.1016/j.tra.2019.09.035
- Polydoropoulou, A., Tsouros, I., Pagoni, I., & Tsirimpa, A. (2020b). Exploring individual preferences and willingness to pay for mobility as a service [Paper presentation]. Paper Presented at the 99th Annual Meeting of the Transportation Research Board, Washington, DC.
- Schikofsky, J., Dannewald, T., & Kowald, C. (2020). Exploring motivational mechanisms behind the intention to adopt mobility as a service (MaaS): Insights from Germany. Transportation Research Part A: Policy and Practice, 131, 296–312. https://doi.org/10.1016/j.tra.2019.09.022
- Singh, M. (2020). India’s shift from mass transit to MaaS transit: Insights from Kochi. Transportation Research Part A: Policy and Practice, 131, 219–227. https://doi.org/10.1016/j.tra.2019.09.037
- Smile mobility. (2019). The smile project. http://smile-einfachmobil.at/pilotbetrieb_en.html.
- Sochor, J., Karlsson, I. C. M., & Strömberg, H. (2016). Trying out mobility as a service. Transportation Research Record: Journal of the Transportation Research Board, 2542(1), 57–64. https://doi.org/10.3141/2542-07
- Sochor, J., Strömberg, H., & Karlsson, I. C. M. (2015). Implementing mobility as a service: Challenges in integrating user, commercial, and societal perspectives. Transportation Research Record: Journal of the Transportation Research Board, 2536(1), 1–9. https://doi.org/10.3141/2536-01
- Strömberg, H., Karlsson, I. C. M., & Sochor, J. (2018). Inviting travelers to the smorgasbord of sustainable urban transport: Evidence from a MaaS field trial. Transportation, 45(6), 1655–1670. https://doi.org/10.1007/s11116-018-9946-8
- Wiley, J. B., & Timmermans, H. J. P. (2009). Modelling portfolio choice in transportation research. Transport Reviews, 29(5), 569–586. https://doi.org/10.1080/01441640902829462
- Wong, Y. Z., & Hensher, D. A. (2020). Delivering mobility as a service (MaaS) through a broker/aggregator business model. Transportation, in press.