
Abstract
Use of life cycle assessment (LCA) in choice of road corridor could reduce environmental impacts of traffic and infrastructure. This paper explores how the LCA model LICCER, designed to compare life cycle climate impact and energy use of alternative road corridors, fulfills practitioners’ requirements concerning data availability and usefulness for decision-making. Results are based on a case study where the model was applied to a Swedish road reconstruction project and a workshop with potential users of the model. In the case study, the shorter construction alternatives had the lowest traffic related impacts and the highest infrastructure related impacts. Earthworks, soil stabilization, and pavement contributed most to infrastructure related impacts. For the stakeholders, the LICCER model was considered useful because it includes both traffic and infrastructure, includes default data that the user can replace by project specific data, identifies possible improvements, and presents results relative to a reference alternative. However, the model could be improved by including further nation specific default data, different traffic scenarios depending on the road corridor, more detailed traffic scenarios, and an uncertainty assessment of the model output. These findings may be useful in the development and improvement of LCA models and when evaluating the suitability of existing models for use in early planning.
1. Introduction
The transport sector is a significant contributor to climate change (Blanco et al., Citation2014), accounting for 24% of global energy related greenhouse gas (GHG) emissions (International Energy Agency, Citation2018). The majority of these emissions (74%) are due to road transport (International Energy Agency, Citation2018). In addition, construction, operation, maintenance, and demolition of road infrastructure results in GHG emissions. In 2009, the construction sector emitted 5.7 billion tonnes CO2 globally, making construction one of the largest carbon emitting sectors (Huang et al., Citation2018). Several studies have assessed the contribution of road infrastructure to the overall environmental impacts of road transport. Based on a review of such studies, Hill et al. (Citation2012) concluded that road infrastructure accounted for 10-40% of road transport GHG emissions, depending on factors such as traffic volume, surface type, and maintenance measures.
Policy-makers in the transport sector show a growing interest in life cycle assessment (LCA) as a decision-support tool to reduce the climate impact of road infrastructure. This interest can be seen for example in the financing of research projects under the ERA-NET road program Sustainability and Energy Efficient Management of Roads (Carlson & Folkeson, Citation2014). Other examples are the development of EU Green Public Procurement Criteria for road infrastructure (Garbarino et al., Citation2016), and use of LCA in planning and procurement of road infrastructure by the Swedish Transport Administration (Toller & Larsson, Citation2017).
To reduce the environmental impact of road transport, a life cycle perspective is called for throughout the whole planning process of a construction project (Huang et al., Citation2015): (1) in choice of transport mode on national and project level, (2) in choice of road corridor and construction type (plain road, bridge, and tunnel) of a specific project, and (3) in choice of specific construction design (Miliutenko et al., Citation2014).
The greatest opportunity to influence life cycle impacts of transport occurs in early planning stages (Hammervold, Citation2014; Karlsson et al., Citation2017; O’Born et al., Citation2016), such as choice of road corridor and construction type. The choice of road corridor influences route length and construction type and has thereby a large influence on environmental impacts from future traffic on the road and on impacts from road construction, operation, and maintenance. It was found that, when comparing alternative routes for road construction, energy savings of up to 47% could be achieved in construction when choosing the route option with the lowest energy requirements (‘Energy conservation in road pavement design’ [ECRPD], 2010).
At the same time there is limited access to project specific data, such as type and quantity of construction materials, required to complete the LCA (Butt et al., Citation2015; Kluts & Miliutenko, Citation2012; Oduro & Lautala, Citation2017). Such information does not become available until the design stage (Butt et al., Citation2015), when opportunities to influence life cycle impacts are lower. This problem can be referred to what Bhander et al. (Citation2003) call the paradox of eco-design: while product knowledge increases over time, the possibilities for improving environmental performance decrease. Product knowledge is greatest by the end of the process, but then only minor changes can be made to product design. Consequently, in early planning of road construction, environmental performance must be evaluated based on a limited amount of input data.
Several LCAs have been conducted for road infrastructure projects that are either under construction or have already been completed (see for example Barandica et al., Citation2013; Bouhaya et al., Citation2009; Du et al., Citation2014; Gulotta et al., Citation2018; Guo et al., Citation2019; Huang et al., Citation2015; Liu et al., Citation2019; Miliutenko et al., Citation2012; O’Born, Citation2018; Stripple, Citation2001; Trunzo et al., Citation2019). Such studies are useful in showing which aspects are most significant to include in an LCA made in early planning and in providing a source of inventory data (Huang et al., Citation2015); however, they do not consider the specific challenges occurring in early planning.
To support the integration of LCA in decision-making, several LCA models with different scope have been developed, for example: asPECT (Wayman et al., Citation2012), CEREAL (Spriensma et al., Citation2014), CHANGER (Huang et al., Citation2013), CO2NSTRUCT (Fernández-Sánchez et al., Citation2015), Dubo-Calc (Cenosco & Royal HaskoningDHV, n.d.), ECORCE (Jullien et al., Citation2015), EFFEKT (Sandvik & Hammervold, Citation2011; Straume & Bertelsen, Citation2015), Carbon Tool (Highways England, Citation2016), Joulesave (ECRPD, 2010), Klimatkalkyl (Toller & Larsson, Citation2017), LICCER (Potting, Birgisdóttir, Brattebø, Kluts et al., 2013), as well as others reviewed by Miliutenko et al. (Citation2014) and Santos et al. (Citation2017).
However, many of these models require input data not available in early planning of road construction. Previous research (Miliutenko et al., Citation2014) has found that only EFFEKT, Joulesave, LICCER, and Klimatkalkyl have been developed for choice of road corridor. EFFEKT is used by The Norwegian Public Roads Administration for cost-benefit analysis (including life cycle GHG emissions and energy use) of construction projects (Sandvik & Hammervold, Citation2011; Straume & Bertelsen, Citation2015). Joulesave was produced in the research project Integration of Energy Into Road Design for calculating energy use of traffic and infrastructure in alternative road corridors (ECRPD, 2010). The LICCER model was developed in the research project Life Cycle Considerations in Environmental Impact Assessment of Road Infrastructure (LICCER) (2012-2013) to quantify GHG emissions and energy use of alternative road corridors (Potting, Birgisdóttir, Brattebø, Kluts et al., 2013). Klimatkalkyl was developed by the Swedish Transport Administration (STA) in 2013 and is now used to quantify climate impact and primary energy use of Swedish road and railway infrastructure throughout the whole planning process: from route selection to follow-up (Toller, Citation2018).
A limited number of studies have been found that reports the use of LCA in early planning of transport infrastructure. The majority of those studies concern the application of the aforementioned models in case studies. Sandvik and Hammervold (Citation2011) used EFFEKT to show how GHG emissions and energy use vary for alternative road corridors and how this affects the benefits of a construction project. In the research project ECRPD, Joulesave was used to investigate possible energy savings that could be achieved by applying the model in choice of road corridor (ECRPD, 2010). The LICCER model was applied in Sweden to test model robustness and to develop the scope and outline of the model (Liljenström, Citation2013; Liljenström et al., 2013). Later, the model was also used in Norway to show how a simplified LCA can be conducted in early planning of a road construction project and how results from the LCA can help road planners in deciding between construction alternatives (O’Born et al., Citation2016).
The models EFFEKT, LICCER, and Klimatkalkyl have also been compared to each other with the purpose of identifying similarities and differences between them (Chrysovalantis Lemperos & Potting, Citation2015; Ebrahimi et al., Citation2016).
Additional work has been made by Oduro and Lautala (Citation2017) who assessed GHG emissions of three alternative routes for transporting nickel and copper ore from mine to refinery, aiming to compare a simplified and a detailed LCA approach.
This paper builds on research conducted within the research project LICCER. The aim is to explore the demands that practitioners have on LCA-based models used in early planning (concerning availability of input data to the model and the usefulness of model outputs for decision-making) and how well the LICCER model corresponds to those demands. This is done in order to further evaluate the LICCER model and to provide recommendations for development and improvement of LCA based models in early planning.
2. The LICCER model
The LICCER model (Potting, Birgisdóttir, Brattebø, Kluts et al., 2013) is an Excel based model that quantifies life cycle GHG emissions and energy use of road infrastructure elements (bridges, tunnels, and plain roads) and traffic in alternative road corridors in a planned construction project. The model can compare life cycle impacts of up to three road corridors with each other and a reference alternative representing the situation if the project is not undertaken. Although the LICCER model was specifically developed for use in Sweden, Norway, Denmark, and the Netherlands, it could be used in any country by supplementing the data included in the model.
This section briefly describes the LICCER model. For additional details, the reader is referred to the LICCER model guideline report (Lundberg et al., Citation2013) and the LICCER model technical report (Brattebø et al., 2013).
2.1. Life cycle assessment methodology
The calculations in the LICCER model are based on LCA methodology. LCA methodology consists of four phases (International Organization for Standardization, Citation2006):
goal and scope definition, including choice of functional unit and system boundaries (section 2.2)
data inventory, involving data collection and processing for all life cycle stages (section 2.3)
impact assessment, involving translation of inventory data to environmental impact contribution (section 2.4)
interpretation of results from the data inventory and impact assessment (section 2.5).
2.2. Functional unit and system boundaries
The functional unit in the LICCER model is “Road infrastructure enabling annual traffic between ‘A’ and ‘B’ over an analysis time horizon of a defined number of years” (Brattebø et al., 2013).
The LICCER model quantifies annual GHG emissions and energy use of material production (including extraction of raw materials), construction, operation, and end-of-life for road infrastructure elements and of traffic on the road during operation (). Each life cycle stage is described below:
Figure 1. System boundaries of the LICCER model (adapted from Brattebø et al., 2013).
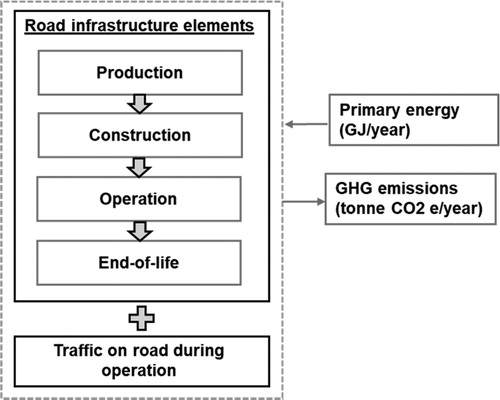
Production: includes raw material extraction and processing, material production, manufacturing of construction components, and transportation of raw materials to production and manufacturing.
Construction: includes transportation from production and manufacturing to the construction site, fuel use in construction machinery, earthworks, transport of excavated masses within the project, and electricity use on site during construction.
Operation: includes production of materials for resurfacing and maintenance of the road, transportation from material production to the construction site, road lighting, and ventilation of tunnels. Carbon sequestration of concrete and lime during road operation is not accounted for.
End-of-life: includes energy use for road deconstruction and material removal, transportation to depot, and earthworks to restore the land area. No GHG emissions from landfilling of construction materials are accounted for. Environmental burdens and benefits of material recycling are allocated to the system that uses the recycled materials.
Traffic: includes operation of traffic on the road (accounting for traffic volume and different types of vehicles and fuels).
The model includes default data representative of construction conditions in Sweden and Norway. Annual GHG emissions and energy use is calculated over an analysis period set by the user, for example 20 years, based on average traffic conditions during that analysis period and by dividing life cycle GHG emissions and energy use of a road element with a fixed service life (Brattebø et al., 2013).
2.3. Data inventory
The LICCER model automatically quantifies material, fuel, and electricity consumption in all life cycle stages based on user input and a set of default data included in the model. User input () covers project specific data for infrastructure (for example length and width of road elements) and traffic (for example traffic volume and projected annual traffic increase) in the road corridors (Brattebø et al., 2013). Default data () includes for example transport distance of construction materials and fuel consumption for traffic.
Table A1. User input (project specific data) required to use the LICCER model.
Table 1. Participants at the workshop (not including developers of the LICCER model).
2.4. Impact assessment
The environmental impact categories included in the LICCER model are cumulative energy demand (CED) and climate impact. The aim was to complement environmental assessments (Brattebø et al., 2013) that include local environmental impacts but, at the time the LICCER model was developed, often excluded life cycle GHG emissions and energy use (Brattebø et al., 2013; Finnveden & Åkerman, Citation2014; Miliutenko et al., Citation2014).
Based on the quantities of material, fuel, and electricity (see section 2.3), the LICCER model automatically calculates GHG emissions and energy use in each life cycle stage based on default values () for GHG emissions and energy use of resource input. The datasets for specific GHG emissions of materials and energy use per unit of resource input () include already characterized data, expressed in kilogram CO2 equivalents (for climate change) and MJ (for cumulative energy demand). Climate impact was measured as Global Warming Potential (GWP100) (Goedkoop et al., Citation2013). CED represents direct and indirect energy use (Jungbluth & Frischknecht, Citation2010). In this paper, the indirect energy use includes the feedstock energy.
Since the LICCER model was designed for use at national road authorities, no license is needed to access any of the default data. Hence ecoinvent (Wernet et al., Citation2016), a common LCA database, was not used as a source of emission data.
2.5. Interpretation
Results from the LICCER model are intended to help in the choice of road corridor. The LICCER model presents annual impacts in terms of GHG emissions (kg CO2 equivalents/year) and energy use (MJ/year) for each road corridor (including the reference alternative) in several ways (Lundberg et al., Citation2013):
impacts of traffic and infrastructure in each road corridor,
impacts of traffic and infrastructure in each road corridor relative to the reference alternative,
impacts of each road element and life cycle stage, and
impacts of different material and energy inputs.
The model can help in decision-making by showing which road corridor has the lowest life cycle GHG emissions and energy use. By showing environmental hotspots (life cycle stages and resource inputs that contribute most to life cycle impacts) of each road corridor the model can also help planners identifying measures to reduce environmental impacts.
3. Methods
3.1. Case study using the LICCER model
The LICCER modelFootnote1 was used to assess life cycle GHG emissions and energy use, environmental hotspots (life cycle stages, construction activities, and materials that contribute most to GHG emissions and energy use), and critical parameters (project specific and default parameters that have the largest influence on the outcome of the study) of alternative road corridors in a construction project. Results from the case study are used to discuss data availability in relation to a specific construction project and to suggest when to use project specific data in early planning.
The case study used was the reconstruction of road 55 between Yxtatorpet and Malmköping in south-eastern Sweden. This case study had also been used previously to test previous versions of the LICCER model (Liljenström, Citation2013; Liljenström et al., 2013). There were several reasons for choosing this case. It provided good data availability compared to other construction projects in the early planning stage and also involved several construction measures (plain road, extended road, and bridge), which allowed the testing of several features of the LICCER model. The project had also been analyzed previously by Shamoon (Citation2012) using the model Joulesave, which allowed comparison of case study results to a previous study.
The road section was reconstructed between April 2012 and September 2014. This case study was not conducted as a part of the actual planning process and had no influence on the choice of road corridor.
The feasibility study (Englund & Dahlin, Citation2006) conducted in planning of the construction project compared three road corridors (Alternative 1-3) () with a reference alternative (Alternative 0) that represented the existing situation. The construction alternatives compared in the case study are presented below:
Figure 2. The map shows the location of the three road corridors (Alternative 1, Alternative 2, and Alternative 3) compared in the case study (Englund & Dahlin, 2006). ©Lantmäteriet.
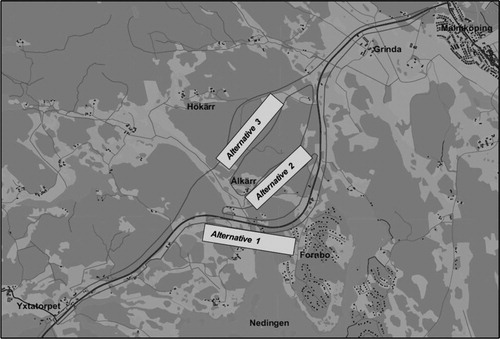
Alternative 0: The reference alternative includes only measures needed for maintaining ordinary function of the road (Englund & Dahlin, Citation2006) and so it includes no new construction or major reinvestment projects. The road section is about 7.5 km long.
Alternative 1: The existing road, about 7.5 km long, is widened from 9 to 14 meters and the road profile is adjusted.
Alternative 2: The beginning and end of the existing road is widened from 9 to 14 meters. A new road section, about 2.6 km long, and a new bridge are constructed. The total road length between Yxtatorpet and Malmköping in this alternative is about 6.9 km.
Alternative 3: The beginning and end of the existing road is widened from 9 to 14 meters. A new road section, about 3.0 km, and a new bridge are constructed. The total road length between Yxtatorpet and Malmköping in this alternative is about 6.6 km. This alternative was the one selected for construction.
The functional unit was, according to the LICCER model (see section 2.2) “Road infrastructure enabling annual traffic between Yxtatorpet and Malmköping over an analysis time horizon of 20 years”. The time horizon 20 years was chosen since it is the common dimensioning period for road infrastructure in Sweden.
Different approaches were used to find project specific input data for infrastructure ():
Table A2. Default data of the LICCER model (LICCER_LCA-model_v1 0) used in the case study.
Data were compiled directly from the feasibility study (Englund & Dahlin, Citation2006).
Estimations were based on qualitative descriptions and scenarios in the feasibility study (Englund & Dahlin, Citation2006).
Estimations were based on previous road construction projects (Karlsson & Carlson, Citation2010) with similar traffic density and road width.
Project specific input data on traffic () at the start of the analysis period were provided by the Swedish Road Administration (via Shamoon, Citation2012), reflecting the conditions that were the basis for road design. Future fuel use was estimated from a previous scenario analysis (Hansson & Grahn, Citation2013) representing the target that the Swedish Transport Administration had in 2012 for the Swedish transport system in 2030.
Table A3. Project specific data for infrastructure in the different road corridors (Alt. 1-3) and the reference alternative (Alt. 0).
Table A5. Resulting data inventory for the different life cycle stages of road corridors.
Available data were modified to fit the scope of the LICCER model. Material, fuel, and electricity use in each road corridor () was quantified based on the project specific data and default data.
Table A4. Project specific data for current and future traffic operation on the road (common for all road corridors and the reference alternative).
A sensitivity analysis was conducted to identify critical parameters, i.e. the parameters where a change in input data and default data has the biggest influence on the results. In the sensitivity analysis, parameters that influenced resulting GHG emissions and energy use of hotspots were, one at a time, increased by 10%. The sensitivity analysis included only changes to infrastructure parameters since these differed significantly between road corridors. While changes to traffic related parameters influence the quantitative results, the same traffic scenario is used in all road corridors (because the roads are dimensioned for a specific traffic scenario) so changes to traffic related parameters do not influence ranking of road corridors. A sensitivity analysis for traffic in the case study was conducted previously using an earlier version of the LICCER model (Liljenström, Citation2013; Liljenström et al., 2013).
3.2. Stakeholder involvement in model development
During development of the LICCER model, a workshop was held aiming to discuss relevance and applicability of the model in the decision-making process with potential users of the LICCER model: national road administrations, researchers, and consultants working with environmental assessment of road infrastructure in Sweden, Norway, Denmark, and the Netherlands. The workshop was held in Stockholm, Sweden in September 2013. Of about 85 persons invited, 12 attended the workshop, most of them working at Swedish consultancies or with research at Swedish universities and research institutes (). The majority of the participants were familiar with LCA in the context of road infrastructure planning; however, none of them was directly involved in decisions on road corridor at a road administration.
The case presented in section 3.1 was used as a basis for discussions at the workshop. An interactive exercise was held to guide the participants through each step needed to conduct an LCA with the LICCER model (Potting et al., Citation2013). Each step of the exercise was followed by a questionnaire on data availability, usefulness of model outputs, and ease of use. The questionnaire is available in the workshop report by Potting et al. (Citation2013). At the end of the workshop, participants and developers of the LICCER model discussed the questions in a plenary discussion. Notes taken by the LICCER team during the workshop and answers from the questionnaires are summarized in the workshop report.
After the workshop, the LICCER model was further developed based on workshop participants’ comments on ease of using the model. This paper only discusses participants’ answers on accessibility of input data and usefulness of results for choice of road corridor.
4. Results
4.1. Stakeholder views
4.1.1. Data availability
A problem expressed generally at the workshop was that data needed to use the LICCER model are rarely available in early planning. However, workshop participants believed it would be possible to make estimates of this data. Participants appreciated the default data in the LICCER model since they considered it particularly difficult to quantify those parameters, for instance transport distance, specific material consumption, and specific GHG emissions. A general request was the access to default data that are nation specific and approved by the national road authority. Participants also suggested that a model containing default data on material and energy use for construction of roads, tunnels, and bridges could simplify use of LCA in choice of road corridor. By providing the opportunity to insert project specific data instead of default data, the model provides enough flexibility.
About traffic related parameters, participants expressed that many of these are available at national road authorities or from other sources, but they also noted the high uncertainty in these parameters. For example, while road authorities measure the traffic density on the infrastructure stock, the data are often relatively old. Prognoses and scenario analyses for future traffic increase and proportion of fuels depend on factors such as market intervention by authorities and assumed development of transport needs. If road traffic should be allowed to increase in the future is a politically dependent question. Since results depend a lot on traffic related parameters, workshop participants suggested that model users should test the outcome by changing these input parameters in a sensitivity analysis.
4.1.2. Usefulness of results
The workshop participants thought the LICCER model provides results that are useful in choice of road corridor particularly because the model includes both traffic and infrastructure, identifies possible improvements, and presents results relative to a reference alternative. However, it was pointed out that including the same traffic scenario in all road corridors may not be realistic.
To understand the influence of uncertain data on differences between road corridors, participants suggested that the user should include an uncertainty analysis. At the same time, including an uncertainty analysis increases the model’s complexity. Participants also pointed out that, for use in decision-making, national road authorities must integrate the model in the planning process. Therefore, the model must complement tools already used for other purposes.
Some participants expressed that they would benefit from a model that can also guide in choice of transport mode. Currently, the LICCER model cannot be used for that purpose.
4.2. Case study
4.2.1. Life cycle energy use and GHG emissions
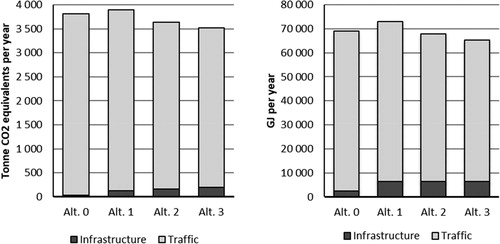
Traffic operation accounted for 94-99% of the life cycle GHG emissions (about 3 330-3 770 tonnes CO2 equivalents per year) and 90-97% of the life cycle energy use (about 58 780-66 590 GJ per year) in the three road corridors and the reference alternative (). Infrastructure accounted for 40-200 tonnes CO2 equivalents and 2 350- 6 420 GJ per year, depending on construction alternative. The significant influence of traffic depends on the traffic scenario used, for example the proportion of electric vehicles on the road. With a larger proportion of electric vehicles, the GHG emissions of traffic would be lower. In the LICCER model, GHG emissions and energy use of traffic operation are directly related to the road length and they were therefore highest in Alternative 0 and Alternative 1 that are longer than the other road corridors.
Figure 3. Annual GHG emissions (tonne CO2 equivalents) and energy use (GJ) of infrastructure and traffic in the three road corridors (Alt. 1-Alt.3) and the reference alternative (Alt.0).
shows annual GHG emissions and energy use of infrastructure and traffic in the three road corridors relative to the reference alternative, for example ΔAlt.3 = Alt.3-Alt.0. Alternative 2 and 3, which have shorter driving distance for vehicles than Alternative 0, showed traffic related emission savings (290-440 tonnes CO2 equivalents per year) as well as energy savings (5 060-7 810 GJ per year) compared to the reference alternative. However, all new road corridors (Alternative 1-3) had higher infrastructure related GHG emissions (80-160 tonnes CO2 equivalents per year) and energy use (4 030-4 070 GJ per year) than the reference alternative because they require construction work (widening the road and building new road sections) and more asphalt for resurfacing (since they are wider).
Figure 4. Annual GHG emissions (tonne CO2 equivalents) and energy use (GJ) of infrastructure and traffic in the three road corridors (Alt. 1-Alt.3) and the reference alternative (Alt.0) relative to the reference alternative (ΔAlt.X = Alt.X-Alt.0).
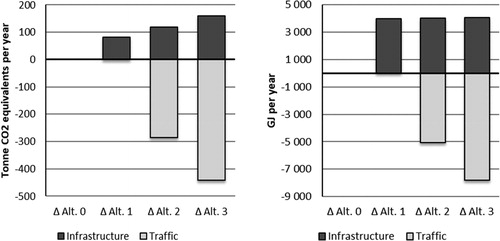
Hence, because Alternative 3 is the shortest construction alternative, it had lowest overall GHG emissions and energy use () and the largest savings of GHG emissions and energy compared to the reference alternative (). However, Alternative 3 had higher infrastructure related GHG emissions than the other alternatives and about the same infrastructure related energy use (). Since Alternative 3 have more difficult construction conditions and therefore require larger quantities of earthworks and soil stabilization than the other road corridors, GHG emissions and energy use of the production and construction stages were highest in Alternative 3. However, since Alternative 3 is the shortest road corridor, less material is required for resurfacing and there is a smaller road area to restore at end-of-life; hence GHG emissions and energy use of operation and end-of-life were lower for Alternative 3 than for the other alternatives.
Figure 5. Annual GHG emissions (tonne CO2 equivalents) and energy use (GJ) of infrastructure life cycle stages in the three road corridors (Alt.1-Alt.3) and the reference alternative (Alt.0).
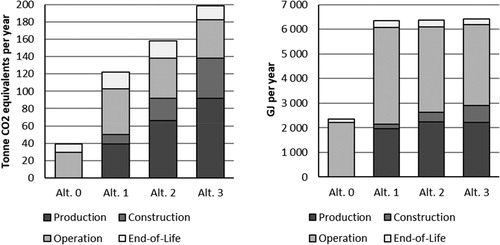
Energy use was dominated by the operation stage in all new road corridors as well as the reference alternative (). The operation stage had higher relative importance to energy use than to GHG emissions because feedstock energy (i.e. the chemical energy stored in the bitumen) was included for bitumen used in resurfacing.
and show the contribution of different construction parts and processes to infrastructure related GHG emissions and energy use. Production based GHG emissions are influenced by the construction conditions in each road corridor. In Alternative 1, which involves only widening of the existing road, materials for the pavement, base layer, and sub-base layer (i.e. bitumen and aggregates) had the highest contribution to production related GHG emissions. However, in Alternative 2 and 3 that have more difficult construction conditions, a larger proportion of GHG emissions are due to soil stabilization (i.e. cement and lime) and explosives. In Alternative 3, which involves the largest volumes of rock excavation, explosives contributed more to production based GHG emissions than the pavement layer. The bridge in Alternative 2 and 3 contributed to about 1% of the production related GHG emissions.
Figure 6. Contribution of construction parts and processes to the annual GHG emissions of each life cycle stage (production, construction, operation, and end-of-life) for the different road corridors (Alt.1-Alt.3) and the reference alternative (Alt.0).
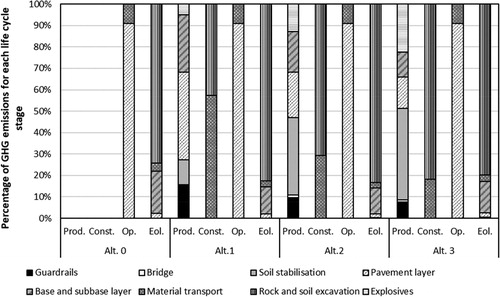
Figure 7. Contribution of construction parts and processes to the annual energy use of each life cycle stage (production, construction, operation, and end-of-life) for the different road corridors (Alt.1-Alt.3) and the reference alternative (Alt.0).
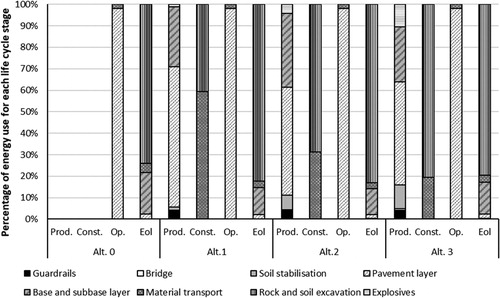
Production based energy use was however dominated by the pavement layer, base layer, and sub-base layers in all construction alternatives, due to the feedstock energy included for bitumen.
GHG emissions and energy use of the construction stage were mainly due to earthworks in Alternative 2 and 3. Material transport had a more significant contribution to emissions and energy use in Alternative 1, which involves less earthworks. Common for all alternatives, GHG emissions and energy use of infrastructure operation was mainly due to the pavement layer required for resurfacing. Also in all alternatives, GHG emissions and energy use of end-of-life was mainly due to diesel use for earthworks required to restore the road area.
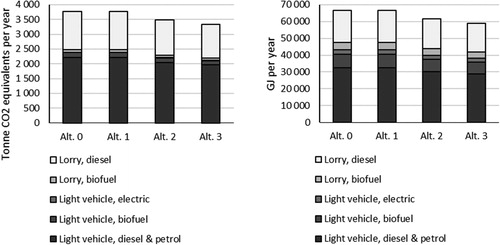
While infrastructure related impacts are influenced by the road corridor characteristics, traffic related impacts depend on a traffic scenario that is the same in all road corridors. Hence, the proportion of impacts due to different types of vehicles and fuels is the same in all new road corridors as well as in the reference alternative (). Light vehicles accounted for 63% of the traffic related GHG emissions and 65% of the traffic related energy use. Both for light vehicles and lorries, fossil fuels (diesel and petrol) accounted for the largest share of emissions and energy use. In total, biofuels and electric vehicles accounted for 7% of the GHG emissions and 23% of the energy use. This difference is due to electric vehicles and biofuels having relatively low GHG emissions per MJ.
Figure 8. Annual GHG emissions (tonne CO2 equivalents) and energy use (GJ) of different types of vehicles and fuels in the three road corridors (Alt.1-Alt.3) and the reference alternative (Alt.0).
4.2.2. Critical parameters
In all road corridors, including the reference alternative, the resulting infrastructure GHG emissions and energy use were sensitiveFootnote2 to changes in parameters related to the quantity of asphalt needed during the road lifetime (assumption of resurfacing period) ( and ). When the resurfacing period was decreased by 10%, the resulting GHG emissions increased by 2.5-8.4%, and the resulting energy use increased by 5.7-10.5%, depending on construction alternative. Assumption of resurfacing period was especially important for Alternative 0 that have no impacts from production or construction and for Alternative 1 where little construction work was made.
Figure 9. Sensitivity analysis for life cycle GHG emissions of infrastructure.
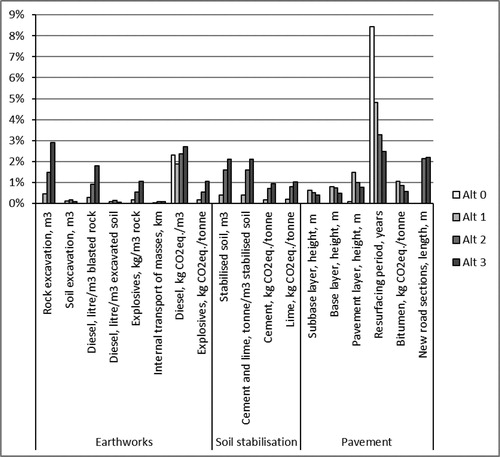
Figure 10. Sensitivity analysis for life cycle energy use of infrastructure.
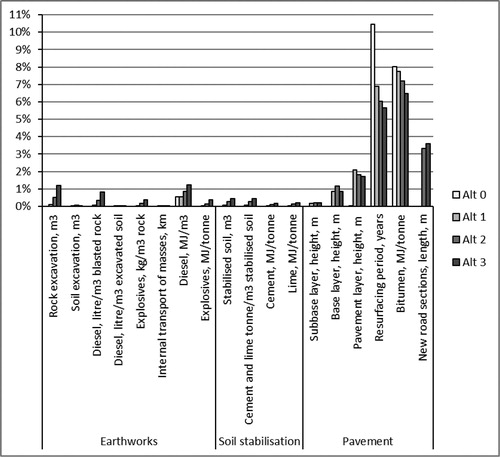
Resulting GHG emissions and energy use were also sensitive to changes in parameters that affect the impacts of earthworks (specific GHG emissions of diesel) and pavement (energy use per unit of bitumen input), respectively ( and ). When the value of these parameters were increased by 10%, the resulting GHG emissions increased by 1.9-2.7% and the resulting energy use increased by 6.5-8.0%, depending on construction alternative. Assumption of specific GHG emissions of diesel was most important for the construction alternatives using the largest quantities of diesel for earthworks in the construction stage, as well as for Alternative 0 that had a relatively high proportion of impacts from the end-of-life stage where diesel is used for earthworks.
Particularly for Alternative 3, which required larger volumes of rock excavation and soil stabilization than the other alternatives, resulting GHG emissions were also sensitive to changes in the volume of excavated rock as well as volume of soil stabilization, and quantity of lime and cement needed for soil stabilization ().
Because infrastructure had a small contribution to life cycle GHG emissions and energy use compared to traffic, increasing the value of infrastructure related parameters did not have a significant influence on the overall results and did not change the ranking of road corridors.
5. Discussion
Using LCA for decision support in choice of road corridor provides an opportunity to influence significantly the life cycle impacts of traffic and infrastructure. However, because of limited access to project specific data, environmental performance must be evaluated based on a limited amount of input data. LCA models for use in choice of road corridor are available and have been applied in case studies; however, it has not been investigated whether they fulfill LCA practitioners’ requirements on such models. Identifying such requirements can give recommendations for development of LCA based models and aid in evaluation of existing models for suitability in early planning. Based on a workshop with LCA practitioners and a case study, this paper explores how the LCA model LICCER corresponds to practitioners’ demands concerning availability of input data to the model and the usefulness of model outputs for decision-making.
5.1. Availability of project specific and default input data
It was clear from the workshop that the project specific data required to use the LICCER model is limited in early planning and that default data is required to complete an LCA. Naturally, the variation in such default data is large (because, by necessity is has been collected from different other sources). For example, the assumed default diesel use for soil excavation is several times higher in Klimatkalkyl 3.0 than in the LICCER model and the assumed default quantity of explosives for rock blasting is twice as high (Karlsson et al., Citation2017). In terms of traffic, default data (for example fuel consumption) may vary between different roads depending on local conditions such as road incline and speed limit. Thus, the default data included in the model may not be representative of the actual construction project.
Uncertainty in default data may affect the outcome of the LCA; however, in case default data is common for all road corridors, they do not necessarily influence the ranking between road corridors. In the case study of this paper for example, some default data in the LICCER model, particularly specific emission and energy use of diesel and bitumen, had high importance for results. Since these default data were common for all road corridors (and there was not a very significant difference in quantity), they did not influence ranking of construction alternatives. However, in other construction projects, uncertainty in default data may vary between road corridors and affect the resulting ranking. For example, in another LICCER case study (O’Born et al., Citation2016) one construction alternative included a tunnel, which follows straightforward construction guidelines, whereas the other construction alternative included a bridge, which has larger variations in construction design. Thus, the uncertainty in concrete related emissions was lower in the construction alternative that included a tunnel.
By increasing the number of default parameters in the LICCER model, data collection could be further simplified. At the workshop, participants suggested that models like Klimatkalkyl, containing default data for different construction types in Sweden, may be easier to use by reducing the complexity of input data. When the LICCER model was developed, such default data were not yet available so this approach was not implemented in the LICCER model (Potting et al., Citation2013). However, the model may now be extended by such data.
At the same time, default data on construction types could possibly make the model too simple to differentiate the road corridors, thereby making the model unsuitable for decision-making. Especially for volumes of excavated rock and soil, type of soil stabilization method, and quantity of soil stabilization needed, default data should be used with caution. Because requirements on earthwork and soil stabilization vary largely between projects, site-specific data are preferred to get reliable results for decision-support in early planning. LCA based models could be combined with methods to provide site-specific volumes of rock and soil excavation. By using available tools such as geographic information systems, mass haul optimization models, and software for road alignment, usability of LCA models for early planning support may be improved without losing simplicity.
To some extent, characteristics of the specific construction project determine what parameters should be project specific. Including the possibility to replace default data with project specific data is therefore required for simple but flexible models, for improved usability of the model, and for reliability of results for decision-making. According to the workshop participants, the possibility to replace the default data was also one of the benefits of the LICCER model.
As noted above, project specific data is required for the parameters that differentiate the road corridors, in other words the parameters that do not have the same value in each road corridor. In addition, parameters that can be influenced in early planning should be project specific so that possibilities for improvements can be identified. Some characteristics, for example land use, are important to consider in early planning LCA of road infrastructure because more precise calculations in later planning stages may not help to reduce environmental impacts of the project design (Butt et al., Citation2015). Other aspects, for example impacts of specific construction materials, are influenced mainly by decisions taken in the design stage and these are therefore of smaller relevance in the choice of road corridor.
Some parameters may, in early planning, be influenced mainly by changing the road length. In the case study, this was the case for asphalt quantities (more asphalt is required for a longer road) and traffic (more emissions from traffic the longer the driving distance). Thus, the shortest road corridor will likely have the lowest impact of these parameters. Project specific data is therefore especially important for the parameters that are not specifically related to the road length. However, it should be noted that for traffic, this conclusion depends on the level of detail in the traffic scenarios. A more detailed assessment of traffic related impacts than what is included in the LICCER model may be warranted (as discussed in section 5.2) and in that case, the traffic related impacts may not be directly related to the road length.
It should be noted that project specific data is not necessarily less uncertain than default data. In the case study for instance, the volumes of excavated rock and soil in each road corridor were estimated in the feasibility study and were therefore considered parameters with good data availability. Even so, the uncertainty in these parameters is high. Karlsson et al. (Citation2017) found that the actual volume of excavated soil during construction of Alternative 3 in this case study was 16% lower than estimated in the feasibility study and that the actual volume of excavated rock was 62% lower than estimated in the feasibility study. For traffic, many of the project specific parameters, for example annual traffic increase and fuel types used at the end of the analysis period, are based on assumptions on future traffic development and technologies.
The project specific parameters may be environmental hotspots of the system, but not necessarily. For example, in the case study, earthworks and soil stabilization had low emissions and energy use compared to traffic on the road and did not influence the ranking of road corridors. However, the environmental impacts of earthworks and soil stabilization are aspects that planners can influence by choice of road corridor. Additionally, earthworks and soil stabilization are naturally site specific (they differentiate the road corridors) and the volumes of excavated materials and stabilized soil do not necessarily decrease by choosing a shorter road corridor. In the case study, the shortest road corridor involved more rock excavation and soil stabilization than the other alternatives. Considering the general variability in earthworks and soil stabilization, it is recommended that default data is not used for earthwork volumes, soil stabilization method, and volume of stabilized soil in early planning LCA of road infrastructure.
5.2. Usefulness of model output for decision-making
A requirement for use of LCA models in decision-making is that they provide reliable results. Because road construction projects are unique, results from road LCAs cannot be directly compared (Barandica et al., Citation2013). Literature studies have however indicated general patterns regarding important life cycle stages and construction activities. These include the dominance of traffic related impacts (Hill et al., Citation2012), the relative importance of material production and construction compared to maintenance and end-of-life (Barandica et al., Citation2013; Gulotta et al., Citation2018), and the importance of earthworks in case of difficult construction conditions (Barandica et al., Citation2013). Generally, results from the case study comply well with such findings. The ranking of road corridors is also the same as in the case study using Joulesave (Shamoon, Citation2012), although the LICCER model resulted in significantly higher energy use (Liljenström, Citation2013). Other studies have indicated that the LICCER model results in lower GHG emissions and energy use than Klimatkalkyl version 2.0 and 3.0 (Chrysovalantis Lemperos & Potting, Citation2015) and EFFEKT (Ebrahimi et al. 2016).
The workshop participants thought the LICCER model was useful for decision-making because it compares impacts of traffic and infrastructure in the road corridors. However, the model can be improved in this respect. The importance of traffic related impacts (as seen in the case study) indicates a need to include more detailed traffic scenarios that allow identifying improvement measures related to traffic.
One way to improve the model is to include additional details on road geometry, such as speed limit and incline. The model could also be improved by including the possibility to consider different traffic scenarios (for example traffic volume and annual traffic increase) depending on the road corridor. Accounting for different traffic scenarios becomes important in case the reference alternative cannot sustain the traffic levels predicted on the new road. This was likely the event in the case study; hence, potentially, no emission savings were made compared to the reference alternative.
Another reason to include different traffic scenarios is to analyze potential tradeoffs of constructing shorter roads. For example, if the reference alternative is replaced by a shorter road, traffic related emissions may decrease (due to shorter driving distance); however, emissions may likewise increase due to new and shorter roads inducing more traffic (see for example the overview by Streimikiene et al., Citation2013). If the shortest road corridor also requires construction of tunnels and bridges, total life cycle impacts may not decrease compared to the reference situation.
Including more detailed traffic scenarios in LCA models for early planning would probably not increase the complexity of the model (considering the traffic data available at road authorities); however, the results would be more relevant for decision-making (considering that other benefits highlighted at the workshop was the opportunity to compare with the reference alternative and identify possible improvement measures).
Due to the presence of assumptions in infrastructure LCA, decisions are inevitably made under significant uncertainty. Understanding and communicating this uncertainty is necessary for the reliability of results and for the acceptance of LCA as part of the decision-making process (Igos et al., Citation2019; Zhao et al., Citation2017). For comparative studies, the practitioner must understand whether he/she should question the preference for one alternative due to uncertainties (Igos et al., Citation2019).
At the workshop, it was recommended that scenarios and uncertainty analysis should be included when using the LICCER model, but it was also recognized that this might increase the complexity of the model and thereby conflict with the goal of keeping the model simple and easy to use. Thus, practical ways to handle uncertainty treatment in the LICCER model as well as in other LCA models are required. Recently, Igos et al. (Citation2019) have provided recommendations for uncertainty treatment including approaches applicable when little data is available. Additionally, Larsson Ivanov et al. (Citation2019) discuss methods to evaluate uncertainty specifically in LCA of infrastructure, using the model Klimatkalkyl as an example. It needs to be further evaluated whether these recommendations are suitable for integration in the LICCER model as well as for other models used in early planning, depending on the decision-making context and who will use the model.
The scope of the LICCER model is limited to climate impact and primary energy use, thus conclusions cannot be drawn on what road corridor is best from a life cycle perspective. Further research is required to verify whether conclusions from this paper are valid also for other impact categories, regarding both data availability and requirements on model output.
In addition, the road corridor with lowest life cycle environmental impacts will not necessarily perform best also from other perspectives, such as technical, local environment, social, etc. At the workshop, participants pointed out that an LCA model must complement other forms of decision support used in planning. The LICCER model was developed as a stand-alone tool that can be used in parallel to the environmental impact assessment process (Potting, Birgisdóttir, Brattebø, Kluts et al., 2013). LCA can also be integrated in the environmental assessment (Miliutenko et al., Citation2014) – an option that could be suitable in other geographical contexts.
Multi-criteria decision-making has been suggested as a method to integrate several different environmental impacts (del Mar Casanovas-Rubio & Ramos, Citation2017), social sustainability of transport infrastructure (Sierra et al., Citation2018), and in general for sustainable decision-making in construction, when a number of criteria must be evaluated (Zavadskas et al., Citation2017). Other requirements may be placed on LCA when it is integrated with other forms of decision support; these have not been considered in this paper.
5.3. Limitations of the study
Results from this paper reflect the views of the workshop participants: mainly Swedish researchers and consultants familiar with LCA of road infrastructure, however not directly involved in decisions on choice of road corridor. The perception of data availability, the acceptance and knowledge of uncertainty, and the importance of model output likely depend on the user of the model. Therefore, it needs to be further confirmed whether findings in this paper also reflect requirements from the road administrations in the participating countries as well as potential users of the LICCER model from Norway, Denmark, and the Netherlands.
Results also reflect the views of the workshop participants in 2013. Since then, an increased focus has been placed on the climate impact of transport infrastructure. For example, since 2016, the STA places climate requirements in procurement of construction and maintenance of road and rail infrastructure and in procurement of construction materials (Toller & Larsson, Citation2017). Additionally, the Swedish construction sector has adapted the target to reduce their GHG emissions, from a life cycle perspective, with 50% to 2030 and to be climate neutral by 2045 (Fossilfritt Sverige, Citation2018). Such initiatives could potentially lead to different requirements on model outputs to help achieve these targets.
At the same time, several of the requirements put forward at the workshop have been recognized in other contexts. For example, Meex et al. (Citation2018) analyzed user requirements on LCA based tools for use in early building design. Among them are: a limited amount of input data consistent with the specific decision-making stage; use of default values for missing data (unknown material types and quantities) that should, when possible, be based on national averages for representative results; include both construction and operation (in that case operational energy use); simple output adapted to the specific decision-making stage. While another decision context than described in this paper, this may point to some general requirements for usefulness of models in early planning stages with little specific data and several construction options.
6. Conclusion
Including LCA in early planning of road construction may give planners decision support to reduce life cycle impacts of a road at a planning stage where there are large opportunities to reduce the life cycle impacts of the road. This paper has explored demands that practitioners have on LCA models used in early planning (concerning availability of input data and the usefulness of model outputs for decision-making), and how the LCA model LICCER fulfills these demands. Findings from this paper could be useful in the development and improvement of LCA models for use in early planning of road construction (in choice of road corridor) and in the evaluation of suitability of existing models for use in early planning.
Based on results from this paper, it is recommended that an LCA model for use in early planning fulfills the following requirements:
It includes default data that is nation specific and preferably approved by the national road authority. If possible, the model should include national default data for construction measures such as different types of roads, bridges, and tunnels.
It provides the ability to replace default data by project specific data.
It includes traffic as well as infrastructure for alternative road corridors and is able to differentiate the road corridors both in terms of traffic and in terms of infrastructure.
It identifies possible improvements both for traffic and for infrastructure.
It presents results relative to a reference alternative.
It includes opportunities to assess the uncertainty in the results.
It provides results that complement other decision-making tools.
Planners are recommended to find project specific data for parameters that can be influenced in early planning, that differentiate the alternative road corridors, and that are not specifically related to the road length. These parameters may be hotspots of the system, but not necessarily. In particular, it is recommended that default data should not be used for site-specific parameters such as volumes of earthworks, soil stabilization method, or volume of soil stabilization.
The LICCER model fulfills several of the requirements above, but can be improved by including further nation specific default data for different construction measures (now made available in Sweden through the model Klimatkalkyl), different traffic scenarios depending on the road corridor, more detailed traffic scenarios, and an assessment of uncertainty in the model output.
Further research is needed to understand how to best include uncertainty assessment and how model requirements change when LCA is combined with other tools in the decision-making process. Additional research is also required to confirm whether findings are generally applicable also to other groups of LCA practitioners and to other case studies than included in this paper.
Acknowledgements
This study was performed as part of the project “Life Cycle Considerations in Environmental Impact Assessment of Road Infrastructure (LICCER)”. We would like to thank the ERA NET Road Programme for financing the project. Additional support was provided through the VINNMER programme from Vinnova – Swedish Agency for Innovation Systems.
Additional information
Funding
Notes
1 Modelling was made using the LICCER model version 1.0 from December 2013; however, the model was updated to correct for some calculation errors.
2 Here defined as an increase by at least 2% when the parameter value was increased or decreased by 10%.
References
- Barandica, J. M., Fernández-Sánchez, G., Berzosa, Á., Delgado, J. A., & Acosta, F. J. (2013). Applying life cycle thinking to reduce greenhouse gas emissions from road projects. Journal of Cleaner Production, 57, 79–91. https://doi.org/10.1016/j.jclepro.2013.05.036
- Bhander, G. S., Hauschild, M., & McAloone, T. (2003). Implementing life cycle assessment in product development. Environmental Progress, 22(4), 255–267. https://doi.org/10.1002/ep.670220414
- Blanco, G., Gerlagh, R., Suh, S., Barrett, J., de Coninck, H. C., Diaz Morejon, C. F., Mathur, R., Nakicenovic, N., Ahenkora, O.A., Pan, J., Pathak, H., Rice, J., Richels, R., Smith, S.J., Stern, D.I., Toth, F.L., & Zhou, P. (2014). Drivers, trends and mitigation. In: O. Edenhofer, R. Pichs-Madruga, Y. Sokona, E. Farahani, S. Kadner, K. Seyboth, A. Adler, I. Baum, S. Brunner, P. Eickemeier, B. Kriemann, J. Savolainen, S. Schlömer, C. von Stechow, T. Zwickel & J.C. Minx (Eds.), Climate Change 2014: Mitigation of Climate Change. Contribution of Working Group III to the Fifth Assessment Report of the Intergovernmental Panel on Climate Change (pp. 351–412). International Panel of Climate Change.
- Bouhaya, L., Le Roy, R., & Feraille-Fresnet, A. (2009). Simplified environmental study on innovative bridge structure. Environmental Science & Technology, 43(6), 2066–2071. https://doi.org/10.1021/es801351g
- Brattebø, H., O'Born, R., Miliutenko, S., Birgisdóttir, H., Lundberg, K., Toller, S., Potting, J. (2013). LICCER Model Technical Report. Account of technical backgrounds of the LICCER model (Report No. 4.2 [final report] December 2013). Retrieved from https://www.cedr.eu/strategic-plan-tasks/research/era-net-road/call-2011-energy/liccer-project-results/.
- Butt, A. A., Toller, S., & Birgisson, B. (2015). Life cycle assessment for the green procurement of roads: a way forward. Journal of Cleaner Production, 90, 163–170. https://doi.org/10.1016/j.jclepro.2014.11.068
- Carlson, A., & Folkeson, L. (2014). Sustainability and energy efficient management of roads. Retrieved from https://www.cedr.eu/strategic-plan-tasks/research/era-net-road/call-2011-energy/.
- Cenosco & Royal HaskoningDHV. (n.d.). DuboCalc. Retrieved from https://www.dubocalc.nl/en/.
- Chrysovalantis Lemperos, X., & Potting, J. (2015). Comparison of Klimatkalkyl, LICCER & SimaPro – Three models to quantify life cycle energy and carbon dioxide in early road infrastructure planning. KTH Royal Institute of Technology. Department of sustainable development, environmental science and engineering.
- del Mar Casanovas-Rubio, M., & Ramos, G. (2017). Decsion-making tool for the assessment and selection of construction processes based on environmental criteria: Application to precast and cast-in-situ alternatives. Resources, Conservation & Recycling, 126, 107–117. https://doi.org/10.1016/j.resconrec.2017.07.035
- Delft University of Technology. (2012). Idemat2012 [Dataset]. Retrieved from http://www.ecocostsvalue.com/EVR/model/theory/subject/5-data.html.
- Du, G., Safi, M., Pettersson, L., & Karoumi, R. (2014). Life cycle assessment as a decision support tool for bridge procurement: environmental impact comparison among five bridge designs. The International Journal of Life Cycle Assessment, 19(12), 1948–1964. https://doi.org/10.1007/s11367-014-0797-z
- Ebrahimi, B., Wallbaum, H., Brattebø, H., Vingnisdottir, H. R., Bohne, R. A., & Booto, G. K. (2016). Environmental Life Cycle Assessment (LCA) of road pavements: Comparing the quality and point of application of existing software tools on the basis of a Norwegian Case Study. In N. Achour (Ed.), Proceedings of the CIB World Building Congress 2016: Volume V – Advancing products and services (pp. 749–760). Department of Civil Engineering.
- Energy conservation in road pavement design [ECRPD]. (2010). Energy conservation in road pavement design, maintenance and utilisation. Retrieved from https://ec.europa.eu/energy/intelligent/projects/en/projects/ecrpd.
- Englund, J., & Dahlin, A. (2006). Väg 55, delen Yxtatorpet-Malmköping. Vägutredning. Samrådshandling 2006-01-25 [Road 55, section Yxtatorpet-Malmköping. Feasability study. Consultation report 2006-01-25]. Swedish Road Administration.
- Fernández-Sánchez, G., Berzosa, Á., Barandica, J. M., Cornejo, E., & Serrano, J. M. (2015). Opportunities for GHG emissions reduction in road projects: a comparative evaluation of emissions scenarios using CO2NSTRUCT. Journal of Cleaner Production, 104, 156–167. https://doi.org/10.1016/j.jclepro.2015.05.032
- Finnveden, G., & Åkerman, J. (2014). Not planning a sustainable transport system. Environmental Impact Assessment Review, 46, 53–57. https://doi.org/10.1016/j.eiar.2014.02.002
- Fossilfritt Sverige. (2018). Färdplan för fossilfri konkurrenskraft. Bygg- och anläggningssektorn [Roadmap for fossil free competitiveness. The building and construction sector]. Retrieved from http://fossilfritt-sverige.se/wp-content/uploads/2018/01/ffs_bygg_anlggningssektorn181017.pdf.
- Fritsche, U. (2005). Process-oriented Basic Data for Environmental Management Instruments - www.probas.umweltbundesamt.de. The International Journal of Life Cycle Assessment, 10(3), 225–225. https://doi.org/10.1065/lca2005.03.004
- Garbarino, E., Rodriguez Qunitero, R., Donatello, S., & Wolf, O. (2016). Revision of green public procurement criteria for road design, construction and maintenance. Procurement practice guidance document. (EUR 28028 EN). Joint Research Centre.
- Gode, J., Martinsson, F., Hagberg, L., Öman, A., Höglund, J., Palm, D., Ekvall, T., Hallberg, L., Högberg, J., Ljunggren Söderman, M., Jerksjö, M. & Rydberg, T. (2011). Miljöfaktaboken 2011: Uppskattade emissionsfaktorer för bränslen, el, värme och transporter. [Miljöfaktaboken 2011: Estimated emission factors for fuels, electricity, heat, and transport in Sweden]. Värmeforsk Service AB.
- Goedkoop, M., Heijungs, R., Huijbregts, M., De Schryver, A., Struijs, J., & van Zelm, R. (2013). ReCiPe 2008 – A life cycle impact assessment method which comprises harmonised category indicators at the midpoint and the endpoint level. First edition (version 1.08). Report I: Characterisation. Ministry of Housing, Spatial Planning and Environment.
- Gulotta, T. M., Mistretta, M., & Praticò, F. G. (2018). Life cycle assessment of roads: material and process related energy savings. Modelling, Measurement and Control C, 79(3), 146–153. https://doi.org/10.18280/mmc_c.790313
- Guo, C., Xu, J., Yang, L., Guo, X., Liao, J., Zheng, X., Zhang, Z., Chen, X., Yang, K., & Wang, M. (2019). Life cycle evaluation of greenhouse gas emissions of a highway tunnel: A case study in China. Journal of Cleaner Production, 211, 972–980. https://doi.org/10.1016/j.jclepro.2018.11.249
- Hammervold, J. (2014). Towards greener road infrastructure: life cycle assessment of case studies and recommendations for impact reductions and planning of road infrastructure [Doctoral disertation, Norweigian University of Science and Technology, Norway]. Retrieved from https://brage.bibsys.no/xmlui/handle/11250/274029.
- Hammond, G., & Jones, C. (2011). ICE Inventory of Carbon and Energy version 2.0. [Dataset]. Retrieved from http://www.circularecology.com.
- Hansson, J., & Grahn, H. (2013). Utsikt för förnybara drivmedel i Sverige. Uppdatering och utvidgning av studien Möjligheter för förnybara drivmedel i Sverige till år 2030 av Grahn och Hansson, 2010. [Outlook for renewable fuels in Sweden. Update and expansion of the study Possibilites for renewable fuels in Sweden by 2030 by Grahn and Hansson, 2010]. (IVL Report B2083). IVL Swedish Research Institute.
- Highways England. (2016). Carbon emissions calculation tool: Highways England. Retrieved from https://www.gov.uk/government/publications/carbon-tool.
- Hill, N., Brannigan, C., Wynn, D., Milnes, R., van Essen, H., den Boer, E., van Grinsven, A., Lighthart, T. & van Gijlswijk, R. (2012). EU Transport GHG: Routes to 2050 II. Final report Appendix 2: The role of GHG emissions from infrastructure construction, vehicle manufacturing, and ELVs in overall transport sector emissions. (Task 2 paper produced as part of a contract between European Commission Directorate-General Climate Action and AEA Technology plc; (see website www.eutransportghg2050.eu).
- Huang, L., Bohne, R. A., Bruland, A., Drevland Jakobsen, P., & Lohne, J. (2015). Life cycle assessment of Norweigian Road Tunnel. The International Journal of Life Cycle Assessment, 20(2), 174–184. https://doi.org/10.1007/s11367-014-0823-1
- Huang, L., Krigsvoll, G., Johansen, F., Liu, Y., & Zhang, X. (2018). Carbon emission of global construction sector. Renewable and Sustainable Energy Reviews, 81, 1906–1916. https://doi.org/10.1016/j.rser.2017.06.001
- Huang, Y., Hakim, B., & Zammataro, S. (2013). Measuring the carbon footprint of road construction using CHANGER. International Journal of Pavement Engineering, 14(6), 590–600. https://doi.org/10.1080/10298436.2012.693180
- Igos, E., Benetto, E., Meyer, R., Baustert, R., & Othoniel, B. (2019). How to treat uncertainies in life cycle assessment studies? The International Journal of Life Cycle Assessment, 24(4), 794–807. https://doi.org/10.1007/s11367-018-1477-1
- International Energy Agency. (2018). CO2 Emissions from Fuel Combustion 2018 Highlights [Excel file]. Retreived from https://webstore.iea.org/statistics-data.
- International Organization for Standardization. (2006). Environmental management – Life cycle assessment – Principles and framework. (ISO standard 14040: 2006). International Organization for Standardization.
- Jullien, A., Dauvergne, M., & Proust, C. (2015). Road LCA: the dedicated ECORCE tool and database. The International Journal of Life Cycle Assessment, 20(5), 655–670. https://doi.org/10.1007/s11367-015-0858-y
- Jungbluth, N. & Frischknecht, R. (2010). Cumulative energy demand. In: R. Hischier & B. Weidema (Eds.), Implementation of life cycle impact assessment methods. Data v2.2 (2010). ecoinvent report No. 3, v2.2. Swiss Centre for Life Cycle Inventories.
- Karlsson, C., Miliutenko, S., Björklund, A., Mörtberg, U., Olofsson, B., & Toller, S. (2017). Life cycle assessment in road infrastructure planning using spatial geological data. The International Journal of Life Cycle Assessment, 22(8), 1302–1317. https://doi.org/10.1007/s11367-016-1241-3
- Karlsson, R., & Carlson, A. (2010). Beräkningar av energiåtgång och koldioxidutsläpp vid byggande, drift och underhåll av vägar. Beräkningar enligt fyra typfall [Calculations of energy use and carbon dioxide emission in construction, operation, and maintenance of roads. Calculations according to four typical cases]. (VTI Notat 3-2010). Swedish National Road and Transport Research Institute.
- Kluts, I., & Miliutenko, S. (2012). Overview of road infrastructure planning process and the use of Environmental Assessments in the Netherlands and Sweden. KTH Royal Institute of Technology, Deparment of Urban Planning and Environment, Division of Environmental Strategies Research.
- Larsson Ivanov, O., Honfi, D., Santandrea, F., & Stripple, H. (2019). Consideration of uncertainties in LCA for infrastructure using probabilistic methods. Structure and Infrastructure Engineering, 15(6), 711–724. https://doi.org/10.1080/15732479.2019.1572200
- Liljenström, C. (2013). Life cycle assessment in early planning of road infrastructure - Application of The LICCER-model [Master’s thesis]. KTH Royal Institute of Technology. Retrieved from http://www.diva-portal.org/smash/search.jsf?dswid=5059.
- Liljenström, C., Miliutenko, S., Brattebø, H., O’Born, R., Birgisdóttir, H., Lundberg, K., Toller, S. & Potting, J. (2013). LICCER Model Case Study Report: Application of the LICCER-model to a Swedish road section between Yxtatorpet and Malmköping. (Report Nr 5.1 November 2013). Retrieved from https://www.cedr.eu/strategic-plan-tasks/research/era-net-road/call-2011-energy/liccer-project-results/.
- Liu, Y., Wang, Y., Li, D., & Yu, Q. (2019). Life cycle assessment for carbon dioxide emissions from freeway construction in mountainous area: Primary source, cut-off determination of system boundary. Resources, Conservation and Recycling, 140, 36–44. https://doi.org/10.1016/j.resconrec.2018.09.009
- Lundberg, K., Miliutenko, S., Birgisdóttir, H., Toller, S., Brattebø, H., Potting, J. (2013). LICCER Model Guidelines Report. (Report Nr 4.1). Retrieved from https://www.cedr.eu/strategic-plan-tasks/research/era-net-road/call-2011-energy/liccer-project-results/.
- Meex, E., Hollberg, A., Knapen, E., Hildebrand, L., & Verbeeck, G. (2018). Requirements for applying LCA-based environmental impact assessment tools in the early stages of building design. Building and Environment, 133, 228–236. https://doi.org/10.1016/j.buildenv.2018.02.016
- Miliutenko, S., Åkerman, J., & Björklund, A. (2012). Energy use and greenhouse gas emissions during the life cycle stages of a road tunnel – the Swedish case Norra Länken. European Jounral of Transport and Infrastructure Research, 12, 39–62. Retrieved from https://www.tudelft.nl/tbm/over-de-faculteit/afdelingen/engineering-systems-and-services/research/ejtir/.
- Miliutenko, S., Kluts, I., Lundberg, K., Toller, S., Brattebø, H., Birgisdóttir, H., & Potting, J. (2014). Consideration of life cycle energy use and greenhouse gas emissions in road infrastructure planning processes: Examples of Sweden, Norway, Denmark and the Netherlands. Journal of Environmental Assessment Policy and Management, 16(04), 1450038. https://doi.org/10.1142/S1464333214500380
- O’Born, R. (2018). Life cycle assessment of large scale timber bridges: A case study from the world’s longest timber bridge design in Norway. Transportation Research Part D: Transport and Environment, 59, 301–312. https://doi.org/10.1016/j.trd.2018.01.018
- O’Born, R., Brattebø, H., Kålas Iversen, O. M., Miliutenko, S., & Potting, J. (2016). Quantifying energy demand and greenhouse gas emissions of road infrastructure projects: An LCA case study of the Oslo fjord crossing in Norway. European Journal of Transport and Infrastructure Research, 16, 445–466. Retrieved from https://www.tudelft.nl/tbm/over-de-faculteit/afdelingen/engineering-systems-and-services/research/ejtir/.
- Oduro, S. K., & Lautala, P. (2017). Incorporating life cycle assessment (LCA) in freight transportation infrastructure project evaluation [Paper presentation]. 2017 Joint Rail Conference, April). In Proceedings of the JRC2017, April 4-7, 2017, Philadelphia, PA, USA. https://doi.org/10.1115/JRC2017-2303
- Olofsson, T. (2010). Delrapport: Bro. [Progress report: Bridge]. Retrieved from http://www.bygginnovationen.se/.
- Potting, J., Birgisdóttir, H., Brattebø, H., Kluts, I., Liljenström, C., Lundberg, K., Miliutenko, S., O'Born, R., Iversen, O.M., Toller, S. & van Oirschot, R. (2013). LICCER Final Report. (Report Nr 6 December 2013). Retrieved from https://www.cedr.eu/strategic-plan-tasks/research/era-net-road/call-2011-energy/liccer-project-results/.
- Potting, J., Birgisdóttir, H., Brattebø, H., Liljenström, C., Lundberg, K., Miliutenko, S., O'Born, R. & Toller, S. (2013). Report from second workshop. (Report Nr 3 October 2013). Retrieved from https://www.cedr.eu/strategic-plan-tasks/research/era-net-road/call-2011-energy/liccer-project-results/.
- Rydberg, T., & Andersson, R. (2003). Miljöeffektbedömning (LCA) för markstabilisering [Life cycle assessment (LCA) of ground stabilisation]. (Report). Swedish Deep Stabilisation Research Centre.
- Salkangas, L. (2009). ETSI Project (Stage 2) – Bridge Life Cycle Optimisation. Helsinki University of Technology.
- Sandvik, K. O., Hammervold, J. (2011). Incorporating greenhouse gas emissions in Benefit-Cost Analysis in the transport sector in Norway. Paper presented at the 24th World Road Congress, Mexico.
- Santos, J. M., Thyagarajan, S., Keijzer, E., Fernandez Flores, R., & Flintsch, G. (2017). Pavement life cycle assessment – a comparison of American and European tools. In I. L. Al-Quadi, H. Ozer, & J. Harvey (Eds.), Pavement Life-Cycle Assessment. Proceedings of the Symposium on Life-Cycle Assessment of Pavements (Pavement LCA 2017) April 12-13, 2017, Champaign, Illinois, USA (pp. 281–287). Taylor & Francis Group. doi https://doi.org/10.1201/9781315159324
- Shamoon, H. (2012). Energieffektiv vägdesign [Energy efficient road design]. [Master’s thesis]. KTH Royal Institute of Technology, Sweden. Retrieved from http://www.diva-portal.org/smash/search.jsf?dswid=5059.
- Sierra, L. A., Yepes, V., & Pellicer, E. (2018). A review of multi-criteria assessment of the social sustainability of infrastructures. Journal of Cleaner Production, 187, 496–513. https://doi.org/10.1016/j.jclepro.2018.03.022
- Simonsen, M. (2010). Transport, energi og miljø [Transport, energy, and environment]. (Report nr 2/2010). Western Norway Research Institute.
- Spriensma, R., van Gurp, C., Anker Larsen, M. R. (2014). CEREAL Final report. (Deliverable Nr 6 & 7 January 2014). Retrieved from https://www.cedr.eu/wpfb-file/04_final-report-cereal-2014-pdf/.
- Straume, A., & Bertelsen, D. (2015). Brukerveiledning GS-EFFEKT 6.6. [User manual GS-EFFEKT 6.6] (Statens vegvesens rapporter Nr. 357). Norweigian Public Roads Administration.
- Streimikiene, D., Baležentis, T., & Baležentienė, L. (2013). Comparative assessment of road transport technologies. Renewable and Sustainable Energy Reviews, 20, 611–618. https://doi.org/10.1016/j.rser.2012.12.021
- Stripple, H. (2001). Life cycle assessment of road. A pilot study for inventory analysis. (IVL Report B 1210 E). IVL Swedish Environmental Research Institute.
- Stripple, H. (2009). Kompletterande underlag för tillåtlighetsprövning – en översiktlig miljöstudie av väginfrastrukturen i projekt Förbifart Stockholm [Complementing basis for consideration of permissibility – a general environmental study of the road infrastructure in the project Bypass Stockholm. ] (U2380). IVL Swedish Environmental Research Institute.
- Swedish Transport Administration. (2013). Klimatkalkyl (version 1.0) [Excel-file].
- Toller, S. (2018). Klimatkalkyl – Calculating energy use and greenhouse gas emissions of transport infrastructure from a life cycle perspective (TRV 2018:115). The Swedish Transport Administration.
- Toller, S., & Larsson, M. (2017). Implementation of life cycle thinking in planning and procurement at the Swedish Transport Administration. In I. L. Al-Quadi, H. Ozer, & J. Harvey (Eds.), Pavement Life-Cycle Assessment. Proceedings of the Symposium on Life-Cycle Assessment of Pavements (Pavement LCA 2017) April 12-13, 2017, Champaign, Illinois, USA., (pp. 281–287). Taylor & Francis Group. doi https://doi.org/10.1201/9781315159324
- Trunzo, G., Moretti, L., & D’Andrea, A. (2019). Life cycle analysis of road construction and use. Sustainability, 11(2), 377. https://doi.org/10.3390/su11020377
- Wayman, M., Sciavi Mellor, I., Cordell, B., James, D., Gossling, R., Loveday, C., Simms, M. & Southwell, C. (2012). The asphalt pavement embodied carbon tool (asPECT): Developing a carbon footprinting methodology for asphalt products. Paper presented at the 5th Eurasphalt & Eurobitume Congress, 13-15th June 2012, Istanbul.
- Wernet, G., Bauer, C., Steubing, B., Reinhard, J., Moreno-Ruiz, E., & Weidema, B. (2016). The ecoinvent database version 3 (part I): overview and methodology. The International Journal of Life Cycle Assessment, 21(9), 1218–1230. https://doi.org/10.1007/s11367-016-1087-8
- Zapata, P., & Gambatese, J. A. (2005). Energy consumption of asphalt and reinforced concrete pavement materials and construction. Journal of Infrastructure Systems, 11(1), 9–20. https://doi.org/10.1061/(ASCE)1076-0342(2005)11:1(9)
- Zavadskas, E. K., Antucheviciene, J., Vilutiene, T., & Adeli, H. (2017). Sustainable decision-making in civil engineering, construction and building technology. Sustainability, 10(2), 14. https://doi.org/10.3390/su10010014
- Zhao, K., Ng, T. S., Kua, H. W., & Tang, M. (2017). Modeling environmental impacts and risk under data uncertainties. IISE Transactions, 49(12), 1150–1159. https://doi.org/10.1080/24725854.2017.1342054