
Abstract
Despite their similarities, Scandinavian countries have adopted starkly different automobile tax regimes. The Danish system entails very high and convex tax rates with moderate CO2 differentiation. In Norway, tax rates are high and convex with strong CO2 differentiation and total exemptions for zero emission vehicles, even from value added tax. Sweden practices feebates – CO2 dependent subsidization along with moderate taxation.
Relying on a disaggregate discrete choice model of automobile purchase, we simulate the demand for passenger cars as of 2016 in Norway under a set of conditions resembling, respectively, the Danish, Norwegian or Swedish fiscal incentives before and after recent reforms. In all cases, implications are derived in terms of energy technology market shares, average type approval CO2 emission rates, and aggregate fiscal revenue.
The automobile taxation system is seen to have remarkable impacts on all three accounts. In essence, among the three jurisdictions examined, the Norwegian fiscal regime has by far the strongest CO2 abatement effect. The Danish system is less effective in terms of CO2 abatement, but provides twice as much government revenue. The Swedish feebate strategy is by far the least effective in terms of both CO2 mitigation and revenue collection.
Automobile taxation is a powerful greenhouse gas abatement instrument.
Tax exemptions for battery electric cars accelerate their market uptake.
The disparate experiences of the three Scandinavian countries are quite instructive.
Highlights
1. Introduction
European countries apply a variety of automobile taxation systems (Dineen et al., Citation2018; Hauff et al., Citation2018; Wappelhorst et al., Citation2018). Although most countries in EU and EFTA do levy some kind of registration or circulation tax, their structures and levels differ considerably. Some countries grant subsidies and bonuses to buyers of zero and low emission cars while others apply CO2-graduated purchase or ownership taxes.
Although quite similar in terms of culture, language, population, economic development and social organization, the three Scandinavian countries have been pursuing widely different climate policy strategies for the transport sector in general, and for motor vehicle taxation in particular. Put briefly, the Danish automobile taxation system entails very high registration tax rates with moderate CO2 differentiation. In Norway, tax rates are not quite as high, but strongly CO2-differentiated, with battery electric vehicles (BEVs)Footnote1 totally exempt, even from value added tax (VAT). In Sweden, the strategy is CO2 dependent subsidization along with comparatively moderate taxation.
Which one of these tax systems gives rise to the lowest average fuel consumption and CO2 emissions from new passenger cars? How are the market shares of petrol, diesel, hybrid and electric vehicles affected? How do the systems differ in terms of net fiscal revenue? To what extent are the differences in energy technology market shares and in mean CO2 emission rates between the countries explicable in terms of fiscal incentives? These are the main research questions addressed in this paper.
Our approach is to perform counterfactual simulations on a disaggregate discrete choice model of automobile purchase estimated on a Norwegian data set. We predict the demand for automobiles in terms of energy technology market shares, average CO2 emission rates and aggregate fiscal revenue under a set of conditions resembling, respectively, the Danish, Norwegian or Swedish fiscal regimes before and after recent reforms.
The literature on automobile choice is comprehensive. Among the early applications of discrete choice modeling to automobile demand we find Lave and Train (Citation1979), Manski and Sherman (Citation1980), Berkovec (Citation1985), Berkovec and Rust (Citation1985), and Berry (1994). A particularly influential paper is the one by Berry et al. (Citation1995) who study the US automobile market relying on an aggregate panel data set that follows car models over all years they have been marketed during 1971–1992. Unlike most previous studies, they treat automobile prices as endogenous on account of unobserved product attributes.
Several, more recent papers have focused explicitly on automobile taxation and its greenhouse gas (GHG) abatement potential. D'Haultfoeuille et al. (Citation2014) study the French feebate (bonus-malus) system for automobiles and find it counterproductive in terms of CO2 abatement. Klier and Linn (Citation2015), studying vehicle taxation in France, Germany and Sweden, while focusing on the supply side, find little evidence that manufacturers adapt their vehicles to CO2-graduated taxes. But Gerlagh et al. (Citation2015) find that “fiscal vehicle policies significantly affect emission intensities”. Stitzing (Citation2016) finds that the Finnish CO2-differentiated automobile sales tax introduced in 2008 did not make much difference in terms of GHG emissions; however, it led to increased NOX pollution, as buyers switched from petrol to diesel cars. Alberini and Bareit (Citation2019) find that the CO2-graduated registration taxes in Swiss cantons have lowered emissions, but not by much. Springel (Citation2021) arrives at the surprising conclusion that, in Norway, “between 2010 and 2015, [charging] station subsidies were more than twice as effective as price subsidies”. Østli et al. (Citation2017), on the other hand, find that registration taxes affect automobile choice and CO2 emission rates in Norway quite strongly. Cerruti et al. (Citation2019), studying the British car market between 2005 and 2010, find that in terms of reduced CO2 emissions per unit of revenue, a carbon tax imposed on drivers would be more than twice as effective as a CO2-proportional vehicle registration tax. On the other hand, Brand et al. (Citation2013), also studying the UK, state that “car purchase feebate policies are shown to be the most effective in accelerating low carbon technology uptake, reducing life cycle gas emissions”. Fridstrøm (Citation2017) shows how climate or energy policy options directed toward new vehicle acquisition do affect the vehicle stock and its environmental characteristics, with a time lag depending on the turnover and the speed of innovation. Fridstrøm (Citation2021) suggests that the unparallelled market uptake of battery electric cars in Norway is explicable in terms of a uniquely high effective price of carbon, implicit in the automobile tax regime.
Previous studies have, in summary, yielded quite disparate results, perhaps because in many cases the tax differentials studied have been too marginal to give rise to manifestly dissimilar environmental outcomes. The idea of this paper is to use detailed information on the Scandinavian automobile taxation systems to juxtapose three radically different policy options and determine their respective merits.
2. Scandinavian automobile demand, taxation and CO2 emissions
2.1. Overview
In , key statistical indicators of the three Scandinavian countries have been assembled. Sweden is approximately twice as populous as Denmark and Norway. The population density of Denmark is, however, 9.4 times higher than in Norway, and 5.5 times higher than in Sweden.
In this paper, national currencies have been converted into Euros (EUR/€) or Norwegian kroner (NOK) according to the exchange rates in effect on 2 July 2018, set out at the bottom of .
A summary assessment of the Scandinavian automobile taxation systems is provided in .
Only Denmark has a value based one-off registration tax (purchase tax). The Norwegian, three-component registration tax is based on curb weight, CO2 and NOX emissions. The moderate Swedish malus is also CO2- and NOX-differentiated.
Denmark has by far the highest tax rates, and Sweden the lowest, by virtue of its feebate. The bonus on Swedish BEVs is approximately EUR 6 000.
Norwegian tax rates are high by European standards, but only for internal combustion engine (ICE) vehicles. BEVs and fuel cell electric vehicles (FCEVs) are generally exempt from tax and toll, including VAT. Plug-in hybrid electric vehicles (PHEVs) enjoy reduced purchase tax rates through a ‘discount’ on the weight component.
From Sections 2.2 to 2.4, we describe, country by country, the main characteristics of the three tax regimes, as well as the ensuing market shares of the various powertrains. For a more detailed account of the tax rules, please see Appendix A.
2.2. Denmark
2.2.1. Automobile taxation
Automobile taxation in Denmark rests on a long tradition, the registration tax having been introduced already in 1925, for the (then stated) purpose of reducing the import of vehicles and strengthening the balance of trade and the Danish currency.
The main automobile tax in Denmark is value based and convex (upward bending), making large and luxurious cars particularly expensive. It is not uncommon for taxes to account for two thirds of the retail value of a vehicle.
In recent years, the registration tax has become more or less differentiated according to the vehicles’ climate and environmental characteristics. Until 2015, BEVs were fully exempt from registration tax; in 2016 they became subject to 20 percent of the tax applicable to ICE vehicles. For 2019 and 2020, the Danish Parliament has again instituted a de facto exemption for zero emission cars not costing more than DKK 400 000 = EUR 54 000.
As of 2019, there are four principal types of tax levied on Danish registered passenger cars and their use:
one-off registration tax calculated on the retail sales value, with adjustments determined by the energy technology and by the energy efficiency as established by the type approval test
fuel efficiency tax, often referred to as the ‘green ownership tax’, payable twice annually, determined by the vehicle’s powertrain and its type approval fuel mileage
vehicle insurance tax, based on the liability insurance premium
fuel and electricity taxes
In addition, all cars are subject to
a standard 25 percent VAT on the retail price
ferry fares
toll charges on the two bridges across Storebaelt and Øresund
income tax on the fringe benefit of using a company owned car, generally assessed at 25 percent of the car’s retail price each year.
2.2.2. Automobile demand
As of 1 January 2018, 68.6 percent of all passenger cars carrying Danish license plates were petrol driven ICE vehicles. Almost all the remaining passenger cars, more precisely 30.9 percent, were diesel driven.
Among the new cars registered in 2019, 63 percent were petrol cars, 27 percent were diesel cars, 5.9 percent were non-plug-in hybrid vehicles (HEVs), 1.7 percent were PHEVs and 2.4 percent were BEVs ().
The split between energy technologies has changed relatively little between 2011 and 2019. In 2015, when BEVs were still exempt from registration tax, they reached a market share of 2.1 percent. But in 2016, when BEVs became subject to a registration tax set at 20 percent of the tax applicable to petrol cars, the BEV market share dropped to 0.6 percent. In 2019, it had climbed back up to 2 percent.
The Danish automobile taxation is quite stiff, on top in Europe in terms of revenue collection, and quite convex. The value based, convex taxes make people choose relatively small petrol and diesel cars, with a relative low average CO2 emission rate for ICE vehicles. There are tax breaks for BEVs, but not comprehensive enough to tempt a large share of automobile buyers.
2.3. Norway
2.3.1. Automobile taxation
In Norway, as in Denmark, stiff fuel and vehicle taxation has a long history. The one-off registration tax was first introduced in 1955, as a ‘temporary measure to curb the demand for foreign currency’.
As of 2018, there are a dozen different taxes, subsidies and regulations with a bearing on the split between automobile technologies and on their respective climate footprints:
VAT, with exemptions for zero exhaust emission vehicles (ZEVs), i.e. BEVs and FCEVs
One-off registration tax, calculated as the sum of up to four variable components, based on curb weight, combustion engine power, CO2 and NOx emissions
Annual ownership (circulation) tax, since 2018 collected through the insurance companies
Fuel tax, calculated as the sum of a CO2 component and a road use component
Road toll, in some cases differentiated by the hour or by the vehicle’s energy technology
Reregistration tax on used vehicle transactions
Ferry fares, differentiated between ZEVs and ICE vehicles
Parking fees, likewise differentiated
Income tax on private use of company cars, likewise differentiated
Government support for fast charging and hydrogen refueling facilities
Free parking and recharging for BEVs in public parking lots
Bus lanes open to ZEVs, with a few exceptions
In Norway, the registration tax is CO2-differentiated and convex like in Denmark, but not nearly so stiff. Other than the VAT, no taxes are value based. BEVs are exempt (as of 2018), not only of all (re)registration and ownership taxes, but also VAT, road toll, ferry fares, and parking fees. BEVs can generally travel in the bus lane. Like in Denmark, no cash subsidies are paid out to automobile buyers.
In a recent analysis by Fridstrøm (Citation2021), the carbon price implicit in the most important fiscal incentives for passenger cars, coinciding with the first seven bullet points above, was calculated at EUR 1370 per tonne of CO2 as of 2019.
2.3.2. Automobile demand
In Norway, battery and hybrid electric vehicles have seen an almost uninterrupted growth in their market shares since 2010 ().
In 2019, 15.7 percent of the new automobiles registered were petrol ICE vehicles, while 16.0 percent were diesel cars. 12.3 percent were non-plug-in hybrids (HEVs), 13.6 percent were PHEVs, 42.4 percent were BEVs, and 0.02 percent were FCEVs.
2.4. Sweden
2.4.1. Automobile taxation
Sweden’s approach to the climate and environmental challenges of road transport has been rather different as compared with the other two Scandinavian countries. Whereas Denmark and Norway have relied on high one-off registration taxes, with or without reliefs for zero and low emission vehicles, the Swedish emphasis has been on increased use of biofuel and on cash subsidies for zero and low emission cars.
Since 1996, no one-off purchase or registration tax has been in effect in Sweden. An annual circulation (ownership) tax, differentiated by curb weight and CO2 emissions, has however been in effect for some time. Between 1 January 2016 and 1 July 2018, a special environmental grant (‘supermiljöbilspremie’) was in effect, allowing buyers of zero and low emission automobiles a maximum of SEK 40 000 (EUR 3 870) in one-off purchase subsidy.
Passenger cars running on E85, an 85 percent ethanol blend, have, until recently, enjoyed advantages in terms of reduced fuel tax as well as lower vehicle ownership tax.
In Sweden, a bonus-malus (feebate) system has been in effect since July 2018. Zero and low emission cars are subsidized, while cars emitting more than 95 gCO2/km by the NEDC test are subject to a moderate ‘malus’, in the form of increased annual ownership tax during the first three years. The Swedish tax schedules are not strongly convex, like in Denmark and Norway.
2.4.2. Automobile demand
In Sweden, 45 percent of the new automobiles registered in 2019 were petrol ICE vehicles, while 32 percent were diesel cars. 7.1 percent were PHEVs, 4.5 percent non-plug-in HEVs, 4.5 percent BEVs, 0.3 percent ethanol driven, and 1.3 percent CNG driven. The last 13 years have seen ethanol/flexi-fuel vehicles come and go. As of 2018-2019, battery and hybrid electric vehicles seem to be exhibiting moderately rising sales curves ().
2.5. Comparing CO2 emission rates
The market shares of petrol and diesel driven vehicles, HEVs, PHEVs and BEVs vary widely between the Scandinavian countries, as do the average type approval rates of CO2 emission from new passenger cars. The development of type approval CO2 emission rates, as measured by the NEDC laboratory testing cycle, is shown in . The rates have come down in all countries, most steeply in Norway.
It is, however, well known that the NEDC test procedure underestimates fuel consumption and CO2 emissions as compared with real-world, on-the-road conditionsFootnote2, and that this gap has been widening, reaching 38-40 percent in 2015-2017, versus only 8-9 percent in 2001 (Tietge et al., Citation2019). The NEDC laboratory test is particularly inaccurate for PHEVs (Plötz et al., Citation2018, Citation2020; CitationFigenbaum & Weber, 2018). Thus the growing share of PHEVs since 2014 may have served to artificially lower the last part of the curve, slightly more so for Norway than for Denmark and Sweden.
3. Simulating fiscal reform
To assess how automobile demand responds to fiscal incentives, we perform semi-factual and counterfactual simulations on the disaggregate discrete choice model of new passenger car purchases estimated on a Norwegian dataset. A brief description of the model is offered in Appendix B. For a full documentation, we refer the reader to Fridstrøm and Østli (Citation2021). Simulations are made on a subset of data covering all new automobile registrations in Norway between 1 January and early October 2016.
The fiscal incentives modified in our counterfactual simulations are the first seven shown in – VAT, registration tax (value based or CO2 based), bonus/malus, ownership tax, and fuel or electricity tax (embedded in the energy price).
Regarding the last four cash flows listed in – insurance tax, ferry fares, toll and congestion charges – our model contains no information. These are, in other words, assumed constant.
3.1. Semi-factual and counterfactual scenarios
The following six scenarios for new passenger car sales in Norway have been computed.
N1. Norwegian tax rules and energy prices as of 2016
N2. Norwegian tax rules and energy prices as of 2nd half of 2018
DK1. Danish tax rules and energy prices as of 2018
DK2. Danish tax rules and energy prices as of 2018, but with BEVs exempt from registration tax
S1. Swedish tax rules and energy prices as of 2nd half of 2018 (bonus-malus)
S2. Swedish tax rules and energy prices as of 1st half of 2018 (no bonus-malus, but environmental subsidy)
The purchase taxes and subsidies affect the market shares of the respective car model variants through the discrete choice model’s ‘Price’ and ‘Resourcecostshare’ variables, the former including all purchase taxes – VAT, bonus/malus and registration tax – and the latter being given by the price net of tax divided by the price including tax (see Appendix B). A tax increase will raise the Price, but reduce the Resourcecostshare.
The prices of fuel and electricity affect the market shares through the model’s ‘Energycost’ variable, calculated as the present value of lifelong energy expenditure consistent with the vehicle’s type approval energy consumption rate. The present value is calculated on the assumption that the 2016 real prices of energy, including fuel tax, electricity tax and VAT, are prolonged indefinitely. A 4 percent annual discount rate is used.
We use N1 as our reference (benchmark) scenario, to which all alternative scenarios are compared. All scenarios assume the same automobile demand parameter estimates as N1, but different tax rules and energy prices.
The N2 scenario differs from N1 in that the engine power component of the one-off registration tax has been abolished, while the CO2 component tax schedule has become steeper and the weight component more convex. Also, the tax ‘rebate’ applicable to hybrid electric vehicles has become restricted to PHEVs and made contingent upon the vehicle’s all-electric driving range ( and in Appendix A).
The DK1 scenario applies Danish tax rules as of 2018, with some simplifications (see sections 3.2 and A.1). The DK2 scenario differs from DK1 in that BEVs are assumed to be exempt from registration tax, consistent with the tax regime prior to 2016.
The S1 scenario essentially represents the bonus-malus system introduced in Sweden on 1 July 2018 (section A.3). The S2 scenario differs from S1 in that there is no malus, only an environmental subsidy smaller than the bonus introduced in 2018. Certain annual ownership taxes apply in both scenarios.
In addition to these six simulated scenarios, we shall exhibit, for comparison, the factual situation as of 2016 in Norway and as of 2018 in Denmark and Sweden, already depicted in . These ‘scenarios’ are labeled N0, DK0 and S0, respectively.
3.2. Assumptions
When Danish or Swedish tax rules are applied to a disaggregate Norwegian data set, certain dilemmas and complications arise.
Trivially, certain variables are missing in our data set. This applies, e.g., to the number of EuroNCAP stars awarded or the number of air bags and seat belt alarms installed in each model variant – factors affecting the Danish registration tax. In our model simulations, for simplicity, we have assumed that all cars in 2016 are eligible for maximal deductions for crashworthiness and inner safety.
The Danish and Swedish traffic insurance taxes depend on the insurance premiums, of which we have no information. In our calculations, we have simply disregarded this tax component. Hence the tax burden calculated under Danish rules is probably being underestimated by some 4-5 percent.
Also, since we do not, in our model, possess any information on the automobile buyers, we cannot take account of the differences in tax rules between private and corporate buyers. Instead, we uniformly apply the tax rules applicable to private households.
Being based on a Norwegian data set, these model simulations cannot, in general, be expected to predict the market outcome in Denmark or Sweden with any degree of accuracy. The countries may differ in terms of consumer preferences for vehicle technology, fuel and vehicle price elasticities, or other unobserved factors such as the number of public and private electric chargers available. Also, certain BEV incentives present in Norway – access to bus lanes, reduced toll, parking fees and ferry fares – do not exist in Denmark or Sweden. All these differences are reflected in the parameter estimates of the nested logit model, in particular in the BEV dummy coefficient, and would result in different coefficients if estimated on a Swedish or Danish data set. However, one hypothesis could be that the customer demand and CO2 mitigation effects of certain automobile taxes will not be radically dissimilar between the three countries. In such a case the outcome as predicted on Norwegian microdata, but with Danish or Swedish tax rules, could potentially provide useful information for fiscal policy formulation even in the neighboring countries.
3.3. Results
3.3.1. Market shares
Predicted market shares for nine different energy technologies as of 2016 in Norway, as calculated under nine sets of (semi-)factual or counterfactual circumstances, are shown in .
Being based on the factual tax rules and energy prices in effect in Norway as of 2016, the N1 scenario predicts a BEV market share of 15.7 percent. The observed BEV market share in the same year was 17.2 percent (the N0 ‘scenario’). For petrol cars, on the other hand, the model prediction is a bit too high. For the other powertrain technologies, the model’s predicted market shares are less than 0.3 percentage points off the mark. We find the model’s explanatory power at this aggregate level acceptable.
In the N2 scenario, where 2018 tax rules and fuel prices have replaced those of 2016 (N1), the market shares are only marginally different form the N1 benchmark. Note, however, that the N2 scenario cannot be interpreted as an unconditional forecast for 2018, since it is based on the set of vehicles available in the market in 2016. As of 2018, the supply of BEVs had become remarkably larger, more varied and less expensive, generating a BEV market share of 31.2 percent (cf. ).
If implemented in Norway in 2016, the Swedish bonus-malus system (S1) would have generated a 56 percent market share for petrol cars, 27 percent diesel cars, 9 percent HEVs, 6 percent PHEVs and 2 percent BEVs. The predicted market shares under the benchmark (N1) scenario were 29, 31, 11, 13 and 16 percent, respectively.
Under the S2 scenario, where there is no malus, but certain bonuses for BEVs and PHEVs, the differences with respect to the benchmark N1 scenario are even greater. Only 1.1 percent of all passenger cars sold would be BEVs.
The predicted market shares for Norway 2016 under Swedish tax rules as of 2018 (S1) come out fairly close to the factual market shares in Sweden 2018 (‘scenario’ S0). The predicted PHEV and BEV market shares are almost exactly ‘on the dot’. Moreover, the predicted market shares under the previous (S2) fiscal scenario come remarkably close to the observed Swedish market shares in 2017, with 1.1 percent BEVs and 4 percent PHEVs in both cases (cf. ).
In the case of Denmark, our model is much farther from reproducing factual market shares. Surprisingly, the 2018 Danish automobile taxation system (DK1) would, if implemented in Norway in 2016, seemingly have generated a BEV market share of 8.1 percent, a 2.1 percent PHEV share and a 10.4 percent HEV share. This compares to the factual market shares for Denmark in 2018 (DK0) of only 0.7, 1.4 and 4.0 percent, respectively.
Under the previous Danish fiscal regime (DK2), where BEVs were fully exempt from registration tax, the BEV market share in Norway 2016 would, according to our model, have reached almost 10 percent.
3.3.2. CO2 emissions
The CO2 emission rates, as measured by the type approval test and averaged over all new passenger cars, including those with zero emissions, are shown in .
One notes that in terms of CO2 emission rates, our model generates fairly accurate predictions not only for Norway, but even – almost without trying – for Denmark and Sweden (compare N1 to N0, DK1 to DK0, and S1 to S0). The differences among the three countries, in terms of the CO2 emission rates of new cars, are well explained by the model.
The observed rate for Norway in 2016 (N0) was 93 gCO2/km (cf. ). The predicted rate is 91.7 gCO2/km under scenario N1 and 87.7 percent under scenario N2.
The Danish tax regime (DK1) would, if implemented in Norway as of 2016, have led to an estimated 18 percent higher type approval rate of CO2 emission rate from new cars than in our N1 benchmark. With BEVs exempt from registration tax, as in Denmark in 2015, the predicted average CO2 emission rate is 2 percent lower (compare DK2 to DK1).
The Swedish tax regime (S1) is compatible with a 33 percent higher mean emission rate than in our benchmark (N1) scenario. The present bonus-malus regime (S1) appears to reduce the average CO2 emission rate by an estimated 2.8 percent, compared to the previous subsidy scheme (S2).
3.3.3. Fiscal revenue
The third criterion of interest in the context of automobile taxation policy is, of course, the fiscal revenue. In , we exhibit results in terms of aggregate VAT, registration and ownership tax revenue under six scenarios. The aggregate number of passenger cars sold has been fixed at 154 603, equal to the actual sales figure for Norway in 2016.
The 2016 tax rules for Norway (N1), would according to the model, generate a registration tax revenue of NOK 11.8 billion, an ownership tax revenue of NOK 4.0 billion as reckoned in net present value, and a VAT revenue on new passenger cars of NOK 8.0 billion (). The total present value of fiscal revenue from new passenger cars comes out at NOK 23.8 billion (EUR 2.51 billion).
The somewhat different tax rules introduced in 2018 (N2) would generate only slightly smaller revenue – in total NOK 23.1 billion (EUR 2.43 billion).
The Danish fiscal regime (DK1) would, if applied to Norway in 2016, increase the revenue from registration and ownership tax by no less than 110 percent, from NOK 15.8 billion to NOK 33.1 billion (EUR 3.48 billion). An almost equally large increase (105 percent) would result even if BEVs were totally exempt from registration tax (DK2). Danish automobile registration and ownership taxes are thus, in a sense, more than twice as high as in Norway. This is so even though the Danish liability insurance tax, which would add another NOK 1.5-2 billion or so on top of the registration and ownership taxes, has not been taken into account.
The predicted VAT revenue does not, however, change much between the N1 and DK1 scenarios, despite the fact that the former scenario implies a 16 percent share of zero emission, VAT exempt cars. The zero VAT revenue from BEVs under N1 rules is counterbalanced by the fact that under Danish tax rules (DK1), buyers prefer generally smaller and cheaper cars, as reckoned before tax, thus generating less VAT revenue from conventional ICE vehicles.
This result is set out more explicitly in . The before tax average retail price of all passenger cars sold becomes 16 percent lower under Danish (DK1) tax rules than under Norwegian ones (N1) (NOK 207 045 [EUR 21 790] versus NOK 246 872 [EUR 25 990]). Note that, in our model, the mean retail prices before tax differ between the scenarios, not because prices change at the level of each car model variant, but because the tax regimes affect consumer choice, i.e. the market shares of the respective car model variants.
The Swedish tax regime, in contrast, would seem to result in considerable revenue loss for the public treasury if applied to Norway as of 2016. Our model predicts a net aggregate registration and ownership tax revenue of only NOK 1.936 billion (EUR 0.204 billion) in the S1 case and NOK 1.175 billion (EUR 0.124 billion) in the S2 case. Apparently, substituting the Swedish feebate system for the Norwegian vehicle tax regime would reduce the fiscal revenue from registration and ownership tax by no less than 88 percent.
Even if the change in VAT revenue is taken into account, the fiscal ‘loss’ from adopting Swedish tax rules instead of Norwegian ones is still 53 percent. The VAT revenue would, in the S1 case, increase by 14 percent compared to the N1 benchmark, since fewer people would buy VAT exempt BEVs.
The Swedish tax regime does not, like the Danish one, penalize large and expensive cars. Hence the average before tax retail price of cars in the S1 scenario comes out at NOK 237 409 (EUR 24 990) – only 3.8 percent less than in the N1 benchmark case ().
Note, however, that the Swedish traffic insurance tax, if implemented in Norway, would probably add some NOK 1.5-2 billion to the vehicle registration and ownership tax revenue calculated by us.
4. Discussion
Our counterfactual simulations are based on a nested logit model of automobile choice estimated on disaggregate data from one of the three countries examined.
As a general simplification, we assume that taxes and subsidies are passed through 100 percent to the vehicle buyers. Although all the three Scandinavian counties are relatively small markets and hence most likely price takers on the global scene, this assumption may not always be warranted. A particular challenge exists in the Norwegian passenger car market as of 2016-2018, where the demand for BEVs seemed to exceed supply by an estimated 30 000 vehicles, as judged by the waiting lists filed with automobile retailers. This may imply a high pass-through rate for BEVs but a lower one for ICE vehicles. Yan and Eskeland (Citation2018) estimate that 88 percent of an automobile tax increase is normally passed through to buyers, while Johansen (Citation2020) observes a 100 per cent pass-through rate. Muehlegger and Rapson (Citation2018) find an almost 100 per cent pass-through rate for the negative tax (subsidy) on electric cars in effect in California.
More generally, because we do not take into account that retail prices may be endogenous, as pointed out by Berry et al. (Citation1995), our results must be interpreted with some caution. However, since we measure standardized list prices (manufacturer's suggested retail price) rather than actual transaction prices, and since the model includes a large number of vehicle quality attributes, we believe the endogeneity bias to be moderate.
Our model predicts a higher average before-tax retail price under Norwegian tax rules than under the Swedish feebate system. Given the negative tax wedge implied by the bonuses paid out under the Swedish regime, one might have expected the opposite result. It appears, however, that the zero tax wedge in effect for BEVs registered in Norway more than outweighs the bonuses on low and zero emission cars registered in Sweden, where these cars are, after all, subject to VAT like any other vehicle.
Our most puzzling result is the relatively high (8 percent) BEV market share predicted under the DK1 scenario. The observed BEV market share in Denmark was less than one tenth of this. Why is BEV demand so much lower in Denmark than in Norway, despite considerable similarities in terms of stiff and CO2-differentiated automobile tax tables? Three possible explanations come to mind.
First, electricity prices are almost three times higher in Denmark than in Norway. Fridstrøm and Østli (Citation2021) estimate the elasticity of demand for BEVs with respect to the price of electricity at −0.18. Roughly speaking, this suggests that a doubled electricity price would reduce BEV demand by around 18 percent. But this effect is already taken into account in the DK1 scenario, through our Energycost variable. Hence it does not help explain the difference between the DK1 and DK0 scenarios – quite the contrary.
Second, BEV demand in Norway is boosted, not only through the national automobile ownership and registration taxes, but also by a wide range of local regulatory and fiscal incentives not present in Denmark or Sweden: BEV access to bus lanes, exemption from road toll and ferry fares, free public parking and recharging, and fast charging infrastructure along highways. In our model, the effects of these advantages are not explicitly estimated, but embedded in the dummies and other powertrain specific coefficients relating to BEVs, PHEVs, HEVs and ICE vehicles. When the Danish automobile tax system is superimposed on the Norwegian set of local incentives, certain synergies may seem to arise, and the model predicts a considerable market share for BEVs.
Third, the somewhat erratic fiscal policy pursued in Denmark over the last few years may have caused confusion among potential automobile buyers. When large tax breaks for electric cars are implemented, but then reversed from one fiscal year to the next, in order to be reintroduced later on, the already uncertain first- and secondhand values of BEVs become even more important factors of dissuasion. This might help explain why the discrepancy between modelling results and actual performance is much bigger in the case of Danish tax rules than when we simulate Swedish rules.
Obviously, the high, convex, value-based registration tax in effect in Denmark represents a strong incentive to choose inexpensive cars – more so than in Norway and Sweden. This explains the low average price of passenger cars predicted under Danish tax rules. In addition, the large tax wedge, if not entirely passed through to buyers, could mean that manufacturers tend to lower their asking price from dealers in Denmark compared to those of Norway and Sweden. This effect is, however, not incorporated in our calculations, which are based on vehicle list prices as observed in Norway.
Another caveat pertains to the possible rebound effect of generally cheaper cars. Ours being a market share model, it does not predict or encompass changes in overall car ownership or aggregate sales. D'Haultfoeuille et al. (Citation2014) find, however, the French bonus-malus system for automobiles to be counterproductive in terms of CO2 abatement, because the bonus has made car ownership affordable to a larger number of families and thus led to higher aggregate car ownership and use. In Norway, although not a single Euro’s worth of subsidies is being paid to people buying electric passenger cars, the tax exemptions for zero emission vehicles have enlarged the assortment of relatively inexpensive cars with low operating costs. It is conceivable that this might lead to increased household car ownership and use. More importantly, the bonuses paid out to Swedish car buyers obviously serve to make certain car models cheaper and more affordable, in much the same way as in France. The two bonus-malus systems have a lot in common, and similar effects should be expected.
The public finance effect of VAT exemption is probably somewhat overstated in our calculations, since an unknown share of automobile buyers are able to deduct the input VAT. In 2016, 48 percent of all new passenger cars in Norway were registered to a company. Not all of these companies are, however, eligible for input VAT deduction on cars. By a special provision in the Norwegian VAT law, only car dealers, taxi/limousine companies, and car rental and leasing companies are allowed to deduct input VAT on automobiles (see Section A.2.5).
In our automobile choice model, we lack information on the vehicle buyers and hence cannot distinguish between private and corporate clients. As a short-cut, we apply the tax rates applicable to private households throughout. In the Danish and Swedish cases, this leads to a certain inaccuracy.
A final problem not accounted for in our study is the possible export of subsidized vehicles. According to press reports and foreign trade statistics, a considerable amount of BEVs registered in Sweden are sold secondhand to buyers in Norway (SVT Nyheter Citation2018; Fridstrøm, Citation2019). This means that Swedish citizens do not get the full benefit of reduced automobile energy use and tailpipe emissions paid for by Swedish taxpayers, although in terms of climate footprint it does not matter where CO2 emissions occur or are cut. More importantly, the export of subsidized zero emission vehicles makes the Swedish climate policy instruments less cost effective, inhibiting the attainment of national GHG abatement targets. On 22 July 2020, the Swedish government therefore announced its intention to require at least five year’s continued ownership in order for a zero or low emissions vehicle buyer to be eligible for bonus. If the car is deregistered earlier than five years after its first matriculation, for any reason other than scrapping, any bonus received will have to be repaid (Sweden, Citation2020).
5. Conclusion and policy implications
The otherwise similar Scandinavian countries have conspicuously different automobile tax regimes. The Danish system entails very high tax rates with moderate CO2 differentiation. In Norway, tax rates are not quite as high, but strongly CO2-differentiated, with zero emission vehicles totally exempt, even from VAT. Sweden practices feebates, i.e. CO2 dependent subsidization along with moderate taxation.
Relying on a disaggregate discrete choice model of automobile purchase estimated on Norwegian data, we examine and compare the GHG mitigation effects of the respective three fiscal strategies. We find the tax regimes to have remarkably strong effects on energy technology choice and CO2 emission rates, as well as on aggregate fiscal revenue. In essence, among the three jurisdictions examined, the Norwegian fiscal regime has by far the strongest GHG abatement effect. The Danish system is less effective in terms of CO2 abatement, but provides twice as much government revenue. The Swedish feebate strategy is by far the least effective, in terms of CO2 mitigation as well as revenue collection.
The Norwegian motor vehicle taxation system and zero emission vehicle incentives give rise to a record low mean rate of automobile CO2 emissions and to the highest zero emission car market share in Scandinavia and in all of Europe. It generates considerable amounts of public revenue, although this effect is weakened, ironically, by the system’s success in raising the market shares of zero and low emission vehicles with zero or low tax rates. Contrary to common belief, the rapid market uptake of BEVs in Norway is due to taxation rather than subsidization.
The Danish regime of automobile purchase and ownership tax is without much doubt the stiffest among European nations. It generates large amounts of public revenue – more than twice as much as the Norwegian system, and more than 17 times as much as the Swedish feebate (bonus-malus) and CO2 based ownership tax. Its convex structure and its fuel economy component stimulate demand for smaller and leaner cars, resulting in a relatively moderate mean level of CO2 emissions among new cars registered in Denmark. The previous (2015) system, where BEVs were fully exempt from registration tax, was, however, more effective in terms of CO2 mitigation.
The observed market share of BEVs in Denmark − 0.7 percent in 2018 – is, however, far below the 8 percent level predicted by our discrete choice model. We believe the explanation must be sought in the absence, in Denmark, of numerous incentives that are in effect in Norway – incentives that have conditioned our model parameters, in particular the BEV dummy coefficient. Also, the fiscal policy pursued in Denmark over the last few years may have been too inconsistent to convince a large share of the car customers about the benefits of BEV ownership.
Among the three tax systems considered, the Swedish bonus-malus system and the previous environmental subsidy scheme give rise to Scandinavia’s highest mean CO2 emission rates, a low market share for BEVs (some of which are exported after the first owner has cashed in the bonus), and – by far – the least favorable effect on public finance.
Compared to fiscal regimes where cars are taxed rather than subsidized, the Swedish bonuses are also likely to generate a rebound effect – not accounted for in our study – in terms of increased aggregate automobile ownership and use. As seen from the perspective of an auto manufacturing country, this effect may not be without appeal. Perhaps this is precisely where the large differences in motor vehicle taxation policies between the Scandinavian countries, and throughout Europe, have their deepest root.
Acknowledgements
Thanks are due to the editor and two anonymous reviewers for their insightful comments, and to Cyriac George for his diligent language laundering assistance.
Additional information
Funding
Notes
1 Abbreviations used: ICE = internal combustion engine; BEV = battery electric vehicle; PHEV = plug-in hybrid electric vehicle; HEV = non-plug-in hybrid electric vehicle; FCEV = fuel cell electric vehicle; ZEV = zero exhaust emission vehicle, i.e. BEV or FCEV; CNG = compressed natural gas; LPG = liquefied petroleum gas; VAT = value added tax; GHG = greenhouse gas; DKK = Danish kroner; NOK = Norwegian kroner; SEK = Swedish kronor.
2 Traditionally, type approval rates of fuel consumption and CO2 emission have been based on the NEDC laboratory trial. As of 2019, the WLTP test has in general replaced the NEDC. As a matter of transition, however, WLTP results are being ‘converted’ to NEDC values, to ensure continuity and predictability.
3 For ICE cars the gCO2/km threshold was 95 + 0,0457 x (kg weight – 1372), for cars using ethanol or wood gas the threshold was 150 + 0,0457 x (kg weight – 1372) and for BEVs or hybrids the threshold was 37 kWh per 100 km.
4 Source: Svenska Petroleum & Biodrivmedel Institutet (SPBI).
5 Source: Statistiska Centralbyrån
References
- Alberini, A., & Bareit, M. (2019). The effect of registration taxes on new car sales and emissions: Evidence from Switzerland. Resource and Energy Economics, 56, 96–112.
- Ben-Akiva, M., & Lerman, S. R. (1985). Discrete choice analysis: theory and application to travel demand. MIT Press.
- Berkovec, J. (1985). Forecasting automobile demand using disaggregate choice models. Transportation Research Part B: Methodological, 19(4), 315–329. https://doi.org/10.1016/0191-2615(85)90039-6
- Berkovec, J., & Rust, J. (1985). A nested logit model of automobile holdings for one vehicle households. Transportation Research Part B: Methodological, 19(4), 275–285. https://doi.org/10.1016/0191-2615(85)90036-0
- Berry, S. T. (1994). Estimating discrete-choice models of product differentiation. The Rand Journal of Economics, 25(2), 242–262. https://doi.org/10.2307/2555829
- Berry, S., Levinsohn, J., & Pakes, A. (1995). Automobile prices in market equilibrium. Econometrica, 63(4), 841–890. https://doi.org/10.2307/2171802
- Brand, C., Anable, J., & Tran, M. (2013). Accelerating the transformation to a low carbon passenger transport system: The role of car purchase taxes, feebates, road taxes and scrappage incentives in the UK. Transportation Research Part A: Policy and Practice, 49, 132–148. https://doi.org/10.1016/j.tra.2013.01.010
- Busse, M. R., Knittel, C. R., & Zettelmeyer, F. (2013). Are consumers myopic? Evidence from new and used car purchases. American Economic Review, 103(1), 220–256. https://doi.org/10.1257/aer.103.1.220
- Cerruti, D., Alberini, A., & Linn, J. (2019). Charging drivers by the pound: How does the UK vehicle tax system affect CO2 emissions? Environmental and Resource Economics, 74(1), 99–129. https://doi.org/10.1007/s10640-018-00310-x
- Chetty, R. (2009). The simple economcis of salience and taxation. NBER Working Paper 15246, National Bureau of Economic Research.
- Denmark. (2019a). Afgifter - provenuet af afgifter og moms. Skatteministeriet, Copenhagen.
- Denmark. (2019b). Strukturelt provenu fra registreringsafgiften 2019-2035. Skatteministeriet, Copenhagen.
- D'Haultfoeuille, X., Givord, P., & Boutin, X. (2014). The environmental effect of green taxation: the case of the French bonus/malus. The Economic Journal, 124(578), F444–F480. https://doi.org/10.1111/ecoj.12089
- Dineen, D., Ryan, L., & Ó Gallachóir, B. (2018). Vehicle tax policies and new passenger car CO2 performance in EU member states. Climate Policy, 18(4), 396–412. https://doi.org/10.1080/14693062.2017.1294044
- Figenbaum, E. & Kolbenstvedt, M. (2016). Learning from Norwegian battery electric and plug-in hybrid vehicle users. TØI Report 1492, Institute of Transport Economics, Oslo.
- Figenbaum, E., & Weber, C. (2018). Estimating real-world emissions of PHEVs in Norway by combining laboratory measurement with user surveys. World Electric Vehicle Journal, 9(2), 31. https://doi.org/10.3390/wevj9020031
- Fridstrøm, L. (2017). From innovation to penetration: Calculating the energy transition time lag for motor vehicles. Energy Policy, 108, 487–502. https://doi.org/10.1016/j.enpol.2017.06.026
- Fridstrøm, L. (2019). Reforming motor vehicle taxation in Norway. TØI Report 1665, Institute of Transport Economics
- Fridstrøm, L. (2021). The Norwegian vehicle electrification policy and its implicit price of carbon. Sustainability, 13(3), 1346. https://doi.org/10.3390/su13031346
- Fridstrøm, L., & Østli, V. (2018). The demand for new automobiles in Norway – a BIG model analysis. TØI Report 1665, Institute of Transport Economics.
- Fridstrøm, L., & Østli, V. (2021). Direct and cross price elasticities of demand for gasoline, diesel, hybrid and battery electric cars: the case of Norway. European Transport Research Review, 13(1), 3. https://doi.org/10.1186/s12544-020-00454-2
- Fridstrøm, L., Østli, V., & Johansen, K. W. (2016). A stock-flow cohort model of the national car fleet. European Transport Research Review 8: 22.
- Gately, D. (1980). Individual discount rates and the purchase and utilization of energy-using durables: Comment. The Bell Journal of Economics, 11(1), 373–374. https://doi.org/10.2307/3003422
- Gerlagh, R., van den Bijgart, I., Nijland, H., & Michielsen, T. (2015). Fiscal policy and CO2 emissions of new passenger cars in the EU. CPB Discussion Paper, 320. CPB Netherlands Bureau for Economic Policy Analysis, The Hague.
- Hagman, R., & Amundsen, A. H. (2013). Utslipp fra kjøretøy med Euro 6/VI teknologi. Måleprogrammets fase 2. TØI Report 1291, Institute of Transport Economics.
- Hagman, R., Gjerstad, K. I., & Amundsen, A. H. (2011). NO2-utslipp fra kjøretøyparken i norske storbyer. Utfordringer og muligheter frem mot 2025. TØI Report 1168, Institute of Transport Economics.
- Hauff, K., Pfahl, S., & Degenkolb, R. (2018). Taxation of electric vehicles in Europe: A methodology for comparison. World Electric Vehicle Journal, 9(2), 30. https://doi.org/10.3390/wevj9020030
- Hausman, J. A. (1979). Individual discount rates and the purchase and utilization of energy-using durables. The Bell Journal of Economics, 10(1), 33–54. https://doi.org/10.2307/3003318
- Houston, D. A. (1983). Implicit discount rates and the purchase of untried, energy-saving durables. Journal of Consumer Research, 10(2), 236–246. https://doi.org/10.1086/208962
- Johansen, B. G. (2020). Car ownership, driving and battery electric vehicles. Dissertation for the Ph.D. degree, Department of Economics, University of Oslo.
- Klier, T., & Linn, J. (2015). Using taxes to reduce carbon dioxide emissions rates of new passenger vehicles: evidence from France, Germany, and Sweden. American Economic Journal: Economic Policy, 7(1), 212–242. https://doi.org/10.1257/pol.20120256
- Lave, C. A., & Train, K. (1979). A disaggregate model of auto-type choice. Transportation Research Part A: General, 13(1), 1–9. https://doi.org/10.1016/0191-2607(79)90081-5
- Manski, C. F., & Sherman, L. (1980). An empirical analysis of household choice among motor vehicles. Transportation Research Part A: General, 14(5-6), 349–366. https://doi.org/10.1016/0191-2607(80)90054-0
- Muehlegger, E., & Rapson, D. (2018). Subsidizing mass adoption of electric vehicles: Quasi-Experimental evidence from California. NBER Working Paper No. 25359., University of California, Davis.
- Norway (2017). Notification of tax measures for electric vehicles. Letter to the EFTA Surveillance Authority. Norwegian Ministry of Finance, Oslo.
- Østli, V., Fridstrøm, L., Johansen, K. W., & Tseng, Y. (2017). A generic discrete choice model of automobile purchase. European Transport Research Review, 9(2), 16. https://doi.org/10.1007/s12544-017-0232-1
- Plötz, P., Funke, S. A., & Jochem, P. (2018). Empirical fuel consumption and CO2 emissions of plug-in hybrid electric vehicles. Journal of Industrial Ecology, 22(4), 773–784. https://doi.org/10.1111/jiec.12623
- Plötz, P., Moll, C., Bieker, G., Mock, P., & Li, Y. (2020). Real-World Usage of Plug-In Hybrid Electric Vehicles: Fuel Consumption, Electric Driving, and CO2 Emissions. Fraunhofer ISI and International Council on Clean Transportation, Berlin.
- Springel, K. (2021). Network externality and subsidy structure in two-sided markets: evidence from electric vehicle incentives. American Economic Journal: Economic Policy (forthcoming).
- Stitzing, R. (2016). Distributional and environmental effects of an emissions-differentiated car sales tax. Available at SSRN: https://ssrn.com/abstract=3050123
- SVT Nyheter (2018). Företag får miljoner i miljöpremier – säljer elbilar vidare till Norge.
- Sweden (2020). Klimatbonusbilar ska vara registrerade i fem år. Promemoria M2020/01180/R, Miljödepartementet, Stockholm.
- Tietge, U., Díaz, S., Mock, P., Bandivadekar, A., Dornoff, J., & Ligterink, N. (2019). From laboratory to road. A 2018 update of official and “real-word” fuel consumption and CO2 values for passenger cars in Europe. ICCT, Berlin.
- Wappelhorst, S., Mock, P., & Yang, Z. (2018). Using vehicle taxation policy to lower transport emissions. An overview for passenger cars in Europe. International Council on Clean Transportation, Berlin.
- Yan, S., & Eskeland, G. S. (2018). Greening the vehicle fleet: Norway’s CO2-differentiated registration tax. Journal of Environmental Economics and Management, 91, 247–262. https://doi.org/10.1016/j.jeem.2018.08.018
Appendix A:
The Scandinavian automobile taxation systems
A.1 Denmark
A.1.1 registration tax
The Danish one-off registration tax is, in essence, a convex, piecewise linear function of the vehicle’s ‘taxable’ value (). As of 2018, the charge is 85 percent of the taxable value up to DKK 189 200 (=€25 500) and 150 percent of the value above this threshold.
Figure A9. One-off registration tax for petrol driven passenger cars in Denmark in 2018 and retail price after tax, as functions of retail price before tax. Assuming maximal deduction for in-vehicle safety equipment and 135 gCO2/km emission rate.
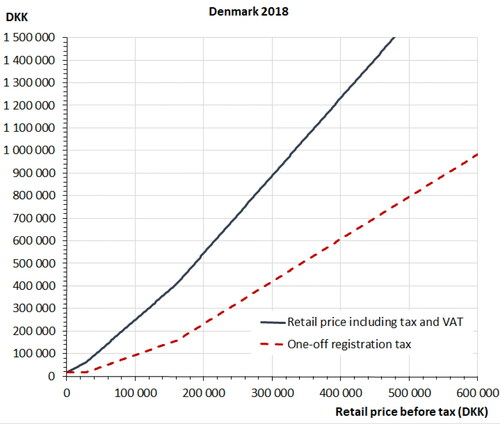
The taxable value is given by the retail price augmented by 25 percent VAT, but with deductions or additions depending of the vehicle’s safety standard. Cars earning at least five stars at the EuroNCAP test for crashworthiness are allowed a DKK 6000 deduction in taxable value. Also, for each airbag in excess of two, a DKK 1280 deduction applies, until a maximum of DKK 5120. Cars without airbags, on the other hand, are subject to a DKK 7450 addition in taxable value. For cars with one airbag only, the addition is DKK 3725.
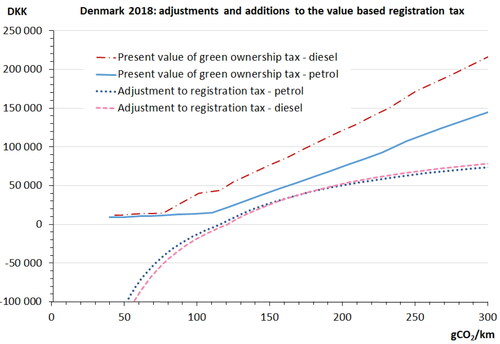
Also, the registration tax is adjusted according to the vehicle’s type approval fuel mileage. For every kilometer above 20 a car drives on a liter of petrol, the registration tax is reduced by DKK 4000 (= €539). A corresponding penalty of DKK 6000 applies for every kilometer below 20. The same tax rules apply to diesel vehicles, however with a threshold set at 22 kilometers per liter. When projected onto a scale in terms of gCO2/km, the fuel mileage adjustment translates into a concave function (). Even BEVs are subject to the same set of rules as petrol cars, with a conversion factor of 9125/x Wh per liter, x being the vehicle’s type approval energy consumption in Wh/km.
Figure A10. Present value of green ownership tax and energy efficiency adjustments to the one-off registration tax in Denmark in 2018, as functions of type approval CO2 emission rate. Assuming 4 percent discount rate and a 17-year vehicle life expectancy.
Seat belt warning lamps in excess of three give rise to a DKK 1000 deduction each, with a maximum deduction of DKK 3000.
However, no matter how many deductions apply, no passenger car will be subject to a registration tax of less than DKK 20 000, or possibly DKK 17 000 in the event of maximum seat belt alarm credit.
BEVs are allowed special reductions in the registration tax. As of 2018, BEVs were charged only 20 percent of the ‘normal’ registration tax. Until year-end 2015, they were entirely exempt from registration tax.
Also, a lump-sum final deduction of DKK 10 000 applies to BEVs and PHEVs in 2016–2018. The deduction for BEVs is being stepped up to DKK 40 000 in 2019 and DKK 77 500 in 2020, leaving BEVs up to DKK 400 000 (= €54 000) incl. VAT practically exempt from registration tax during these two years. PHEVs are entitled to a similar but smaller tax reduction.
The aggregate revenue from the Danish vehicle registration tax is estimated at DKK 21.1 billion in 2018, of which DKK 19.5 billion, or about €2.63 billion, relates to passenger cars (Denmark Citation2019a, Citation2019b). If we, to assess the mean level of automobile taxation, divide this revenue by the total passenger car sales, the figure corresponds to approximately €12 000 per vehicle.
A.1.2 fuel economy tax
Payable twice annually, the so-called ‘green ownership tax’ is differentiated according to the vehicle’s type approval fuel economy. The tax schedule is a descending, piecewise linear function of the fuel mileage, which translates into an essentially convex function of the emission rate as reckoned in gCO2/km. BEVs are charged according to the same petrol conversion factor as mentioned above (9125 Wh/liter). To counterbalance the lower rate of fuel tax on diesel compared to petrol, diesel ICE cars are charged an extra ‘equalization’ tax which, roughly speaking, makes the ‘green ownership tax’ about 50 percent higher for diesel than for petrol cars.
In , the biannual fuel economy tax payments have been discounted over the vehicle’s lifetime and converted into net present values.
The revenue from the ‘green ownership tax’ was around DKK 10.77 billion in 2018 (Denmark Citation2019a) – about half as much as the revenue from registration tax.
A.1.3 vehicle insurance tax
All motor vehicles registered in Denmark are subject to mandatory liability insurance. A fee of 42.9 percent is levied on the liability insurance premium. The revenue from vehicle insurance tax is estimated at DKK 1.5 billion in 2018 (= €200 million), corresponding to 4.5 percent of the aggregate revenue from registration and ‘green ownership’ tax. But not all of this revenue pertains to passenger cars.
A.1.4 energy taxes and prices
Consisting of various components, the Danish fuel tax as of 2018 amounts to DKK 4.63 per liter of petrol and DKK 3.15 for diesel. Electricity is subject to a couple of charges summing to DKK 1.029 per kWh in 2018, of which DKK 0.119 is a variable public service obligation (PSO) charge supporting the development of renewable energy sources.
The corresponding average retail prices in 2018 are DKK 12.31 (= €1.66) and DKK 10.88 (= €1.47) per liter of petrol or diesel, respectively, and DKK 2.35 (= €0.32) per kWh of electricity (see ).
A.1.5 road toll and ferry fares
There are two major tolling schemes in operation in or into Denmark, across the straits of Storebaelt and Øresund. On the former connection, private motorists are charged a standard fee of DKK 245 (= €33), while on the latter the fee is DKK 385 (= €52). The toll revenue from these two bridge crossings was DKK 4.279 billion (= €577 million) in 2018. Toll rates are not differentiated by vehicle powertrain technology.
Some 50 domestic ferry connections are in operation in Denmark. The users are charged for the service, but municipal ferry crossings are subsidized by the central government, by altogether DKK 95 million (= €12.8 million) in 2019. There is no fare differentiation by vehicle powertrain technology.
A.2 Norway
A.2.1 registration tax
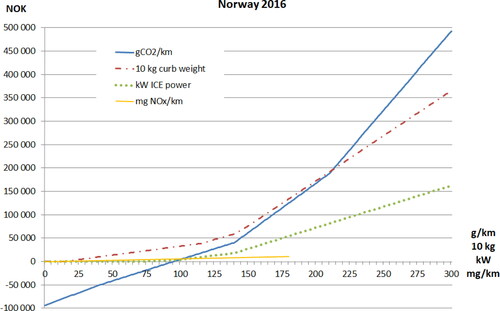
As of 2016, the Norwegian one-off registration tax was a sum of four separate components, calculated on the basis of curb weight, ICE power, and type approval CO2 and NOX emission rates, respectively (). All but the NOX components were convex functions, except for the below zero part of the CO2 component; which was negative and hence deductible below 95 gCO2/km. The total purchase tax rate could not, however, become negative, as in the French or Swedish bonus-malus system (see D'Haultfoeuille et al. (Citation2014) and section A.3.1 below).
Certain tax advantages apply also to plug-in hybrid vehicle (PHEVs). As of 2016, their taxable curb weight was to be reduced by 26 percent prior to calculating the weight component. This essentially means that for PHEVs, every point on the red curve in is shifted 35.1 percent to the right (since 1/(1 − 0.26) = 1.351).
For ordinary (non-plug-in) hybrid electric vehicles (HEVs), a weight ‘rebate’ of 10 percent applied in 2016. This rebate has since been abolished, as has also the entire ICE power component.
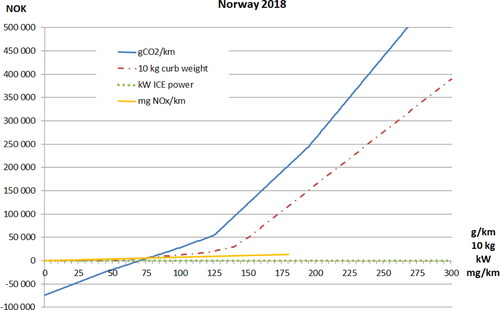
By 2018, the CO2 component tax schedule had been sharpened, i.e. tilted upwards and moved to the left. Also, the weight component has become more convex, i.e. tilted down over the lower weight range, but upwards in the higher weight intervals ().
Figure A11. One-off registration tax for passenger cars in Norway in 2016, as a function of curb weight, combustion engine power, and type approval CO2 and NOx emission rates. Source: Fridstrøm and Østli (Citation2018).
As of 2018, the weight deduction applicable to PHEVs has been lowered to 23 percent, now shifting the weight curve only 29.9 percent to the right. Moreover, the deduction has become contingent upon the type approval electric range. Only cars exhibiting an all-electric driving range of at least 50 km are eligible for a full 23 percent reduction. If the range is r < 50 km, the weight deduction is set at 23·r/50 percent.
Figure A12. One-off registration tax for passenger cars in Norway in 2018, as a function of curb weight and type approval CO2 and NOx emission rates. Source: Fridstrøm and Østli (Citation2018).
The aggregate revenue from vehicle registration tax in 2018 was around NOK 14.8 billion (= €1.56 billion), of which an around 70 percent share relates to passenger cars. If we divide this revenue by the total passenger car sales, the figure corresponds to approximately €6560 per vehicle.
A.2.2 annual ownership tax
As of 2018, passenger cars are subject to a daily ‘traffic insurance tax’, collected by the insurance companies, but equivalent to the previous annual circulation (ownership) tax. Over the calendar year, the tax amounts to NOK 2858 (= €300) for passenger cars, although diesel cars without a factory mounted particle filter are subject to a somewhat higher charge: NOK 3331 per annum. BEVs and FCEVs are exempt. Before January 2018, a small charge was levied even on BEVs: NOK 445 in 2016. During 2002-2016, the annual circulation tax rates were adjusted annually for inflation, but no significant changes occurred to the real tax rates.
A.2.3 energy taxes and prices
As of 2018, the Norwegian fuel tax amounts to NOK 6.33 per liter of petrol and NOK 5.08 per liter of diesel. These rates consist of a ‘road use’ component (NOK 5.17 and NOK 3.75) as well as a ‘CO2 component’ (NOK 1.16 and NOK 1.33). The fuel taxes are augmented by 25 percent VAT.
The average retail prices in Norway in 2018 were NOK 15.55 (=€1.64) and NOK 14.86 (= €1.56) per liter of petrol or diesel, respectively ().
Electricity is subject to a ‘consumption tax’ of NOK 0.166 per kWh as of 2018. As averaged over all 12 months of 2018, the price of electricity delivered to private households in Norway was NOK 1.159 (=€0.122) per kWh including consumption tax and VAT.
A.2.4 road toll and ferry fares
As of December 2018, some 55 toll roads and cordons were in operation in Norway. In most of these, BEVs and FCEVs pass for free, although in some places moderate charges have recently been implemented even for BEVs. According to national regulation, the toll charge for a BEV cannot exceed 50 percent of the charge applicable to petrol cars.
In some toll rings, the charge is differentiated slightly between petrol and diesel cars, as well as by the hour. In the Oslo toll rings, e.g., diesel cars are charged a NOK 2–4 higher rate than petrol cars.
Almost all tolling in Norway is automatic. There is no need for the driver to stop at the tolling point.
The aggregate revenue from tolling reached NOK 11 billion (=€1.16 billion) in 2018.
The national and regional road networks of Norway include a large number of ferry crossings – some 120. Unlike in Sweden, the ferry voyages are not in general free of charge. But zero emission vehicles (ZEVs) enjoy reduced rates – in many cases the ZEV itself travels for free, or at a 50 percent reduced rate, while the occupants are charged the standard passenger fare.
A.2.5 value added tax
The general VAT rate in Norway is 25 percent. BEVs and FCEVs are, however, exempt from VAT, as are also the BEVs’ batteries and leasing contracts.
For certain buyers, the VAT exemption is without effect. VAT registered taxi companies, car dealers and car rental and leasing companies are able to deduct input VAT on the passenger cars acquired. The same does not apply to private households, nor does it apply to companies whose primary purpose is not the sale, lease or use of the automobile. Thus, by a special provision in the Norwegian VAT law, the input VAT on automobiles acquired as company cars is not in general deductible, even if the company is VAT registered.
A.2.6 other taxes and incentives
Certain other fiscal and regulatory incentives also help improve the BEVs’ competitiveness in Norway.
The reregistration tax, payable on used car transactions, varies between NOK 1594 and NOK 6161, depending on the vehicle’s weight and age. Since January 2018, BEVs and FCEVs are exempt. This tax is, however, probably of little concern to the buyers of new vehicles, which is why we do not pay more attention to it in this study.
In municipal parking lots and lanes, BEVs and FCEVs may generally park free of charge, in many cases also with free recharging.
The private use of company cars is subject to ordinary income tax, at a rate given, as of 2018, by 30 percent of the car’s list price as new up to NOK 303 900 (= €32 000), and by 20 percent above this threshold. For BEVs, the tax base is reduced by 40 percent.
Bus lanes are, in general, open to BEVs and FCEVs. Some exceptions apply. In the E18 corridors into Oslo, e.g., BEVs must have at least two occupants to be allowed in the bus lane during the rush hours.
The Enova government agency provides financial support for the establishment and operation of charging stations on major roads, as well as for hydrogen refuelling facilities. In 2017 and 2018, the annual aggregate amount of support was around NOK 40 million (=€4.2 million).
A.2.7 summary of zero emission vehicle incentives
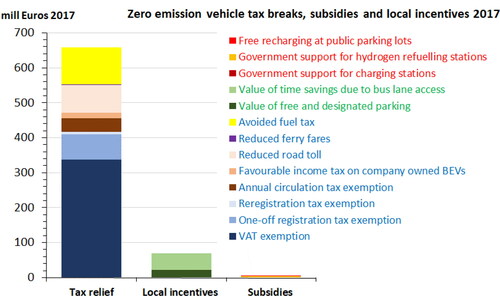
The aggregate amount of ZEV incentives in effect in Norway in 2017 is exhibited in .
One notes that the great bulk of ZEV incentives, some 90 percent, consists in tax relief. ZEVs are exempt from most charges applicable to ICE vehicles, or they are charged at reduced rates. As of 2017, only 0.8 percent of the incentives consists in government expenditure, in other words in subsidies properly speaking. None of these subsidies take the form of cash payments directly to the buyers or users of ZEVs.
The local incentives in terms of bus lane access and free and designated parking have been valued by Figenbaum and Kolbenstvedt (Citation2016) at NOK 4498 and NOK 2349, respectively, per BEV owner per annum, totaling NOK 667 million (= €70 million) when summed across all BEVs on the road in 2017. Local incentives correspond to an estimated 9.4 percent of all ZEV incentives in 2017.
Figure A13. Aggregate value of ZEV incentives in Norway in 2017. Sources: Norway (2017), Figenbaum and Kolbenstvedt (Citation2016).
A.3 Sweden
A.3.1 bonus-malus from July 2018
On 1 July 2018 the Swedish government implemented a feebate system for new passenger cars, generally referred to as ‘bonus-malus’. The bonus is a one-off purchase subsidy, while the malus is a temporarily increased annual circulation tax for ICE cars.
Private buyers of zero and low emission automobiles are awarded a one-off bonus of up to SEK 60 000 (= €5810) per vehicle. The maximum bonus applies to ZEVs, i.e. BEVs and FCEVs.
For low emission cars, such as PHEVs and lean ICE vehicles, the bonus is given by SEK 60 000 minus SEK 833 per gCO2/km emitted according to the type approval test. At 72 gCO2/km, the bonus becomes zero.
Cars fueled by compressed natural gas (CNG – essentially methane) or similar receive a one-off bonus of SEK 10 000.
For ICE cars registered after 1 July 2018, during the first three years the CO2 component (malus) includes an annual base tax of SEK 360, on top of which is added SEK 82 per gCO2/km emitted, above a floor of 95 gCO2/km and below a ceiling of 140 gCO2/km. Above 140 gCO2/km, the rate is SEK 107 per gCO2/km. From the fourth year of operation, the tax is stepped down to the standard ownership tax rate of SEK 360 plus SEK 22 per gCO2/km above 111 gCO2/km.
In addition, vehicles with a diesel engine are charged a permanent ‘environmental component’ of SEK 250 per annum and a ‘diesel fuel component’ given by 13.52 times the NEDC rate of emission as measured in gCO2/km.
Automobiles equipped for alternative fuels, such as E85, wood gas or bio-methane, are charged less. Here, the annual CO2 component is calculated as SEK 360 plus SEK 11 per gCO2/km above 111 gCO2/km.
ICE vehicles fuelled by liquefied petroleum gas (LPG – essentially propane and butane) are charged for CO2 according to the same rates as other ICE vehicles.
For corporate buyers of passenger cars, more complex bonus-malus rules apply. The bonus cannot exceed 35 percent of the price difference between the BEV and the most ‘comparable’ ICE vehicle.
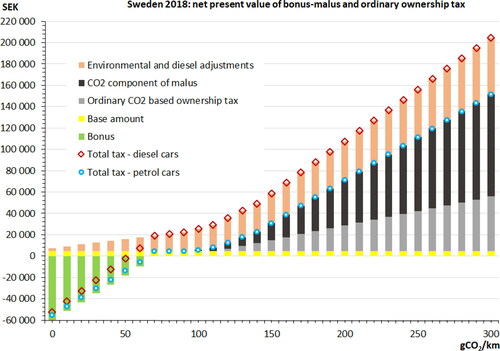
A graphic illustration of the Swedish passenger car taxation system is provided in .
The general tax level is much lower than in Denmark and Norway. A diesel car emitting 135 gCO2/km by the type approval (NEDC) test is subject to a total tax of SEK 45 822 (= €4440), when all annual tax payments are discounted and converted into net present values. For a petrol car with the same rate of emission, the charge is SEK 20 226 (= €1960). For any car emitting less than 50 gCO2/km, the total tax incurred is negative.
Also, it is worth noting that while most tax schedules in Denmark and Norway are convex, the same is not true in Sweden. For petrol as well as for diesel cars the marginal tax rate is higher in the 0 to 70 gCO2/km interval than in the 70 to 300 gCO2/km interval ().
Figure A14. Net present value of bonus-malus and ordinary ownership tax on passenger cars in Sweden in 2018, as functions of type approval CO2 emission rate. Assuming 4 percent discount rate and a 17-year vehicle life expectancy.
A.3.2 tax regime before July 2018
Prior to the implementation of the bonus-malus system, a somewhat simpler tax regime was in effect. Passenger cars were subject to an annual circulation tax of SEK 360 plus a CO2 component given by SEK 22 per gCO2/km in excess of 111 gCO2/km. Diesel cars were in addition subject to the same diesel component as in use after July 2018. Cars with lower CO2 emissions than a calculated ‘environmental’ thresholdFootnote3 was exempt from the tax during the first 5 years. For vehicles registered before 2006 also a weight component was levied.
Between July 2012 and June 2018, a graduated one-off environmental subsidy (‘supermiljöbilspremie’) was in effect for buyers of zero and low emission automobiles. From January 2016, the subsidy payable to private buyers was SEK 40 000 for a BEV and SEK 20 000 for a PHEV with a type approval emission rate no higher than 50 gCO2/km.
A.3.3 energy taxes and prices
The petrol tax in 2018 was SEK 6.43 = €0.62 per liter, and the diesel tax was SEK 6.16 = €0.60. The average per liter fuel prices were SEK 15.37 (= €1.49) for standard petrol and SEK 15.51 (= €1.50) for dieselFootnote4 ().
The Swedish electricity tax is SEK 0.331 per kWh as of 2018. As averaged over all 12 months of 2018, the price of electricity delivered to private households in Sweden has been calculated at SEK 1.45 (= €0.14) per kWh including electricity tax and VAT.Footnote5
A.3.4 road toll and ferry fares
On the Swedish road network, there are only six instances in which motorists are charged for road use.
Small, so-called ‘infrastructure charges’, of SEK 5 and SEK 11 per passenger car, are applied on the Motala and Sundsvall bridges, respectively.
More importantly, toll is collected on the border bridges to Norway (at Svinesund) and to Denmark (across Öresund), with standard rates amounting to SEK 22 and SEK 536 (= €51.90), respectively.
Finally, congestion charging is applied in the two major cities of Stockholm and Gothenburg. Vehicles circulate free of charge between 6.30 p. m. and 6.00 a. m., on Saturdays, Sundays, holidays and days before holidays, as well as throughout the month of July.
Until July 2012 some of the low emission vehicles, such as BEVs, HEVs and PHEVs, were not paying any toll in the Stockholm congestion charging scheme. As of 2018, there is no differentiation by powertrain technology
Some 60 domestic ferry connections are in operation in Sweden, of which 40 are free of charge and run by the Swedish Transport Administration (Trafikverket). Privately operated ferries do, however, normally charge motorists for the service. There is no fare differentiation by vehicle powertrain technology.
A.3.5 traffic insurance tax
Vehicle insurance providers are charged a 32 percent tax on the insurance premium specified in each individual policy. It may be assumed that the tax is generally passed through to the insurance buyers.
According to the Swedish government budget and (preliminary) accounts, the revenue from traffic insurance tax in 2018 was SEK 2886 million (= €280 million). Note, however, that not all of this revenue pertains to passenger cars.
Appendix B:
the BIG-5.1 discrete choice model of automobile purchase
To predict how automobile demand changes in response to fiscal incentives, a behavioral choice model is helpful. Østli et al. (Citation2017) estimated a nested logit model (Ben-Akiva and Lerman, Citation1985: 285) based on a complete, disaggregate data set covering all new passenger car purchases in Norway during 1996-2011. In 2011, however, the battery electric vehicle (BEV) share of new automobile registrations in Norway was no larger than 1.4 percent, reflecting a rather limited supply of BEV models.
A more solid empirical foundation is provided by our updated nested logit model of automobile choice (BIG-5.1), based on data covering the period from January 2002 to early October 2016 (Fridstrøm and Østli Citation2021). Almost 1.8 million individual car transactions are included in the data set, which has been organized into 30 175 rows, each describing a given model variant of which at least one specimen was sold in a given year. On average, there were 2012 different models variants offered annually in the Norwegian market during 2002-2016.
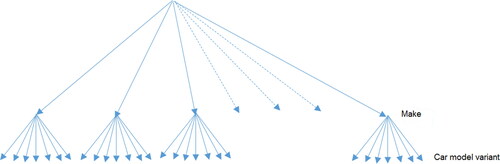
The upper nests of the model are defined as makes (brands), while the lower level alternatives consist of the model variants offered by each manufacturer (). Although the differences between certain variants are miniscule, they are all defined as separate units in the data set. The model contains 81 parameters, of which 19 are utility scale parameters characterizing the lower nests. Important independent variables include the list price of the vehicle, the tax percentage, the energy technology, the per km energy cost, the all-electric range, the vehicle size, make, number of seats, body style, transmission, and traction (four-, rear-, or front-wheel drive).
Figure A15. Nest structure in discrete choice automobile purchase model. Source: Østli et al. (Citation2017).
The model essentially distinguishes between five energy technologies:
Petrol internal combustion engine (ICE) vehicles
Diesel ICE vehicles
Ordinary (non-plug-in) hybrid electric vehicles (HEVs)
Plug-in hybrid electric vehicles (PHEVs)
Battery electric vehicles (BEVs)
Although hydrogen fuel cell electric vehicles (FCEVs) were also present in the Norwegian market in 2016, with 23 vehicles sold, corresponding to a 0.015 percent market share, information on this sixth energy technology is presently too scant to allow for demand modeling. Hence, FCEVs have been excluded from our data set.
The same applies to cars running on liquefied petroleum gas (LPG) or compressed natural gas (CNG), of which there are almost none in the Norwegian automobile fleet. Also excluded are a small number of atypical, minibus-like passenger cars with 8 or 9 seats, as well as a small number of uncommon cars for which list price information was inaccessible. Taken together, 99.1 percent of the new passenger cars registered between January 2002 and October 2016 are included in the data set.
Relying on the Biogeme Python software, Fridstrøm and Østli (Citation2018, Citation2021) estimated the model by the maximum likelihood method. Selected results are set out in . A more comprehensive documentation of the model is offered by Fridstrøm and Østli (Citation2021).
Table A3. Selected coefficient estimates of nested logit model of automobile choice. Source: Fridstrøm and Østli (Citation2021).
One notes that all parameters shown in the table are highly significant and have the expected sign, giving rise to remarkably narrow confidence intervals. The list price coefficient is, e.g., estimated at −0.203, with a standard error of 0.0012. The 95 percent confidence interval stretches from −0.2054 to −0.2007
This high precision applies even to the coefficients not shown in the table − 8 dummies for vehicle body style, 19 scale parameters, and, with one exception, 34 dummies for automobile make. For an account of all of these coefficients, we refer the reader to Fridstrøm and Østli (Citation2021).
Concerning the interpretation of the model’s coefficients, a few clarifications may be in order.
The Price variable includes all purchase taxes – essentially VAT and one-off registration tax.
The Resourcecostshare variable is given by the price net of tax divided by the price including VAT and registration tax. In the Norwegian data set, it is equal to 1 for BEVs and varies between 0.3 and 0.8 for ICE vehicles, HEVs and PHEVs.
We interpret the Resourcecostshare variable as a residual measure of quality, or, more precisely, as the value of all those quality attributes not explicitly accounted for through the other independent variables. The sign of this coefficient is, as expected, positive. The interpretation is that buyers are more willing to accept a price increase coming from the manufacturing or marketing side, presumably reflecting some quality enhancement, than a price increase due to increased taxation. The Resourcecostshare variable allows us to identify effects due to either of these two mechanisms.
Chetty (Citation2009) finds that salience matters: when the tax becomes visible, demand goes down, even if the price inclusive of tax is unchanged. The sign of the Resourcecostshare coefficient is consistent with this.
Following some best-fit trial and error, the all-electric ranges of PHEVs or BEVs (BEVrange and PHEVrange) have been entered into the model in the form of square root functions, meaning that the indirect utility of a BEV or PHEV is a concave function of its range. The willingness-to-pay for additional range is positive, but diminishing with the initial range.
The logarithmic Dieseltrend variable captures the perceived continual improvement of diesel vehicle technology during 2001-2011. Here again, several specifications were tried out, including the linear and the square root functions, before concluding that the logarithmic form provides the best explanatory power.
Since 2011, however, the reputation of diesel automobiles has deteriorated markedly. Well before the Volkswagen scandal broke in 2015, Norwegian scientists (Hagman et al., Citation2011, Hagman and Amundsen, Citation2013) had alerted policy makers to the large gap between real-world and laboratory measured NOX emissions from diesel driven passenger cars. New legislation has since opened the door on temporary or permanent local restrictions on diesel vehicle use. These restrictions, and the uncertainty surrounding their possible future enforcement and extension, have deterred many urban car buyers from choosing a diesel vehicle, bringing their market share down from 75.7 percent in 2011 to 17.7 percent in 2018. To capture the downward trend in the perceived utility of diesel cars after 2011, the model includes a set of five dummies, one for each year 2012-2016.
In the model, ICE energy costs are entered in the form of discounted future petrol or diesel expenditures (Energycost), calculated by multiplying (i) the current real price of fuel by (ii) the vehicle’s type approval rate of per km fuel consumption, by (iii) an assumed 13 000 km annual mileage, and by (iv) a 17-year automobile life expectancy, consistent with empirical estimates derived by Fridstrøm et al. (2016). We use a 4 percent annual discount rate.
For BEVs, a standard energy consumption rate of 0.2 kWh/km is used. For PHEVs, we assume 0.1 kWh/km of electric energy consumption in addition to the type approval petrol or diesel consumption. The current real price of grid electricity sold to private households (annual average, see ) is used for cost calculation.
The Energycost coefficient estimate comes out at −0.331, with a standard error of 0.0031. The 95 percent confidence interval goes from −0.3371 to −0.3249. By using the calculated net present value of lifetime energy costs rather than simply the per km fuel cost, we estimate a coefficient that is directly comparable to the list price of the vehicle. The ratio between the two reveals the car buyers’ willingness-to-pay for energy efficiency. We derive an implicit willingness-to-pay for a future euro saved on energy of 0.331/0.203 = 1.63 euros.
Hence, at first sight, Norwegian car buyers seem bent on saving energy, even if they lose from it. Assuming, however, a zero discount rate, in line with the real interest rate in the Norwegian market since 2008, and taking account of the large discrepancy between real-world and laboratory (type approval) rates of fuel consumption (20 percent as averaged over 2001-2016, see Tietge et al., Citation2019), our results are compatible with a €0.98 willingness-to-pay for one euro’s worth of future energy savings (Fridstrøm and Østli Citation2021). There is thus little evidence that Norwegian consumers be ‘myopic’, in the sense of undervaluing future cash flows. While at odds with Hausman (Citation1979), Gately (Citation1980) and Houston (Citation1983), our estimates concur with the more recent and relevant results of Busse et al. (Citation2013).
Figure 1. New passenger cars registered in Denmark 2011-2019, by energy technology.
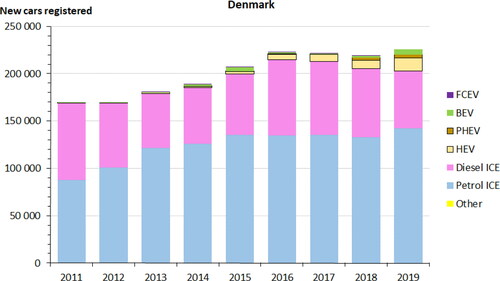
Figure 2. New passenger cars registered in Norway 1992-2019, by energy technology.
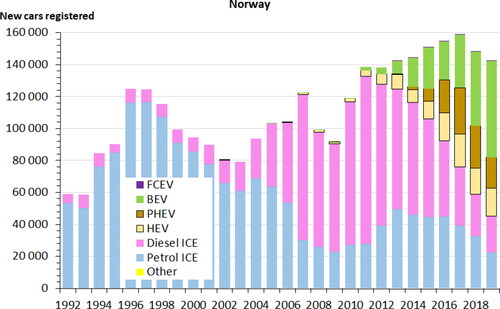
Figure 3. New passenger cars registered in Sweden 2006-2019, by energy technology.
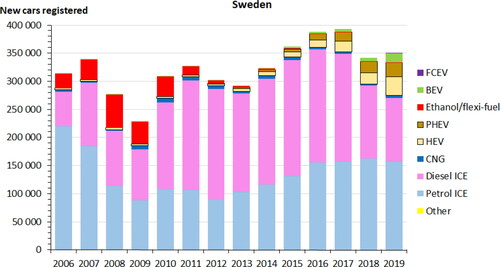
Figure 4. Mean type approval rates of CO2 emission from new passenger cars in the Scandinavian countries and in the EU 2001-2019. Miscellaneous sources.
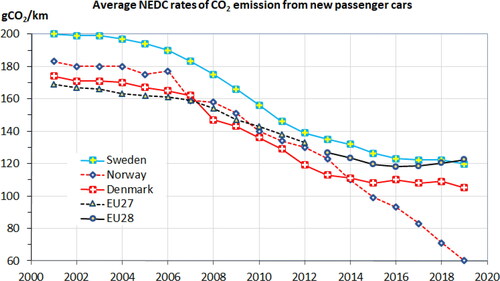
Figure 5. New automobile market shares (percent), by energy technology, observed (N0, DK0, S0) and modelled.
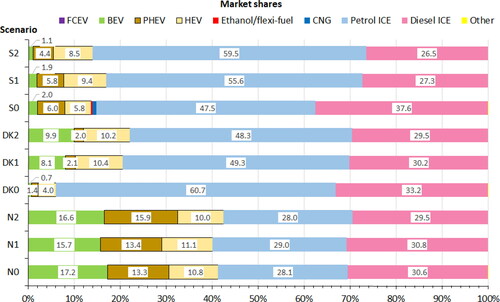
Figure 6. New passenger cars’ mean type approval CO2 emission rates, observed (N0, DK0, S0) and model predicted under factual or counterfactual fiscal scenarios.
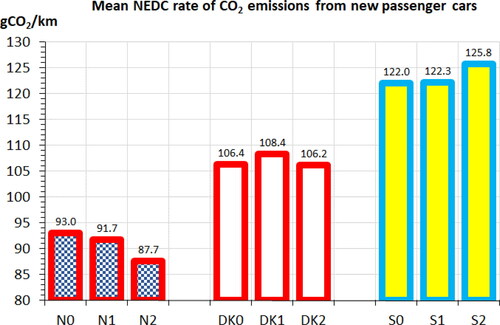
Figure 7. Net present value of aggregate fiscal revenue from new automobiles in six scenarios for Norway as of 2016.
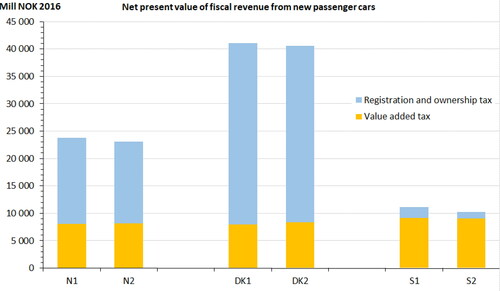
Figure 8. Calculated average retail price of new passenger cars before tax, under six fiscal scenarios.
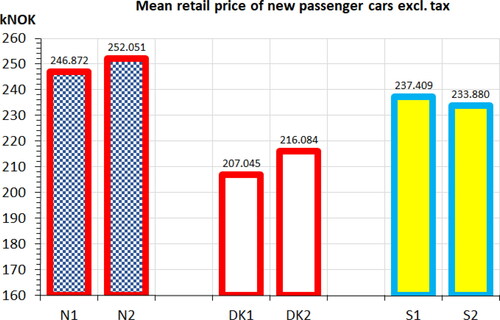
Table 1. Key statistics and characteristics of the three Scandinavian countries. Miscellaneous sources.
Table 2. Simplified overview of automobile taxation systems in Scandinavia as of 2018.