
Abstract
This article reports on the findings of a survey of 2,092 users and potential users of e-bikes in the UK. It analyzed their characteristics, their motivations, journey purposes and the barriers they perceive to the wider use of e-bikes. It compared the profiles of male and female users, and the differences in their use. It also compared respondents’ experience of e-biking and conventional cycling. It found that most e-bike users also rode conventional cycles. Physical and health constraints were common reasons for switching to e-bikes, particularly for hilly routes. Those who always commute by e-bike were most likely to have used a conventional cycle as their main commute mode in the past, whereas those who mostly or occasionally commute by e-bike were more likely to have used a car as their previous main commute mode. The minority of female respondents were younger than the men but gender differences in e-bike use were fewer than expected. The quality and availability of separate cycling infrastructure was frequently cited as an enabler or a barrier, suggesting that policies to promote cycling in general will also apply to e-bikes.
1. Introduction and context
Global sales of e-bikes (cycles with electric assistance, sometimes called “pedelecs”) have been rising exponentially since the early 2000s when the commercial development of lithium batteries began to expand their potential (Salmeron-Manzano & Manzano-Agugliaro, Citation2018); sales in Europe doubled between 2016 and 2019 (Mordor Intelligence, Citation2020). This growth has stimulated research interest in their use and their potential contribution to sustainable urban transport. The advances in research knowledge have been uneven, however. Outside China, the country with the largest number of e-bikes, most published articles have mainly drawn on small-scale surveys or trials. There have been few larger-scale national surveys, and some aspects of e-bike use, such as gender differences, use for commuting and particularly travel for work purposes, have been under-researched.
This article reports on a survey of 2,092 people based in the UK who were using an e-bike or considering the purchase or hire of one, supplemented by qualitative interviews. It will analyze their characteristics, their motivations, journey purposes and the barriers they perceive to the wider use of e-bikes, comparing the findings with knowledge from the literature about the use of e-bikes in other Western countries. It will also analyze the different profiles of male and female users, and the differences in their use. It will compare respondents’ experience of e-biking and conventional cycling, drawing conclusions for transport policy and the potential for expansion of e-biking in the UK.
2. Literature review
Since the early 2000s there has been continuing growth in research interest in e-bikes. Salmeron-Manzano and Manzano-Agugliaro (Citation2018) found year-on-year increases in published documents from 19 in 2008 to around 130 in 2017. Using the same database (Scopus) and the same search terms, yielded 191 for 2018 and 219 for 2019. Chinese and American sources dominate the list for slightly different reasons; China has the highest number of e-bikes in the world, whereas interest in the USA has tended to focus on the use of e-bikes for leisure or more sustainable urban transport (Ling et al., Citation2017; MacArthur et al., Citation2014). 41 articles identified by this method were published by authors based in the UK, which is the focus of this study, although several of these used Chinese data. None of those 41 studies used a large-scale survey of e-bike users.
The use of e-bikes in China has risen to such levels that they are increasingly regarded as a policy problem there, with some cities and provinces introducing restrictions or outright bans (Zuev et al., Citation2019). Some Chinese researchers have concluded that widespread use of e-bikes is a transitional phenomenon on a path toward automobility (Lin et al., Citation2018). By contrast the more modest growth in e-bike use in Western countries has occurred in a context of high car ownership and use, where e-bikes are generally viewed as a method for achieving more sustainable patterns of travel (Behrendt, Citation2018; Cairns et al., Citation2017; Fyhri et al., Citation2017; Johnson & Rose, Citation2013).
2.1. Who uses e-bikes in Western countries?
Most of the published articles from Western countries report on: small-scale trials, small-scale surveys (or large surveys with a small number of e-bike users), qualitative research or reflections on the role of e-bikes in transport policy. National travel surveys rarely identify e-bikes as a separate category, so despite the large volume of published research, the demographics and other characteristics of e-bike users in most countries remain uncertain (the UK’s National Travel Survey began asking about e-bike ownership, though not e-bike use, from 2019 – results were not yet available at the time of this research). One exception is the Dutch National Mobility Survey. Kroesen (Citation2017) analyzed that survey for 2013, 2014, and 2015. Over those years e-bike ownership rose from 9% to 13% of the sample (and sales have continued to rise since then, NU.nl, Citation2020). He found that e-bike owners were more likely to be: older, retired and female with small household sizes and lower levels of education but higher than average household income. They were more likely to live in areas of lower population density. Although e-bikes are often owned by older people, Kroesen (Citation2017) also found that younger e-bike owners were more likely to make extensive use of them.
In the USA, the National Institute for Transportation and Communities, a government agency, commissioned Portland State University to conduct a purposive national online survey of e-bike users in 2017 (MacArthur et al., Citation2018). From a sample of 1,796, they found some similarities and some differences from the Dutch sample. E-bike users were mainly older but more highly educated, predominantly male, white and mostly living in households with children; the ability to carry children was a frequent reason for acquiring an e-bike. 28.7% reported a physical limitation making conventional cycling difficult, which was another frequent reason.
Wolf and Seebauer (Citation2014) surveyed 1396 people who purchased an e-bike in Austria between 2009 and 2011 – “early adopters” who held both pro-environmental and technophile attitudes. 62% were over 60 with slightly higher than average car ownership but relatively low levels of income and education, which they associated with advanced age.
2.2. Impact on travel behavior
Evidence on the impact of e-bikes on overall travel behavior is mixed. From an international meta-study (excluding Chinese evidence) Bourne et al. (Citation2020) note that their impact largely depends on the primary mode of transport before their introduction; so in countries or cities where car use is dominant (which would include nearly all of the UK), they are most likely to substitute for car use.
In the Netherlands Kroesen (Citation2017) found that e-bikes are negatively associated with ownership of conventional bikes but not cars. However, Haustein and Møller (Citation2016a) found some evidence of people buying e-bikes to replace a car in Denmark, which is also a high-cycling country. In trials, loaned e-bikes have generally been well-used, substituting for other modes, including car driving (Cairns et al., Citation2017; Fyhri & Fearnley, Citation2015; Plazier et al., Citation2017) but the methods of measurement make it difficult to extrapolate an overall impact on travel behavior. Cairns et al. (Citation2017) and Plazier et al. (Citation2017) both found a greater impact on commuting than other travel purposes. de Kruijf et al. (Citation2018) also found a substantial modal shift, from driving and conventional cycling, in a trial aimed specifically at commuters.
The use of e-bikes for work travel (as distinct from commuting) has been largely neglected. Some of the surveys do not include work travel in their list of travel purposes (MacArthur et al., Citation2018); others list “work” as single category encompassing both commuting and work travel (Plazier et al., Citation2017; Wolf & Seebauer, Citation2014). Cairns et al. (Citation2017) found a third of employees loaned e-bikes used them for travel between different sites of the same employer with a smaller number using them for “other work travel”. Melia (Citation2016) explored the factors encouraging the use of e-bikes for work, using a case study of mobile health professionals, but this remains an under-researched area.
2.3. E-bike use by age and income
Some studies have explored the differential use of e-bikes amongst riders from different age groups. Several studies confirm the expected distinction between recreational use by older riders and utilitarian use by younger riders (Haustein & Møller, Citation2016a; Ling et al., Citation2017; Wolf & Seebauer, Citation2014). Haustein and Møller (Citation2016a) commented that the differences were less pronounced than they expected; attitudes explained more of the variation than age. Ling et al. (Citation2017) found interest in acquiring an e-bike was similar across age groups but the reasons differed; younger respondents were more interested in faster speeds and less sweating, whereas older respondents were more interested in assistance against hills and winds and keeping up with other riders. Johnson and Rose (Citation2015) and Van Cauwenberg et al. (Citation2018) found similar motivations amongst older e-bike users in Australia and Belgium respectively. Most of the respondents previously rode conventional bikes. E-bikes reduce their pedal cycling but they remained relatively active, suggesting that e-bikes offer the potential to extend active travel into later life. Leger et al. (Citation2019) explored this aspect in a qualitative Canadian study. Older riders explained how e-bikes enabled them to continue riding, which physical constraints would otherwise have prevented. Some interviewees also mentioned social reasons, such as continuing to ride with a club or even with a spouse or partner. However, in a Danish study (Haustein & Møller, Citation2016b) older e-bike users were more likely to report problems related to the weight of e-bikes, including its contribution to crashes.
Several studies have noted that e-bike ownership and use are both positively associated with household income (Bourne et al., Citation2020; MacArthur et al., Citation2014; Simsekoglu & Klöckner, Citation2019), but not how income affects the motivation of users or the impacts of e-bikes on overall travel behavior.
2.4. E-bike use by gender
There is a marked difference in the gender distribution of e-bike users between those countries such as the Netherlands, Denmark and (Dutch-speaking) Belgium, where rates of cycling are high for both genders, and countries with lower rates of cycling, particularly amongst women. Studies of the first group have often found a majority of women amongst samples of e-bike users (Haustein & Møller, Citation2016a; Kroesen, Citation2017; Van Cauwenberg et al., Citation2018), whereas studies from the USA (MacArthur et al., Citation2014; Citation2018) and Australia (Johnson & Rose, Citation2013) both found a large majority of males.
Several studies have examined gender differences in the nature of e-bike use. Kroesen (Citation2017) found that although Dutch women were more likely to own e-bikes, male e-bike users covered a greater distance on average. Haustein and Møller (Citation2016a) found little difference between genders in their segmentation of enthusiastic, utilitarian and recreational e-bike users in Denmark. This was consistent with the American national survey; MacArthur et al. (Citation2018) found, paradoxically, that strong gender differences in the motivations for acquiring e-bikes were not reflected in their actual use. Women were more likely to state that they would use e-bikes to carry cargo or children and less likely to cite recreational purposes but the purposes for which they used e-bikes (including recreation) were similar to men with one exception: men were more likely to cite “personal errands”. Amongst older e-bike users Van Cauwenberg et al. (Citation2018) also found similar levels of recreational use but men were more likely to ride alone, where women were more likely to do so in groups.
Some of the small-scale studies have explored gender differences in the use of e-bikes. Fyhri and Fearnley (Citation2015) found that the offer of a loaned e-bike caused a greater increase in the trips and distance cycled by women (who cycled less than men in the first place). Riggs and Schwartz (Citation2018) found that women were more likely than men to use cargo bikes (some of which were electrically assisted). When they asked some of the women about factors encouraging or discouraging their use, the answers focused around traffic conditions and infrastructure; women were more likely to ride on quiet roads and segregated cycle lanes or paths. This is consistent with similar findings about women’s use of conventional bikes (Beecham & Wood, Citation2014).
2.5. Potential and barriers
The potential for, or barriers to, e-bike adoption has sometimes been inferred from the decisions of existing users (Hiselius & Svenssona, Citation2014) or from small-scale trials (Plazier et al., Citation2018). There has been little research into people who might consider acquiring an e-bike. Simsekoglu and Klöckner (Citation2019) surveyed 254 users and 658 non-users of e-bikes in Norway. Comparing the two groups, they found different perceptions of the usability and safety of e-bikes but similar views about barriers related to weather, road conditions, cost and the risk of theft.
2.6. Knowledge gaps
The above review is not exhaustive but it is clear that despite a large and growing body of research on e-bikes some notable gaps remain. Large-scale national surveys are rare, so little is known about the demographics and characteristics of e-bike users in most countries, including the UK, which is the focus of this study. Nearly all the findings on the use of e-bikes for commuting and work travel, differences of use by gender and age and impacts on travel behavior have been based on small-scale surveys or trials, so far. From their recent meta-study Bourne et al. (Citation2020) conclude that the impact of gender, age and socio-economic status on e-bike use are priorities for future research.
This study will aim to fill some of those gaps with a large-scale survey of e-bike users and potential users in the UK and some analysis of the UK National Travel Survey. Section 6 will compare these findings with evidence from the international literature before drawing conclusions for policy.
3. Methodology
As e-bike users are still a relatively small proportion of the UK population a representative national sample with sufficient users would have been prohibitively expensive to obtain. Instead, a non-probabilistic sample was obtained through online means. These methods impose some obvious limitations on the conclusions below. The survey was publicized via: e-bike retailers, cycling organizations and networks and a “boosted” Facebook post targeting UK-based people who had expressed an interest in “electric bicycles”, “commuting” or “cycle commuting”. As the research objectives included gender comparisons, two channels were added to boost the participation of women: a Facebook group for women cyclists and the email list of a “Women in Cycling” conference.
The survey was piloted and made available during 2019. The introductory page explained that the survey was aimed at people living in the UK who had “ever used or considered using an e-bike”. Some questions were posed to subsets of the respondents, depending on their answers to previous questions.
Initial analysis of the survey findings revealed some significant differences in the use and motivations of users according to age and gender. Ten respondents were selected for interview on the basis of textual responses they had provided in the survey which illustrated some of these differences: “cycling for fun”, health and disability, transporting children, and use of cycle infrastructure. Six women and four men were interviewed by telephone to explore those issues in some more depth.
A descriptive statistical analysis of the survey results was undertaken in SPSS using chi-square tests for bivariate comparisons, followed by multi-variate regressions for some specific issues of interest. The survey also included seven open questions, which generated a total of 1,635 textual responses. Thematic analysis was undertaken by: first reading the open responses to identify common themes, then coding them in NVivo using word-searches guided by the initial reading. The coding was then re-read and refined “manually”. The interviews were summarized and coded under the same themes.
4. Main survey findings
4.1. Characteristics of the sample
summarizes the principal characteristics of the survey respondents, who are weighted toward older ages and middle to higher incomes. The targeted advertising marginally boosted the proportion of women, but this still remained a minority; 30% is slightly higher than the proportion of trips cycled by women reported in the National Travel Survey (DfT, Citation2019b). The availability of cars was considerably higher than the national averages (DfT, Citation2019a).
Table 1. Characteristics of respondents (some questions not answered by all).
The 39.6% aged 61 or over in the sample compares with 29.4% aged 60 and over in the UK population (ONS, Citation2020). The 55.8% with a degree education in the sample compares with 42% of the UK population with a degree or above (Labour Force Survey, Quarter 4, 2018). Fifty one percent of the UK population is female and 49% is male (ONS, Citation2020).
There were no substantial differences between the people who had or had not used an e-bike; the only statistically significant difference was a slightly lower proportion of the former (53.2%) with a degree education.
4.2. How and why respondents used e-bikes
Of the 1217 current e-bike users, 94% owned their own bikes, 3% were riding bikes provided by their employers and 3% owned by someone else, which might include public hire schemes. Amongst the types of bike 95% were using “electrically assisted bicycles”, 6% were using electrically-assisted cargo bikes and 3% electric tricycles. juxtaposes the reasons why the current owners decided to buy an e-bike and the reasons why some people were considering purchasing or borrowing an e-bike.
Table 2. Reasons for buying or considering buying an e-bike (multiple options allowed).
The current owners were more likely to have bought their e-bike for exercise – paradoxically because it is less effort to ride than a conventional bike. They were also more likely to cite shopping and carrying other items; in other respects their responses were similar to the reasons cited by non-users for considering purchasing or borrowing an e-bike. Several of the “considering” group were conventional cyclists anticipating a purchase when their fitness declined in future years. Those who said they were considering hiring or borrowing an e-bike were asked why they were not considering purchase. The two main responses were: cost (59%) and “because I enjoy conventional cycling too much” (68%).
40% of the current e-bike users used them for commuting and 20% had used them for work travel, both discussed below. By contrast, 91% used them for the various non-work purposes shown in .
Table 3. Non-work uses of e-bikes (multiple options allowed).
The most common themes amongst the open text “other” responses were: touring, holidays, off-road mountain biking, exercise or “fun”.
4.3. Comparisons with conventional cycling
Just over three quarters of the respondents currently using an e-bike also owned a conventional cycle. shows that the e-bikes were more frequently used; nearly a quarter of the respondents with conventional bikes were not using them at the time of the survey.
Figure 1. Frequency of use of e-bikes (N = 1347) and conventional bikes (N = 853) amongst e-bike users.
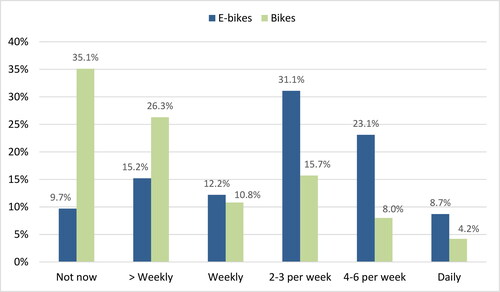
The respondents who were riding both e-bikes and conventional bikes were asked to compare their use and experience of both. shows that they rode longer distances on e-bikes; they were less likely to avoid hills or riding in bad weather or (to a lesser extent) in the dark. They were more likely to ride on main roads, which may have been partly explained in a few cases by a reduced feeling of vulnerability (at junctions). On the other hand, a significant minority felt that they were “cheating” by using electric power, and that people they knew were more likely to find their use of an e-bike “strange”.
Table 4. How would you compare your riding an e-bike with riding a conventional cycle?
Respondents who had given up riding e-bikes gave a wide range of reasons (mainly through the open text “other” option). The two most common themes related to the temporary availability of an e-bike and reversion to conventional cycling. One respondent summed up both of these reasons as follows:
“I only tried a demonstration bike and it was lovely. But when you ride for health and weight loss having an e-bike in the garage will ensure these benefits will be lost as the temptation to ride the e-bike would be too great.” (e-bike non-user, male, over 61)
4.4. Commuting
shows the main commuting modes of the employed or self-employed respondents. shows the reasons given for commuting by e-bike (in the present or the past).
Figure 2. Main commute modes of the employed or self-employed respondents (N = 1224).
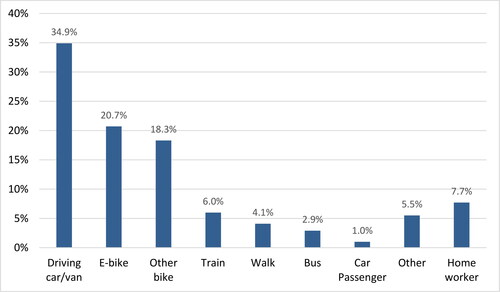
Table 5. Why do you commute by e-bike?
85% of the e-bike commuters used some combination of cycle lanes, cycle paths and/or shared pavements; the availability of cycle paths was a common reason for commuting by e-bike listed above. 25% said they usually took a longer route to use a cycle path. The “other” reasons were similar to the “other” reasons in Section 4.2, though with less reference to aging. The following quote combined several of the common themes:
“I could use a conventional bike but my e bike is quicker, easier and I sweat a great deal less, it also means I am not knackered at the end of my journey.” (e-bike user, male, 51–60)
Most e-bike commuters also used other modes at different times. The most common reasons were bad weather, followed by needing to drive for work reasons. shows the previous modes of commuting replaced by e-bike; driving a car or van was the most common. However, respondents who always commute by e-bike were most likely to have used a conventional cycle as their main commute mode in the past, whereas those who mostly or occasionally commute by e-bike were more likely to have used a car as their previous main commute mode.
Table 6. Before you started commuting by e-bike, what was your main commute mode?.
Compared with those who sometimes commute by e-bike, respondents who mostly/always commute by e-bike were significantly less likely to have a driving license and to have two or more cars in the household. They were significantly more likely to have children and to have no car in the household.
78 respondents had stopped e-bike commuting. Amongst a wide range of reasons, the most commonly cited were a change of job, the e-bike becoming unavailable and a health condition worsening or improving, allowing a return to conventional cycling.
4.5. Travel for work
19% of employed respondents had used an e-bike during the course of their work, including 41% of those who mostly/always commuted by e-bike and 29% of those who occasionally commuted by e-bike. shows the purposes of these journeys.
Table 7. For what type of work travel have you used an e-bike?.
shows the frequency of e-bike use for work purposes over the past month. Frequency of use was analyzed by gender, age, education, employment and income levels, using binary cross-tabulations and a multivariate logistic regression; none of these differences were statistically significant.
Figure 3. Frequency of e-bike work travel over the past month (N = 245).
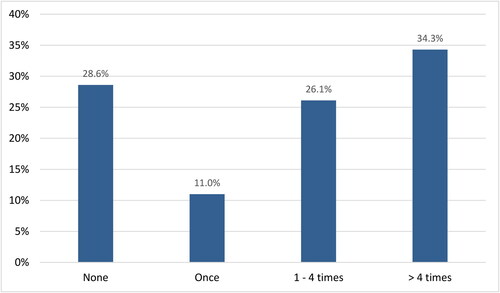
The reasons for e-biking for work travel were broadly similar to the reasons for commuting shown in , although parking problems were more frequently cited, by 39%. Only 9% ticked “because my employer suggested it”. Respondents were asked who had first proposed they use an e-bike for work travel. In 86% of cases it was the respondents themselves; employers had only proposed this in 7% of cases. This will be a significant point for the conclusions.
4.6. Gender differences
As shown in , the female respondents were mainly younger, more highly educated and more likely to be employed (in all sub-categories: full-time, part-time and self-employed) than the male respondents; household incomes were similar.
Table 8. Demographic differences by gender.
A cross-tabulation with a chi-square test was conducted by gender with all the questions relating to motivation, e-bike use and commuting behavior. shows all the variables with statistically significant differences from that initial sifting process. In the second stage, each of those variables was treated as the dependent variable in a binary logistic regression with the demographic variables, gender, age, education, employment status and household income as the independent variables. As shown in the penultimate column only three of these differences remained statistically significant in those multi-variate regressions. Women were more likely to buy an e-bike because they were physically unable to ride conventional bikes and they were more likely to cite hills as a reason for commuting by e-bike (presumably comparing this to the option of conventional cycling). 320 respondents usually commuted by e-bike and sometimes by other modes; amongst that group, men were more likely to use a motorbike as the alternative mode.
Table 9. Gender difference regression (all significant in bivariate π2 tests – not shown).
The interviews suggested that some apparent gender differences might relate more to different reporting propensities than to differences of experience. For example, two of the older male interviewees, who had indicated the “fun” aspect of e-bike use also mentioned health constraints and the effort involved in climbing hills but neither of them had ticked those choices when asked why they had bought an e-bike in the first place.
5. Motivations and barriers
The interviews and open survey responses provided more detailed insights into motivations and barriers to purchase and use of e-bikes. The following themes were especially prevalent as motivations: benefits to health and wellbeing, particularly in the context of aging, ill health or disability; improving fitness; fun and exploration; widening transport options; and pro-environmental attitudes coupled with interest in reducing car-use. Factors discouraging e-bike purchase and use included: cost of initial purchase; space, storage and security concerns (including fear of theft); and weight, size and maneuverability around physical obstacles on cycle paths, such as steps and narrow gates.
Many respondents commented that heavy/high speed motor traffic and poor quality cycle infrastructure created the same barriers to riding e-bikes as they did to riding conventional bikes. Some interviewees said, however, that riding an e-bike imbued them with greater confidence when cycling in traffic because they were able to accelerate more quickly from junctions and maintain more consistent speeds, especially up hill.
Although some factors had elements of both the positive and the negative, sections 5.1 to 5.4 below describe issues principally viewed as motivations, whilst 5.5 and 5.6 describe those perceived as barriers.
5.1. Age, health and wellbeing
Survey respondents aged over 61 were more likely to reference age in relation to e-bikes than any of the younger age groups. For many in the over-61 age group, e-bikes had offered an opportunity to extend their “cycling life” when riding a conventional cycle was becoming more difficult. This was particularly appreciated for leisure cycling with family, friends, cycling clubs and mountain biking groups, because it allowed these respondents to “keep up” with younger and more energetic members of the group.
Among those who did not own an e-bike, many said they would consider getting an e-bike to allow them to carry on cycling as they got older and less fit, even if some would postpone the decision for as long as possible, perhaps seeing an e-bike as a necessity (to continue cycling) rather than a pleasure.
Older respondents were more likely than younger people to have been motivated to buy an e-bike by specific health problems, but there were numerous examples of younger people purchasing an e-bike for this reason too. Some respondents had been motivated to buy an e-bike because they were unable to drive for health reasons, and continued to use it as a form of transport even when their health had recovered. Numerous respondents, or their family members (of all ages) used an e-bike due to ongoing disability which made it hard for them to use a conventional cycle or walk, as in this example:
“My wife is disabled and rides an electric trike, but at destination cannot walk far… The Cargo Trike carries her electric wheelchair increasing our mobility” (e-bike user, male, 51–60)
One person with a disability that affects his walking mobility saw an e-bike as a potential way of “filling a gap” between car and mobility scooter “the car being overkill for short journeys, the (mobility) scooter bulky to store, slower, range limited and offers no exercise opportunity.”(e-bike non-user, male, 41–50).
5.2. Fitness
Fitness was the most common theme throughout the open survey response, mentioned in 31% of comments from women, and 27% of comments from men. However, views were mixed as to whether fitness was a motivation or a barrier to using an e-bike. Many users said that riding an e-bike had improved their fitness (often in association with the health and wellbeing benefits described in the previous section). Others - mainly people who had not got an e-bike - believed that switching to an e-bike from a conventional bike would have the opposite effect.
“I am concerned for the health of younger people who choose to ride an electrically assisted bike when they should be using an unassisted one and getting fitter.” (e-bike non-user, male, over 61)
Indeed, there was a view among some of those who did not have one that e-bikes were not appropriate for people who had the capability to ride a conventional cycle.
“I’m probably really the wrong type, in that I’m fit enough that a E-bike is equal or slower, in speed.” (e-bike user, male, 41–50)
A judgmental tone was not uncommon among dissenters, for example:
“The only use I can see for E-bikes, is for a reasonable commute, for someone who is maybe a bit older, has some kind of an injury, or say a mother/father towing a kids trailer. Young/fit people riding e-bikes is a joke for anything other than the above….as for e-MTB's – scourge of the Earth!” (e-bike non-user, male, 41–50)
As mentioned in section 4.3, some existing users were aware of an “image problem” but refuted the claim that e-bikes were “cheating”.
“E-biking is amazing for all ages and fitness levels, all year round. Those fair weather cyclists who think it's cheating should consider who the real cheats are as they flee back to their cars when the weather gets bad!□” (e-bike user, male, 31–40)
5.3. Fun and exploration
A discourse of “fun” was apparent in many contributions, sometime coupled with the opportunities for “exploration” offered by an e-bike. One interviewee said his e-bike had added an extra dimension to his retired life, because an e-bike is a ’range extender’.
“New places to go, new sights to see….It’s given a new and pleasant dimension to my life, not to be too dramatic about it, but it’s the case.” (e-bike user, male, over 61).
Another interviewee (female, over 61) used her e-bike as her main form of transport but also spoke of her enjoyment of “going off exploring on it” to test the limits of the battery. A younger interviewee (male, 26–30) had bought an electric mountain bike because it was “more fun”. It enabled him to cover greater distances and also to “take paths where I don’t know where they go.”
5.4. Widening transport options
Many respondents had bought an e-bike to widen their transport opportunities. For some it replaced a car or taxi, for others it replaced conventional cycling, and for others it replaced walking.
“I was unable to cycle due to health reasons. My e-bikes greatly improve my range and independence, and enable me to carry my children easily. I use my e-bike to go shopping instead of taking a car.” (e-bike user, female, 31–40)
A female interviewee (over 61) had bought an e-trike principally to be able to take her grandchildren to nursery. She and her husband had got used to not having a car in London, and did not want to buy one when they moved to the South coast. She used a conventional bike for transport when she was not carrying children or other cargo. More women than men mentioned using an e-bike to transport children.
Other respondents had been able to replace driving to work with commuting by e-bike, for example:
“I now find reasons not to drive my car locally (5 miles) and cycle by e-bike. My time on the bike has gone up thousands of percent actively cycling. I now commute a twenty mile one way in all weathers about four trips out of ten (…). So I have gone from little cycling to at least 50 miles per week. (…) NONE of the above would have happened without the e-bike. I would have just looked out of the window and thought "nah" I will drive today!” (e-bike user, male, 41–50)
This section has described factors which served as motivations for e-bike use. The following sub-sections now consider some of the barriers articulated by respondents and interviewees.
5.5. Cost, security and maneuverability
The most frequently cited barrier to e-bike use was the cost of purchase, plus associated costs of insurance and replacement batteries. The high cost of purchase could exacerbate fear of theft, especially when e-bikes needed to be parked in public spaces.
“… I couldn't justify spending 7x my annual commute budget on something that was bound to be stolen if I left it on the street…”(former e-bike user, female, 41–50)
However, some e-bike owners commented that the initial outlay should be weighed against cost savings made when using the e-bike instead of other forms of transport.
“My bike - a longtail e-cargo bike was expensive, I built it up over a couple of years. However, it is the best investment I have made for my family; (…) I have saved money commuting - a lot of money, and all my children have gained confidence through time around the bike.” (e-bike user, male, 41–50)
Therefore, whilst the dominant discourse was one of e-bikes being chiefly available to those on high incomes, some saw them as suited to people on low incomes too; one respondent described them as: “perfect for transport for the low income person/family and of course like myself pensioners.” (e-bike user, male, over 61)
The weight, size and consequent impact on maneuverability were cited by some non-users as reasons for not buying an e-bike. Some of those who did use an e-bike commented on the difficulty of lifting them on and off trains, as well as negotiating steps at rail stations, which made them less useful for multi-modal trips. One respondent used her employer’s e-bike but had not bought one for this reason:
“If it was easier to get bikes on trains, I would certainly buy an e-bike, but having to book them on and the storage space being generally inadequate, it's not generally feasible to make a multi-modal trip” (e-bike user, female, 41–50).
5.6. Inadequate cycling infrastructure
Poor cycling infrastructure as an inhibitor to e-bike use was a common theme running through the narratives – particularly the inadequate provision of off-road cycle paths. Fear of cycling in heavy and fast-moving traffic is perceived as a major obstacle to greater e-bike uptake in the UK, just as it impedes all types of cycling.
Some e-bike users commented that even when off-road routes were available, they were impeded by gates, steps and kerbs, which could be harder to negotiate on an e-bike than a conventional bike because of the additional size and weight. This led to certain paradoxes. Firstly, these obstructions could be especially challenging for mobility-impaired people who otherwise regarded e-bikes as empowering. Secondly, people who used e-cargo-bikes/trikes for transporting children could be impeded from using segregated cycle routes (their preference when carrying the children, for safety reasons) by the difficulty of maneuvering e-cargo-bike around gates and other obstructions on such routes. Paradoxically, one interviewee said she was less able to use a safer, traffic free route carrying her children in her cargo bike than she was when cycling on her own using a conventional bicycle.
6. Discussion
The survey and interviews revealed a great diversity in the types of people using e-bikes and the purposes of their use in the UK. The e-bikes were used differently from conventional bikes, permitting riders to travel longer distances, climb more hills, cope with more challenging road conditions, ride more in bad weather and continue riding when health problems or advancing age might curtail their conventional cycling. The results showed similar patterns of use to those that have been found in other countries, particularly other Western Countries with relatively low levels of cycling, such as the USA, Canada and Australia. The multiple factors that combine to form a country’s “cycling culture” appear to shape e-bike-use in a similar way to its shaping of conventional cycling. One feature of the UK population of e-bike users that is shared with both “low” and “high” cycling countries, however, is their popularity among older age groups. Although our non-probabilistic sample does not permit firm conclusions to be drawn on the characteristics of e-bike users in the UK population, it is notable that 39% of the respondents were aged over 60 - considerably higher than the 29% of the UK population aged 60 or over (ONS, Citation2020). The propensity for higher ownership or use among older people corresponds with results from countries as different in their cycling cultures as the Netherlands (Kroesen, Citation2017), Austria (Wolf & Seebauer, Citation2014) and the USA (MacArthur et al., Citation2014).
Our study suggests that men strongly outnumber women among e-bike users in the UK – a situation that parallels other countries with lower rates of cycling, such as Australia and the USA (e.g., Johnson and Rose; MacArthur et al., Citation2014, Citation2018 ), but contrasts with countries such as the Netherlands, Denmark and (Dutch-speaking) Belgium, where rates of cycling are high for both genders. The proportion of women in our sample was boosted slightly but remained less than a third – it seems that e-biking is similar to conventional cycling in the UK in that respect. However, the gender differences in the use and attitudes to e-biking were less pronounced than expected; this concurs with Haustein and Møller (Citation2016a) findings, that there is little difference between genders in their segmentation of enthusiastic, utilitarian and recreational e-bike users in Denmark. Our own results may have been influenced by the sample, as the women were generally younger and more highly educated than the men. This largely explains why few of the bivariate differences shown in remained significant in a multivariate regression. It is notable that male and female respondents both mentioned reasons related to health or physical problems in equal proportions, although the men were generally older. This might suggest that women are more likely to switch from conventional cycling to e-biking for health reasons at a younger age, or it might reflect a lower propensity to report such reasons amongst the men, as suggested by two of the interviews.
The relatively high proportion of respondents in higher household income brackets corresponds with several other studies that have found a positive association between e-bike use and household income (Bourne et al., Citation2020; MacArthur et al., Citation2014; Simsekoglu & Klöckner, Citation2019). However, we also observed a strong negative correlation between age and income in the sample, with 53% of those aged 60 or younger having a household income of more than £55,000, compared with only 23.5% of the over-60s. This suggests that the cost of e-bikes is not necessarily suppressing their popularity amongst older, retired people on more modest incomes.
The reasons for buying or considering an e-bike (in ) revealed a paradox: most current owners cited “exercise” but also the fact that they are “less effort than a conventional bike”; they were more likely to cite both of these reasons compared to people who were considering an e-bike. Over three quarters of the current e-bike users also ride conventional bikes so most would be making this comparison based on recent experience. Similarly, a recent review (Bourne et al., Citation2020) found both “reduced overall effort in comparison to conventional cycling” and “improved health” to be among the most reported benefits of e-cycling. Some of the interviewees describe how e-biking entirely replaced conventional cycling for them, usually due to aging, declining fitness and/or health problems, but the broader pattern emerging from the survey suggests a more gradual transition where e-biking replaces some journeys previously covered on a conventional bike or other modes and also enables some new journeys. Although e-bikes take less effort than conventional bikes they enable exercise which might not otherwise happen. The strong discourse - in the qualitative parts of our study – of an e-bike “extending one’s cycling life”, corresponds with studies in Canada (Leger et al., Citation2019), Australia (Johnson & Rose, Citation2015) and Belgium (Van Cauwenberg et al., Citation2019).
Prominent amongst the barriers to e-biking were concerns about: cost, storage, fear of theft; and maneuverability difficulties caused by the greater size and weight of the bikes. These are consistent with findings across numerous countries (e.g., Bourne et al., Citation2020; Haustein & Møller, Citation2016b; MacArthur et al., Citation2014; Simsekoglu & Klöckner, Citation2019). Road conditions were found to be another strong deterrent to e-biking in the UK, a feature shared with the perceptions of e-cyclists in other low-cycling countries (e.g., Dill & Rose, Citation2012), contrasting with the observations of Fishman and Cherry (Citation2016) that e-bike sales were strongest in those countries which had removed infrastructure and safety barriers. Although some e-bike riders reported feeling more confident on main roads than they did on a conventional cycle, most of them used separate cycle infrastructure, where possible; poor design sometimes prevented this.
The findings around road conditions and infrastructure reflect similar findings from studies of conventional cycling (Hull & O’Holleran, Citation2014; Marqués et al., Citation2015). Countries and cities (particularly in Europe) with a strong cycling culture also tend to have better infrastructure (see for example: Pucher & Buelher, Citation2007; Haustein et al., Citation2020 ). The causal mechanisms are difficult to isolate but they appear to operate in both directions, i.e., better infrastructure helps to foster or strengthen local cycling cultures, which then provide greater political support for better infrastructure. The example of Seville shows how radical infrastructure interventions may transform that relationship, creating a new cycling culture where none existed previously (Marqués et al., Citation2015).
The survey found that e-bikes are becoming more widely used both for commuting and for work travel in the UK. Amongst the reasons for e-bike commuting chosen by respondents (in ) most imply a comparison with all other modes, e.g.: convenience, speed and predictability. However, the first and third choices, hill-climbing and reduced sweating, imply a comparison with conventional cycling. As shown in , those who always commute by e-bike were most likely to have used a conventional cycle as their main commute mode in the past. This, combined with the evidence above about reasons for purchase, suggests that at present e-bikes are making most progress amongst existing (or former) cyclists in the UK. However, those who mostly commute by e-bike were more likely to have used a car as their previous main commute mode, indicating that a degree of commute mode substitution from car to e-bike has occurred. This survey did not provide enough granularity to measure the degree of change. Future surveys could elucidate this by measuring the number of days that respondents commute by car, e-bike or other modes in a typical week. Previous research has shown mixing driving and cycling to work (using a conventional cycle) to be relatively common (e.g., Chatterjee et al., Citation2016). E-bikes may be moving these “modal-mixers” along a pathway from mostly driving to mostly cycling. Previous studies of e-bike trials in the UK and the Netherlands (Cairns et al., Citation2017; de Kruijf et al., 2017; Plazier et al., Citation2017) suggest considerable potential for commute mode shift from car-driving to e-bikes, but more incentives may be needed in the UK to realize this potential.
The responses on work-use also suggest that the potential of e-bikes has yet to be fully realized. In the vast majority of cases, employees took the initiative, particularly for travel to meetings and between employers’ locations. In Melia (Citation2016) individual managers, sometimes motivated by pro-environmental values, were the catalysts for a switch to e-biking amongst teams of mobile health professionals. It seems that few employers have yet promoted the idea in the UK, and there continues to be limited international evidence on the use of e-bikes for work (as distinct from commuting) purposes.
7. Conclusions
This article reports the findings of a large-scale survey of e-bike users in the UK, the first of its kind in the recent literature. It was conducted before the COVID-19 pandemic transformed the transport policy landscape in the UK, as in many other affected countries. In July 2020, following concerns about capacity reductions in public transport, the UK government published a “bold vision for cycling and walking” including additional funding for cycling infrastructure and a package of incentives to subsidize e-bikes (DfT, Citation2020c). It was accompanied by guidance, which aims to raise the standards of cycling infrastructure design (DfT, Citation2020a). By contrast, the transport decarbonization strategy, made no mention of e-bikes (DfT, Citation2020b). Recent research has shown how cycling, including e-biking, does substitute for car driving and can, therefore, contribute to decarbonization (Brand et al., Citation2021).
The findings of this study would support the view that e-bikes have potential, which has not yet been realized, to fulfill a wide range of transport needs. They support people with physical constraints to continue cycling; they enable people to cover longer distances, carry cargo and children, overcome hills and cope more easily with bad weather. Their use in the UK has been mainly amongst current or former riders of conventional bikes. The main challenge for transport policy will be to attract people who would not otherwise cycle to take up e-biking. These findings also suggest that governments could do more to promote e-biking for specific purposes, particularly for work travel, which is an undeveloped area. The delivery of freight and the transport of mobile workers within dense urban areas (following Melia, Citation2016) are both areas where e-bikes could assist national efforts to decarbonize transport.
As with conventional cycling, there is a gender gap in most countries, including the UK, which other studies have mainly ascribed to hostile conditions on the roads and the aggressive culture this has fostered (Aldred et al., Citation2016; Steinbach et al., Citation2011). This study found some evidence of greater concern about this amongst women but the gender differences were not as great as expected.
Many of the reasons constraining e-biking are similar to those constraining conventional cycling (plus the additional cost and related security concerns). Although some e-bike users were more prepared to ride in heavy traffic than they would on a conventional bike, heavy traffic remained a concern for many, and most commuters used separate cycle infrastructure where this was available. High quality cycle paths that can accommodate larger bicycles, tricycles and cargo-bikes are particularly important if the potential of e-bikes is to be realized. This implies that the success or failure of the UK government’s aspirations to improve conditions for cycling for people of all ages and capacities will also apply to the future of e-biking.
Acknowledgements
This study was undertaken as part of the REPLICATE project (Renaissance of Places with Innovative Citizenship and Technologies), funded from the European Union’s Horizon 2020 Research and Innovation Programme under grant agreement No. 691735. REPLICATE aims to deploy energy efficiency, mobility and ICT solutions in city districts.
Approval for the research was given by the Ethics Committee of the University of the West of England’s Faculty of the Environment and Technology, reference: UREC18.08.02.
References
- Aldred, R., Woodcock, J., & Goodman, A. (2016). Does more cycling mean more diversity in cycling? Transport Reviews, 36(1), 28–44. https://doi.org/10.1080/01441647.2015.1014451
- Beecham, R., & Wood, J. (2014). Exploring gendered cycling behaviours within a large-scale behavioural data-set. Transportation Planning and Technology, 37(1), 15–83. https://doi.org/10.1080/03081060.2013.844903
- Behrendt, F. (2018). Why cycling matters for electric mobility: towards diverse, active and sustainable e-mobilities. Mobilities. [online]. Routledge, pp. 64–80. https://doi.org/10.1080/17450101.2017.1335463
- Bourne, J. E., Cooper, A. R., Kelly, P., Kinnear, F. J., England, C., Leary, S., & Page, A. (2020). The impact of e-cycling on travel behaviour: A scoping review. Journal of Transport & Health, 19, 100910. https://doi.org/10.1016/j.jth.2020.100910
- Brand, C., Götschi, T., Dons, E., Gerike, R., Anaya-Boig, E., Avila-Palencia, I., de Nazelle, A., Gascon, M., Gaupp-Berghausen, M., Iacorossi, F., & Kahlmeier, S. (2021). The climate change mitigation impacts of active travel: Evidence from a longitudinal panel study in seven European cities. Global Environmental Change, 67, 102224.
- Cairns, S., Behrendt, F., Raffo, D., Beaumont, C., & Kiefer, C. (2017). Electrically-assisted bikes: Potential impacts on travel behaviour. Transportation Research Part A: Policy and Practice, 103, 327–342. https://doi.org/10.1016/j.tra.2017.03.007
- Chatterjee, K., Clark, B., & Bartle, C. (2016). Commute mode choice dynamics: Accounting for day-to-day variability in longer term change. European Journal of Transport and Infrastructure Research, 16(4), 713–734.
- de Kruijf, J., Ettema, D., Kamphuis, C. B. M., & Dijst, M. (2018). Evaluation of an incentive program to stimulate the shift from car commuting to e-cycling in the Netherlands. Journal of Transport & Health, 10, 74–83. https://doi.org/10.1016/j.jth.2018.06.003
- DfT. (2019a). National travel survey - Table NTS 0206 - Adult personal car access by gender: England, 1975/76 onwards. www.gov.uk UK Department for Transport. www.gov.uk.
- DfT. (2019b). National travel survey – Table NTS 0601 – Average number of trips (Trip Rates) by age, gender and main mode: England, from 2002. UK Department for Transport. www.gov.uk.
- DfT. (2020a). Cycle infrastructure design. Report number: Local Transport Note 1/20 Department for Transport.
- DfT. (2020b). Decarbonising transport – Setting the challenge. Department of Transport. www.gov.uk.
- DfT. (2020c). Gear change – A bold vision for walking and cycling. Department of Transport. www.gov.uk.
- Dill, J., & Rose, G. (2012). Electric bikes and transportation policy. Transportation Research Record: Journal of the Transportation Research Board, 2314(1), 1–6. https://doi.org/10.3141/2314-01
- Fishman, E., & Cherry, C. (2016). E-bikes in the mainstream: Reviewing a decade of research. Transport Reviews, 36(1), 72–91. https://doi.org/10.1080/01441647.2015.1069907
- Fyhri, A., & Fearnley, N. (2015). Effects of e-bikes on bicycle use and mode share. Transportation Research Part D: Transport and Environment, 36(Suppl. C), 45–52. https://doi.org/10.1016/j.trd.2015.02.005
- Fyhri, A., Heinen, E., Fearnley, N., & Sundfør, H. B. (2017). A push to cycling—Exploring the e-bike's role in overcoming barriers to bicycle use with a survey and an intervention study. International Journal of Sustainable Transportation, 11(9), 681–695. https://doi.org/10.1080/15568318.2017.1302526
- Haustein, S., Koglin, T., Nielsen, T. A. S., & Svensson, A. (2020). A comparison of cycling cultures in Stockholm and Copenhagen. International Journal of Sustainable Transportation, 14(4), 280–293. https://doi.org/10.1080/15568318.2018.1547463
- Haustein, S., & Møller, M. (2016a). Age and attitude: Changes in cycling patterns of different e-bike user segments. International Journal of Sustainable Transportation, 10(9), 836–846. https://doi.org/10.1080/15568318.2016.1162881
- Haustein, S., & Møller, M. (2016b). E-bike safety: Individual-level factors and incident characteristics. Journal of Transport & Health, 3(3), 386–394. https://doi.org/10.1016/j.jth.2016.07.001
- Hiselius, L. W., Svenssona, Ã. (2014). Could the increased use of e-bikes (pedelecs) in Sweden contribute to a more sustainable transport system? In Anon (2013). Proceedings of the International Conference on Environmental Engineering. ICEE [Online]. Vilnius, Gediminas Technical University, Department of Construction Economics.
- Hull, A., & O’Holleran, C. (2014). Bicycle infrastructure: can good design encourage cycling? Urban, Planning and Transport Research, 2(1), 369–406. https://doi.org/10.1080/21650020.2014.955210
- Johnson, M., & Rose, G. (2015). Extending life on the bike: Electric bike use by older Australians. Journal of Transport & Health, 2(2), 276–283. https://doi.org/10.1016/j.jth.2015.03.001
- Johnson, M., Rose, G. (2013). Electric bikes–cycling in the New World City: an investigation of Australian electric bicycle owners and the decision making process for purchase. In Anon (2013). Proceedings of the 2013 Australasian Transport Research Forum.
- Kroesen, M. (2017). To what extent do e-bikes substitute travel by other modes? Evidence from the Netherlands. Transportation Research Part D: Transport and Environment, 53, 377–387. https://doi.org/10.1016/j.trd.2017.04.036
- Leger, S. J., Dean, J. L., Edge, S., & Casello, J. M. (2019). If I had a regular bicycle, I wouldn’t be out riding anymore”: Perspectives on the potential of e-bikes to support active living and independent mobility among older adults in Waterloo. Transportation Research Part A: Policy and Practice, 123, 240–254. https://doi.org/10.1016/j.tra.2018.10.009
- Lin, X., Wells, P., & Sovacool, B. K. (2018). The death of a transport regime? The future of electric bicycles and transportation pathways for sustainable mobility in China. Technological Forecasting and Social Change, 132, 255–267. https://doi.org/10.1016/j.techfore.2018.02.008
- Ling, Z., Cherry, C. R., MacArthur, J. H., & Weinert, J. X. (2017). Differences of Cycling Experiences and Perceptions between E-Bike and Bicycle Users in the United States. Sustainability, 9(9), 1662. https://doi.org/10.3390/su9091662
- MacArthur, J., Dill, J., & Person, M. (2014). Electric bikes in North America. Transportation Research Record: Journal of the Transportation Research Board, 2468(1), 123–130. https://doi.org/10.3141/2468-14
- MacArthur, J., Harpool, M., Scheppke, D., & Cherry, C. (2018). Electric boost: Insights from a national e-bike owner survey. National Institute for Transportation and Communities.
- Marqués, R., Hernández-Herrador, V., Calvo-Salazar, M., & García-Cebrián, J. A. (2015). How infrastructure can promote cycling in cities: Lessons from Seville. Research in Transportation Economics, 53, 31–44. https://doi.org/10.1016/j.retrec.2015.10.017
- Melia, S. (2016). Sustainable travel and team dynamics among mobile health professionals. International Journal of Sustainable Transportation, 10(2), 131–138. https://doi.org/10.1080/15568318.2013.869705
- Mordor Intelligence. (2020). Sample industry report: E-bike market 2020–2025. Unpublished.
- NU.nl. (2020). Recordaantal e-bikes Verkocht in 2019, Weer Meest Verkochte Fiets. Retrieved 2020 June 17 from https://www.nu.nl/auto/6033890/recordaantal-e-bikes-verkocht-in-2019-weer-meest-verkochte-fiets.html.
- ONS. (2020). UK Population Estimates Mid-2019. Retrieved 2021 January from https://www.ons.gov.uk/peoplepopulationandcommunity/populationandmigration/populationestimates/datasets/lowersuperoutputareamidyearpopulationestimates [Accessed January 2021].
- Plazier, P. A., Weitkamp, G., & van den Berg, A. E. (2017). Cycling was never so easy!” An analysis of e-bike commuters' motives, travel behaviour and experiences using GPS-tracking and interviews. Journal of Transport Geography, 65, 25–34. https://doi.org/10.1016/j.jtrangeo.2017.09.017
- Plazier, P. A., Weitkamp, G., & Van Den Berg, A. E. (2018). Exploring the Adoption of e-bikes by different user groups. Frontiers in Built Environment, 4. https://doi.org/10.3389/fbuil.2018.00047
- Pucher, J., & Buelher, R. (2007). At the Frontiers of Cycling: Policy Innovations in the Netherlands, Denmark and Germany. World Transport Policy & Practice, 13(13), 8–56.
- Riggs, W., & Schwartz, J. (2018). The impact of cargo bikes on the travel patterns of women. Urban, Planning and Transport Research, 6(1), 95–110. https://doi.org/10.1080/21650020.2018.1553628
- Salmeron-Manzano, E., & Manzano-Agugliaro, F. (2018). The electric bicycle: Worldwide research trends. Energies, 11(7), 1894. https://doi.org/10.3390/en11071894
- Simsekoglu, Ö., & Klöckner, C. (2019). Factors related to the intention to buy an e-bike: A survey study from Norway. Transportation Research Part F: Traffic Psychology and Behaviour, 60, 573–581. https://doi.org/10.1016/j.trf.2018.11.008
- Steinbach, R., Green, J., Datta, J., & Edwards, P. (2011). Cycling and the city: A case study of how gendered, ethnic and class identities can shape healthy transport choices. Social Science & Medicine (1982), 72(7), 1123–1130. https://doi.org/10.1016/j.socscimed.2011.01.033
- Van Cauwenberg, J., De Bourdeaudhuij, I., Clarys, P., de Geus, B., & Deforche, B. (2018). E-bikes among older adults: benefits, disadvantages, usage and crash characteristics. Transportation, [online]. 46, pp. 2151–2172. https://doi.org/10.1007/s11116-018-9919-y.
- Wolf, A., & Seebauer, S. (2014). Technology adoption of electric bicycles: A survey among early adopters. Transportation Research Part A: Policy and Practice, 69, 196–211. https://doi.org/10.1016/j.tra.2014.08.007
- Zuev, D., Tyfield, D., & Urry, J. (2019). Where is the politics? E-bike mobility in urban China and civilizational government. Environmental Innovation and Societal Transitions, 30, 19–32. https://doi.org/10.1016/j.eist.2018.07.002