
 ?Mathematical formulae have been encoded as MathML and are displayed in this HTML version using MathJax in order to improve their display. Uncheck the box to turn MathJax off. This feature requires Javascript. Click on a formula to zoom.
Abstract
Motorized traffic discourages cycling, but the relative influence of different aspects of traffic intensity on commuter cycling rates is under examined. This paper investigates these influences. It employs census data that describes the origins, destinations and mode choices of commuters traveling 2–5 km in Surrey, UK (n = 172,665) and derives the shortest cycling route available for each commuter. Observed and modeled transport data are used to characterize traffic on these routes. The relationship between route-level traffic characteristics and the probability a commuter chooses to cycle is then examined using logit models for all commuters, males (42%) and females (58%). Two models consider the following aspects of traffic intensity both along the cycling route and crossing (intersecting) the route at junctions: speed, volume and the proportion of heavy goods vehicles. The models also consider the influence of separated cycle paths, hilliness and distance. Above-median traffic speeds (>29 km/h) along a commuting route is shown to have the greatest negative influence on cycling propensity, followed by above-median traffic volumes (>273 veh/h) and above-median speeds (in combination) crossing the commuting route. Cycle paths have a positive influence on cycling propensity, whereas the proportion of heavy goods vehicles does not show a significant relationship. The results imply that careful management of traffic at the route scale or the provision of separated cycle paths could encourage cycling on key commuting corridors. The relative influence of different characteristics could also identify the optimal locations for intervention. Findings support 30 km/h (20 mph) speed limits as a mechanism for encouraging cycling.
Keywords:
1. Introduction
A wide body of international literature explores the individual, social and physical environment factors that influence cycling behaviors (Buehler & Dill, Citation2016; Forsyth & Krizek, Citation2010; Fraser & Lock, Citation2011; Heinen et al., Citation2010; Willis et al., Citation2015). Within this literature, motorized traffic is consistently found to discourage cycling. Motorized traffic presents direct health risks to cyclists through traffic collisions and air pollution (Götschi et al., Citation2016). Given the net health benefits of cycling, motorized traffic also harms population health indirectly by deterring cycling (Jacobsen et al., Citation2009; Mueller et al., Citation2015; Oja et al., Citation2011).
Motorized traffic is by no means the only factor discouraging cycling – a lack of protection from the weather, the need to travel with groceries or children, difficulties storing bicycles, the physical effort associate with distance or hilliness, a lack of the necessary skills, knowledge and equipment, concerns about personal safety and perceived (non-cycling) social norms are all notable reasons for not cycling (Heinen et al., Citation2010). However, despite the evidence highlighting the important influence of motorized traffic on cycling behaviors, and in contrast to the comprehensive research on cycling infrastructure networks that protect cyclists from it, there is not a consistent understanding as to which aspects of motorized traffic deter cycling. High speeds, high volumes and a high ratio of heavy goods vehicles (HGVs – vehicles over 3,500 kg) are all stated dislikes of potential cyclists (Hunt & Abraham, Citation2007), but their separate influence on revealed behaviors is under examined. Similarly, it is not clear if the effect of these characteristics differs depending on whether traffic moves parallel to the cyclist’s direction of travel or crosses it at junctions.
This paper seeks to understand how different traffic characteristics on likely routes to work influence the probability that a commuter is a cyclist. It derives the shortest path for commuters who work 2–5 km from home (n = 172,665) within the county of Surrey, England, and then examines how the traffic characteristics of this route are associated with the decision to commute by bicycle. A 2–5 km Euclidian distance banding is consistent with the UK census methodology (ONS, Citation2014a). The 2 km lower bound excludes some cyclists, but also reduces the potential for the analysis to be confounded by factors which influence walking behaviors.
A better understanding of how different traffic characteristics at the network scale influence cycling propensity (the probability an individual chooses to travel by bicycle, or for a population, the proportion that chooses to travel by bicycle), would help identify policies and interventions that are likely to be most effective at encouraging cycling as well as indicating where interventions should be targeted. Ultimately, this could help reduce some of the indirect and health-limiting effects of traffic on population health.
2. Background
In line with international studies, motorized traffic is shown to be a major deterrent to cycling in the UK: it prevents non-cyclists from starting to cycle (Davies et al., Citation1997); it is the foremost negative aspect of cycling for those who have just started (Gatersleben & Appleton, Citation2007); existing cyclists plan their routes to avoid it (Steer Davies Gleave & TfL, 2012) and aggregate analyses suggest that higher traffic densities suppress local cycling rates (Grudgings et al., Citation2018; Parkin et al., 2008). Despite this, the literature linking aspects of traffic intensity to cycling behaviors is somewhat “inchoate and poorly organized” (Jacobsen et al., Citation2009, p. 369).
2.1. Methods for examining the influence of traffic
Traffic’s influence on cycling mode choice is often examined indirectly in terms of risk perceptions or infrastructure preferences. Surveys, focus groups, interviews and stated preference studies can examine the influence of traffic along links and at junctions, but are limited by the number of scenarios that can be considered and the challenge in communicating these between researchers and participants (Broach, Dill, & Gliebe, Citation2012). The use of virtual reality and video may offset some of the communication challenge (Hughes & Harkey, Citation1997; Parkin et al., Citation2007), but it is difficult to capture the visceral impact of traffic in simulated environments. Conversely, aggregate analyses of cycling reflect the revealed or actual impact of traffic, but use geographical areas as the unit of analysis which makes it difficult to examine traffic’s specific influence at the link and junction scale. Consequently, the relative influence of different traffic characteristics on cycling behaviors has predominantly been analyzed using revealed route preference (RRP) studies. These assume that cyclists choose their route through a process of utility optimization, and that the chosen route is the one which offers the highest net utility. Whilst route choices are different from the mode choices of interest here, both are examined using this utility maximization framework. The total utility of the optimal route to work on a bicycle is directly related to the utility of the bicycle as a commuting mode choice. RRP study findings on the influence of physical environment factors, including traffic, on cycling route utility are therefore helpful in understanding the influence of these factors on cycling mode utility.
2.2. Findings from analyses of RRPs
RRP studies of cycling show that cyclists prefer shorter distances, shorter journey times, gentler slopes and fewer junctions (Broach et al., Citation2012; Casello & Usyukov, Citation2014; Hood et al., Citation2011; Misra & Watkins, Citation2018; Zimmermann et al., Citation2017). Routes or route segments with cycling infrastructure are also preferred over routes without (Broach et al., Citation2012; Misra & Watkins, Citation2018; Prato et al., Citation2018; Zimmermann et al., Citation2017). Cole-Hunter et al. (Citation2015) highlighted that wider environmental factors such as greenness, air pollution and noise may also impact cycling behaviors and should be considered, alongside information on competing modes. These factors are less commonly considered in RRP analyses, but there is an emerging indication that cyclists may prefer to ride routes in more scenic, green or aquatic areas when possible (Krenn et al., Citation2014; Prato et al., Citation2018).
Traffic is a common disutility identified in RRP studies. Their high spatial resolution means the influence of different aspects of motorized traffic can be explored in more detail than aggregate analyses. Findings suggest that vehicle volumes along a cyclist’s path have a greater influence on cycling behaviors than vehicle volumes across a cyclist’s path at junctions (Broach et al., Citation2012; Grond, Citation2016). Broach et al. (Citation2012) estimated that a cyclist would detour by 23.1% to avoid a turn across high volume traffic, but by 140.0% to avoid traveling along roads with high volume traffic. The composition of the traffic, measured by the percentage of HGVs, does not appear to influence route choices (Misra & Watkins, Citation2017). This is surprising given that the proportion of HGVs is a prominent factor in stated preference studies and bicycle level of service calculations (Hunt & Abraham, Citation2007; Noël et al., Citation2003). Where RRP studies have included a measure for vehicle speeds, they often employ proxy indicators such as speed limits and road hierarchies. In most of these, higher speed limits appear to reduce utility and thereby deter cycling (Casello & Usyukov, Citation2014 – Model 2; Chen et al., Citation2018; Jestico et al., Citation2016; Misra & Watkins, Citation2017). However, speed limit variables are also occasionally removed due to multi-collinearity issues (Casello & Usyukov, Citation2014 – Model 1; Khatri et al., Citation2016) or found to be insignificant (Hood et al., Citation2011; Prato et al., Citation2018). The disutility of higher vehicle speeds has also been identified in other study formats: an analysis of cycle counters in the US found that speed had a negative association with cycling numbers and was more influential than vehicle volumes (Fagnant & Kockelman, Citation2016).
Multi-collinearity and theoretically inconsistent signs are common challenges in RRP studies. For example, Hood et al. (Citation2011) and Jensen et al. (Citation2019) both removed traffic volume from their models as it had a positive sign, implying cyclists preferred higher volume routes. Casello and Usyukov (Citation2014) found speed and cycling infrastructure to be highly correlated and consequently developed two separate models, one of which had a positive sign for traffic volume. Similarly, Grond (Citation2016) found road hierarchies to be collinear with traffic volumes and removed both of them from the analysis. These collinearity complications are a possible explanation for the remaining gap in the understanding of the relative importance of traffic speed and volume. Of the analyses that have included measures for traffic speed and volume, Prato et al. (Citation2018) found both to be insignificant. Casello and Usyukov (Citation2014) found that speed had a negative influence on cycling utility whereas volume had a positive influence, and Misra and Watkins (Citation2017) found that both had a negative influence. Using a measure of traffic speed that is independent of road hierarchies and speed limits might reduce multi-collinearity and clarify the relative influence of traffic speed in relation to traffic volume. A full summary of findings from RRP studies is provided in the Supplementary Material (). For further details on RRP study methodologies, see Pritchard (Citation2018).
Table 1. Independent variables detailing traffic conditions, hilliness delay and network distances for the shortest paths of commuters in Surrey.
2.3. Moving from route preference to mode choice
To examine the influence of route-level traffic characteristics on mode choices, rather than route choices, it is necessary to replace the revealed routes of cyclists with a supposed or likely route that any given commuter would choose were they to cycle (Dalton et al., Citation2015). Badland et al. (Citation2008), Cole-Hunter et al. (Citation2015) and Winters et al. (Citation2010) all adopt this approach to examine how conditions along or near to the shortest path influence active commuting behaviors. Badland et al. (Citation2008) found that street connectivity and distance affected active commuting mode choices. Cole-Hunter et al. (Citation2015) and Winters et al. (Citation2010) included additional socio-demographic factors and descriptors of the area around commuters’ origins and destinations, including greenery and air pollution. Winters et al. (Citation2010) found that many of the factors determining route choice are consistent with those determining the decision to cycle: cycling infrastructure, traffic calming, fewer highways and arterial roads near to the shortest path and higher intersection densities were all associated with a higher likelihood of choosing to cycle. They also noted that the route-level factors were a primary consideration in decisions to cycle or drive to work, rather than origin, destination or socio-demographic factors. Conversely, Cole-Hunter et al. (Citation2015) found origin and destination descriptors to be of notable importance to mode choice decisions, with greenness and the availability of cycle-rental stations having a positive association with cycling, and public transport and elevation changes having a negative association. Both Badland et al. (Citation2008) and Winters et al. (Citation2010) collated route characteristics using set buffers around the shortest path of 100 and 250 m, respectively. This accounts for the imprecision of estimating actual routes with the shortest path, but the selection of different buffers may change the direction, strength and significance of the identified determinants (Sarjala, Citation2019). Cole-Hunter et al. (Citation2015) used an alternative approach, deriving route characteristics using the smallest rectangle capable of enclosing the shortest path.
This analysis uses the shortest path available to a cyclist, observing traffic rules, to estimate their likely route to work – no revealed routes are observed. The shortest path may differ from the actual route of a cycling commuter, but there is a generalized cost associated with this. Detours from the shortest path to avoid traffic conditions have a logically consistent effect in that they would also act to decrease overall route utility by increasing journey length. Earlier studies have found that there is a significant degree of overlap between shortest routes and actual routes (, Leao et al., Citation2017; Rupi & Schweizer, Citation2018). The degree of overlap is also higher for repeated trips such as commuting, and commuters appear to be less willing to deviate from the shortest path compared to cyclists making other utilitarian trips (Bernardi et al., Citation2018; Broach et al., Citation2012).
3. Data and methods
3.1. Sample population data
The analysis is conducted for the county of Surrey, located in the South East of England. It covers 1,700 km2 and contains 1.1 million inhabitants, including two large towns (population over 60,000) and seven smaller towns (population over 25,000). The 2011 census data for the UK provides data on Surrey’s commuting population (ONS, Citation2014b). It describes the mode choice, sex (male/female) and home and work locations for all commuters within Surrey. Mode choice is determined by an individual’s response to the multiple-choice census question ‘how do you usually travel to work?’. The home and work locations are recorded in the form of Lower layer Super Output Areas (LSOAs), small areal units used for statistical analysis which have similar populations around a mean of 1,614 residents.
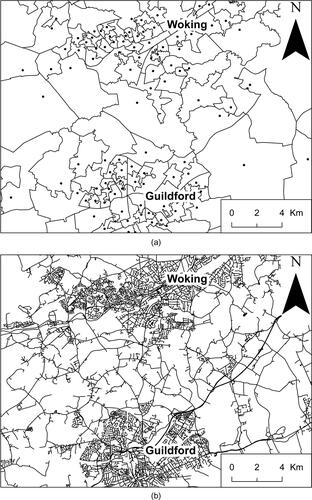
Commuters were included in the analysis if they live and work within 5 km of the border of Surrey County Council, and if their journey to work was between 2 and 5 km. These are Euclidean distances between LSOA population-weighted centroids, corresponding to network distances of between 2.9 and 7 km (5th–95th percentiles). This distance band excludes short distances where commuters are more likely to walk (Wakenshaw & Bunn, Citation2015), and longer distances where cycling is exceptional (Grudgings et al., Citation2018). illustrates the LSOA zoning system and its associated population-weighted centroids.
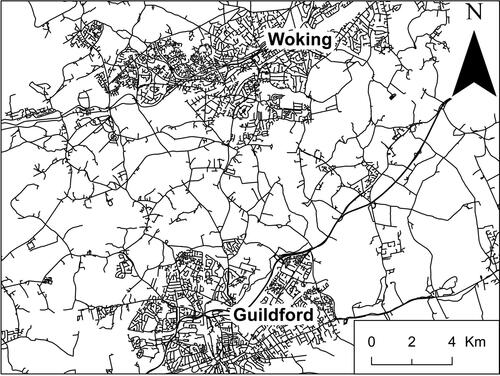
Figure 1. (a) The LSOA zoning system and population centroids used in this analysis, shown for Woking and Guildford. (b) The road and cycle network used in this analysis, shown for Woking and Guildford.
The resulting sample population comprises 172,665 commuters – 72,188 males (42%) and 100,477 females (58%). Females are over-represented as they are more likely to work closer to home than men (ONS, Citation2021). About 8,488 commuters identified the bicycle as their usual mode for traveling to work – 6,160 males and 2,328 females. This is in line with male and female cycling rates across the UK in this distance band. These commuters live and work across 1,565 LSOAs within Surrey and there are 33,532 origin-destination pairs that have at least one commuter traveling between them.
3.2. Network data and independent variables
A network dataset of relational links and nodes was used to represent the road and cycle networks (Ordnance Survey, Citation2011, Citation2016). shows an illustrative example of these networks for Surrey’s two largest towns – Woking and Guildford. To estimate slope characteristics, the network datasets were combined with a digital elevation model (Ordnance Survey, 2018). Traffic speed data describing the time taken for a vehicle to traverse any link on the network in 2011 was obtained from TrafficMaster, a commercial traffic dataset paid for by the UK Government’s Department for Transport (Basemap, Citation2018). Motor vehicle and HGV counts for links were obtained directly from Surrey County Council’s traffic model (SINTRAM), using a base year of 2014 – the closest available year to the 2011 census year. All traffic data is estimated for a weekday between 7 am and 9 am. Further details of the network data and associated processing are provided in the Supplementary Material, . The use of open source datasets such as OpenStreetMap (OSM, Citation2019) was not considered as the vehicle speed and count datasets are not currently interoperable with such open source network data.
Table 2. Results from the first model of traffic influences without interaction effects.
3.3. Calculation of the shortest path
The shortest path for each origin-destination pair was found with Dijkstra’s (Citation1959) algorithm, using the ArcGIS Network Analyst tool. The algorithm requires a weighted graph, where the edges are road links and the nodes are junctions. Only links that are legally accessible by bicycle were included. The weight used was the time taken to traverse each link, assuming a constant cycling speed of 6.01 m/s (Parkin & Rotheram, Citation2010). The network was coded in such a way that each turn greater than 60° incurred a further 5 sec cost. The algorithm also requires origin and destination nodes, for which the model uses the closest point on the network to the population-weighted centroid of every commuter’s home and work LSOA.
Whilst a typical commuter will make two distinct journeys per day, the focus of this study is on the average effect of the traffic on a commuter’s route. As such each route was calculated in one direction only, from home to work during the morning commute where the traffic peak was likely to be more influential (the morning traffic peak is more condensed and has greater traffic intensity than the afternoon peak). Differences between left vs. right turns are not considered and the influence of hilliness was calculated as an average in both directions for each link. Small inconsistencies may have arisen due to the presence of one-way systems and other network restrictions (Yeboah, Citation2015), but these are likely to be randomly distributed across a large sample population and effects are expected to be negligible.
3.4. Effect of distance and hilliness
Hills and short distances have significant effects on cycling propensity (Lovelace et al., Citation2017; Parkin et al., 2008). Whilst the analysis is focused on the influence of traffic characteristics, results are likely to be more precise if the effect of both hilliness and distance is accounted for. A network distance measure and a hilliness delay are therefore included for each origin–destination pair. The hilliness delay was calculated by comparing the time taken for a cyclist to traverse a link with slope effects (an average of the time taken in each direction), to the time taken for a cyclist to traverse an equivalent distance without slope effects. The slope-sensitive times were calculated using revealed cycling speed factors from Parkin and Rotheram (Citation2010).
3.5. Classifying traffic volumes and speeds along and across the shortest path
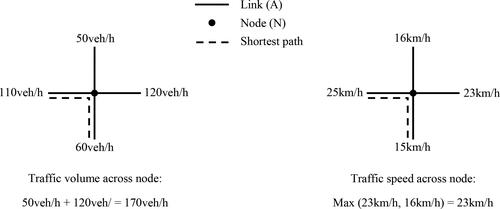
Traffic data used in this study provides estimates of vehicle counts, speeds and composition (HGV or car/motorbike) on network links. Traffic data for nodes is derived from this link-level data. The volume of traffic across a node is defined as the sum of traffic volumes on all links connected to it, excluding those that belong to the shortest path (see EquationEquation (1)
(1)
(1) and ). Similarly, traffic speeds across a node are defined as the maximum speed of any link connected to the node, excluding those that belong to the shortest path (see EquationEquation (2)
(2)
(2) and ). For a network of nodes
and links
which have both volume
and speed parameters
(1)
(1)
(2)
(2)
Figure 2. Diagram of traffic interaction calculations at nodes (veh/h: vehicles per hour).
3.6. Conversion of route characteristics into independent variables
In this analysis, the traffic speed, volume and composition characteristics of each link were classified as either above or below the median value for all links in Surrey’s road network dataset (29 km/h). Motorways and other roads where cyclists cannot legally ride were excluded and traffic speeds were derived from GPS measured (actual) speeds. The independent variables describing the traffic characteristics of a commuter’s shortest path were then calculated as the percentage of each route, by distance, that had above-average traffic speeds, volumes and HGV rates. The same process was undertaken for the traffic characteristics across a route for nodes. The average segment length between nodes describes the relative frequency of nodes on a route, representing lateral conflict from side roads and junctions. The design of the independent variables in this way limits correlation effects that could occur between, for example, node counts and route distances. Variables are centered and standardized before inclusion in the model. As such, the odds ratio reported for the intercept of each model is the odds of cycling occurring for that population group.
The independent variables describing the shortest paths are set out in . Since the concepts of ‘busy’, ‘fast’ and ‘high’ HGV volumes are subjective, median values are used to categorize aspects of traffic intensity for links and nodes. A ‘fast’ link or node is one which has traffic speeds above the median for the entire network (29.3 or 21.4 km/h, respectively). The ‘along fast’ variable, in turn, describes the proportion of a route’s length made up of these fast links. The combined traffic scenario variables describe the proportion of a route where two traffic conditions, such as above-average speeds and above-average volumes are present.
3.7. Statistical model
Each commuter is assumed to make an informed decision whether to cycle to work based on the utility offered to them on the shortest path to work. Since there are observed and unobserved aspects to utility, a binary logit model estimates the probability that the utility of cycling is greater than the utility of commuting by any other mode for each commuter. The probability that a commuter cycles, is informed by the sum utility of the route characteristics, as described by variables
and their coefficients
(3)
(3)
Model input data is split into three sample populations: all commuters, male commuters and female commuters. Between-group comparisons are challenging with logit models since differences in variance between populations are accounted for by the collective scaling of coefficients (Long, Citation2009). Accordingly, it is not clear whether a larger coefficient value is due to a greater importance of that determinant for that population, or a lower level of variance in that population’s behavior. Cross-group comparisons are instead undertaken using coefficient rankings within each group.
The model is fitted using maximum likelihood and its predictive power is described using a McFadden R2 (Domencich & McFadden, Citation1975). This pseudo R2 is the preferred measure of fit for logistic regression models (Allison, Citation2014) and describes the log-likelihood ratio between the model with all independent variables, and its intercept-only equivalent. Given the small number of commuters per route (a high spatial granularity) the pseudo R2 is expected to be low, but the focus of the analysis is on the relative importance of traffic characteristics for the population, rather than the prediction of cycling propensity for each individual. A relogit model was also considered, but this offered no greater explanatory power and coefficient estimations remained unchanged.
3.8. Handling collinearity
High levels of collinearity between traffic speeds and volumes may be an issue when estimating coefficients. Two models will therefore be used in the analysis. The first will examine traffic influences without interaction effects. The second will examine the combined influence of multiple traffic scenarios, such as the percentage of a route with both above-average speeds and above-average volumes.
4. Results
4.1. First model – traffic influences without interaction effects
The coefficients associated with the model variables, henceforth determinants, are of the expected sign based on the literature, apart from ‘Along busy’ (the proportion of a route with above-average traffic volumes), which was found to be positive but insignificant. Hill cost was found to have the largest influence on mode-choice decisions across all sample populations. For the traffic variables, above-average speed along roads (Along fast) is seen to have the greatest influence for all populations, and its effect is particularly large for female commuters – as shown in , where the coefficient is ranked higher for female commuters. At junctions, above-average traffic volumes (Across busy) have a greater impact than above-average traffic speeds (Across fast) for male commuters but for female commuters traffic volumes and speeds at junctions have a comparable effect. Distance is negatively associated with cycling mode choice and cycle paths are positively associated with cycling mode choice for all populations. The average segment length between junctions is found to be insignificant, as are higher than average HGV ratios along roads and across junctions. Full model results are detailed in .
When modeling all commuters, the maximum pairwise correlation between variables is 55% and variable inflation factors (VIFs) are all below 2, with an average of 1.5, indicating that collinearity should not be an issue when interpreting results. The predictive performance of the model is low, with a McFadden R2 of 0.04, 0.03 and 0.05 for the all, male and female commuter sample populations, respectively.
4.2. Second model – combined traffic scenarios
When interactions are considered, statistically significant determinants are again of the expected signs. Above-average speeds along the shortest path are found to be important regardless of volumes (Along busy and fast, Along quiet and fast), whereas slow moving and high volume traffic has little influence (Along busy and slow). At junctions, above-average volumes and speeds are only significant in combination (Along busy and fast), in contrast to the first model. HGV ratios and average segment lengths are mostly insignificant across models and the time cost of hills is again the most important determinant overall. Cycle paths have a positive impact on mode choice decisions for male commuters, but are not found to be significant for female commuters. Full results are given in .
Table 3. Results from the second model of combined traffic scenarios.
When modeling all commuters, the maximum pairwise correlation is 56%. VIFs are higher in this second iteration, as was expected, but are still below 4 and within the tolerance limits suggested by Dormann et al. (2013). The predictive performance of the model is again low (McFadden R2s of 0.04, 0.03 and 0.06 respectively).
5. Discussion
Different traffic characteristics do not act equally to deter commuters from cycling to work. Above-average vehicle speeds alongside a cyclist’s likely path have the most pronounced, detrimental influence on cycling mode choice. This is consistent with virtual reality assessments of risk perception and cross-sectional analysis of cyclist counts (Fagnant & Kockelman, Citation2016; Hughes & Harkey, Citation1997). The effect is consistent regardless of traffic volumes. The models did not suffer from multi-collinearity issues, illustrated by low VIFs, and perhaps due to the use of independent traffic data. Direct speed estimations are likely to be particularly relevant for studies of commuters, who travel at peak-hours when actual traffic speeds may be notably less than posted speed limits. Whilst the cutoff of 29 km/h used in this study was not ‘chosen’ (it is the median value in the dataset), it is directly comparable with the 30 km/h or 20 mph speed limits often implemented to reduce casualties and increase walking and cycling levels. The analysis shows that where a given commuter's shortest route to work has a greater proportion of the route with traffic speeds under 29.3 km/h, the commuter is more likely to be a cyclist. It therefore provides supporting evidence toward the view that speed limits under 30 km/h might encourage more transport cycling (Mertens et al., Citation2017).
The influence of vehicle speeds and volumes is dependent on the location at which vehicles are encountered. High speed traffic across a commuter’s likely path has little influence on mode choice unless it is also high in volume, in which case it then acts as a significant deterrent to cycling. Fast and busy roads, such as arterial routes, may act as barriers to cycling even if a cyclist would not need to travel along them. This corresponds with findings from RRP studies – congested intersections lower route utility (Jensen et al., Citation2019). Cycling infrastructure should therefore not only be described as a singular quantity in an area, but also more holistically at a route and network level in terms of connectivity and traffic-stress levels experienced throughout the journey (Lowry, Furth, & Hadden-Loh, Citation2016). The results presented here could inform or validate the relative magnitude of variables used in such traffic-stress calculations, which often rely on stated preferences. There are also population-specific, qualitative differences to these preferences. Above-average traffic speeds are of greater (relative) importance for female commuters than male commuters, as shown by their rankings in .
Traffic volumes along roads have much less influence on cycling mode choices than might be expected. When examined independently, they have a notionally positive but insignificant influence across all population groups. A positive correlation between route choices and volume was identified by Hood et al. (Citation2011) and Casello and Usyukov (Citation2014), although later rejected by both as counter-intuitive. The small positive correlation between traffic volumes and cycling mode choice may be indicative of other effects not included in the model, such as perceived safety benefits from better lighting or the presence of other people, wider roadways and pavements. It may even be a reflection of the enjoyable sensation experienced by cyclists as they pass stationary traffic – motivating those commuters concerned with arriving at work on time and providing reaffirmation they have made the right choice by cycling (Gatersleben & Appleton, Citation2007).
There are few separated cycle paths along key commuting corridors in Surrey (). Nonetheless, the findings show that a commuter is more likely to travel by bicycle if their shortest route to work has a greater proportion of separated cycle paths. Cycle paths, in the right location, are likely to increase cycling rates.
The insignificant influence of the proportion of larger vehicles (HGVs) along a cycling route is a surprising result, although similar to the route-preference findings of Misra and Watkins (Citation2017). HGVs are of most concern when turning across cycling paths or a cyclist’s direction of travel. This concern was examined in the models (across high HGV ratios, ). Whilst the signs were in the expected direction, the effects were either not statistically significant (all commuters, female commuters), or just significant but of low importance (male commuters). It is possible that commuters are not sensitive to HGV ratios when considering their mode choices. Alternatively changes in HGV ratios examined in this study may be too small to influence cycling behaviors or, given that signs are of the expected direction, the models may not be powerful enough to detect a potentially weaker effect.
Higher speeds increase the risk of injury in collisions between cyclists and motor vehicles, and most of these collisions occur at junctions (ROSPA, Citation2017). The model identifies vehicle speeds and traffic at junctions as important characteristics influencing mode choice, suggesting that the perceived utility benefits at the route level correspond to the risks faced by cyclists, although our definition of across traffic may not be related to actual junction risk. This makes the lack of evidence around the influence of HGVs more concerning. Vehicles over 3.5 tonnes account for a disproportionate amount of cycling deaths in London (Morgan et al., Citation2010). It is possible that the risks posed by HGVs are not being recognized by commuters as clearly as the risks from fast traffic along their route or fast and busy traffic across it.
5.1. Model limitations
The key limitation of this analysis is the use of the shortest path as a proxy for the actual routes to work chosen by commuters. It is likely that shortest path routes include ‘low-utility’ links and nodes that cyclists might avoid on their actual route. However, any detour has a logically consistent effect as using a low-utility link. Detours reduce the overall utility of the route by adding to the total distance, time and effort required for the journey and are only undertaken to avoid something with a greater impact on utility – such as traffic. For individuals, the models have a low predictive power and there is clear room for improvement. Likely sources of error or uncertainty, beyond those from using the shortest path as an estimated route, may arise from:
Imprecise knowledge about where a commuter starts and ends their journey within an LSOA.
The potential confounding of factors which may discourage cycling but encourage other modes such as driving (e.g. high average speeds along the shortest path to work).
Omitted information on the key attributes of competing modes, such as the availability and price of public transport alternatives. Whilst an assumption of homogeneity of non-cycling modes is relatively fair (for journeys of 2–5 km, approximately 80% of commuters in Surrey travel by car, 10% by train or bus ONS, Citation2014a, Citation2014b), the public transport options may not be randomly distributed and therefore could confound the analysis if they are provided along key cycling corridors.
A lack of non-route factors that influence decisions to cycle. In particular, because the census is anonymized, the analysis lacks additional information on the individuals making these journeys. This includes determinants of cycling identified in other studies, such as age, family status, income, occupation, education, beliefs, attitudes, habits and social environment.
The use of different time-frames for the traffic data. Data on vehicle counts was from 2009, whereas all other data was from 2011. Given that road use trends were relatively flat between 2009 and 2011 (DfT, Citation2016), this was not considered to be a significant source of error
Finally, whilst the model has focused on the primary physical characteristics of vehicle flows, it has not explored associated characteristics such as noise and air pollution levels. These were unavailable at the route level in Surrey, but have been used in comparable analyses (Cole-Hunter et al., Citation2015; Winters et al., Citation2010). Routes to work with quiet traffic in clean air (a plausible reality in countries with a high adoption of electric vehicles) may have a notably different impact on cycling propensity compared to routes with noisy traffic in polluted areas, even where physical traffic characteristics such as speeds and volumes remain the same.
5.2. Future opportunities for research
Future research may wish to consider an iterative approach, using the initial output of traffic, distance and hilliness coefficients to derive a cost function that maximizes route utility. This would, in turn, be used to estimate the next set of commuter routes and coefficients. It may improve the predictive power of the models considerably and would increase the confidence in the estimations of the relative importance of different traffic characteristics. Such an analysis could also include the key attributes of competing modes (Cole-Hunter et al., Citation2015) and support the creation of a generalized utility function that allows cycling to be included in regional traffic and transport models (Casello & Usyukov, Citation2014).
Previous researchers have noted the lack of literature available on methods for locating cycling infrastructure at the network level (Larsen et al., Citation2013). The work presented here could be applied to identify how much each segment of the road network deters cycling: a crossover between bicycle stress analyses and demand led infrastructure provision models specific to the road network (Lovelace et al., Citation2017; Moran et al., Citation2018). Such an approach would also present an alternative to the use of crowdsourced cycling data for optimizing the location of cycling infrastructure. By considering the potential cycling routes of non-cyclists, this analysis avoids reinforcing existing biases from those who already cycle to work or who are keen leisure cyclists.
6. Conclusions and policy implications
Above-average traffic speeds along the cycling route are shown to be the dominant traffic-related factor deterring commuters from cycling to work. Above-average traffic volumes in combination with above-average traffic speeds across the route also act as a noticeable deterrent. Future model developments may wish to consider the problem iteratively and work toward integrating route choice and mode choice.
The results suggest that 30 km/h zones would be beneficial in encouraging commuter cycling levels, even in congested areas. Since traffic speeds are found to be particularly discouraging for female commuters, low-speed zoning may also help redress some of the gender imbalance in commuter cycling levels (Aldred et al., Citation2016; Grudgings et al., Citation2018).
Consideration of how cyclists interact with traffic at junctions should continue to be a focus for transport planners. This study emphasizes that well-designed junctions may be just as important as dedicated cycling infrastructure. Planners need to consider how cyclists can cross them without making a significant detour or ride uphill over a steep bridge (Broach et al., Citation2012). RRP studies point to the benefits of traffic signals and cyclist signals at busy junctions, supporting the idea that the influence of traffic speed and volume at junctions can be mitigated through careful design (Broach et al., Citation2012; Winters et al., Citation2011). This analysis suggests that cyclists will benefit the most from routes that effectively bypass major arteries.
Supplemental Material
Download MS Word (84.9 KB)Acknowledgements
With thanks to Will Bryans and the team at Surrey County Council for their support in undertaking this research.
References
- Aldred, R., Woodcock, J., & Goodman, A. (2016). Does more cycling mean more diversity in cycling? Transport Reviews, 36(1), 28–44. https://doi.org/10.1080/01441647.2015.1014451
- Allison, P. (2014). Measures of fit for logistic regression. SAS Global Forum 2014, 2(1970), 1–12.
- Badland, H. M., Schofield, G. M., & Garrett, N. (2008). Travel behavior and objectively measured urban design variables: Associations for adults traveling to work. Health & Place, 14(1), 85–95. https://doi.org/10.1016/j.healthplace.2007.05.002
- Basemap (2018). What is TrafficMaster data? https://www.basemap.co.uk/trafficmaster-data/
- Bernardi, S., Geurs, K., & Puello, L. L. P. (2018). Modelling route choice of Dutch cyclists using smartphone data. Journal of Transport and Land Use, 11(1), 883–900. https://doi.org/10.5198/jtlu.2018.1143
- Broach, J., Dill, J., & Gliebe, J. (2012). Where do cyclists ride? A route choice model developed with revealed preference GPS data. Transportation Research Part A: Policy and Practice, 46(10), 1730–1740. https://doi.org/10.1016/j.tra.2012.07.005
- Buehler, R., & Dill, J. (2016). Bikeway networks: A review of effects on cycling. Transport Reviews, 36(1), 9–27. https://doi.org/10.1080/01441647.2015.1069908
- Casello, J., & Usyukov, V. (2014). Modeling cyclists’ route choice based on GPS data. Transportation Research Record: Journal of the Transportation Research Board, 2430(1), 155–161. https://doi.org/10.3141/2430-16
- Chen, P., Shen, Q., & Childress, S. (2018). A GPS data-based analysis of built environment influences on bicyclist route preferences. International Journal of Sustainable Transportation, 12(3), 218–231. https://doi.org/10.1080/15568318.2017.1349222
- Cole-Hunter, T., Donaire-Gonzalez, D., Curto, A., Ambros, A., Valentin, A., Garcia-Aymerich, J., Martínez, D., Braun, L. M., Mendez, M., Jerrett, M., Rodriguez, D., de Nazelle, A., & Nieuwenhuijsen, M. (2015). Objective correlates and determinants of bicycle commuting propensity in an urban environment. Transportation Research Part D: Transport and Environment, 40(2), 132–143. https://doi.org/10.1016/j.trd.2015.07.004
- Dalton, A. M., Jones, A. P., Panter, J., & Ogilvie, D. (2015). Are GIS-modelled routes a useful proxy for the actual routes followed by commuters? Journal of Transport & Health, 2(2), 219–229. https://doi.org/10.1016/j.jth.2014.10.001
- Davies, D., Halliday, M., Mayes, M., & Pocock, R. (1997). Attitudes to cycling: A qualitative study and conceptual framework. Prepared for the Department of Transport. Retrieved April 20, 2018, from https://trl.co.uk/reports/TRL266
- DfT. (2016). Road use statistics Great Britain 2016. Department for Transport.
- Dijkstra, E. W. (1959). A note on two problems in connexion with graphs. Numerische Mathematik, 1(1), 269–271. https://doi.org/10.1007/BF01386390
- Domencich, T., & McFadden, D. (1975). Statistical estimation of choice probability functions. Urban travel demand: A behavioral analysis. North-Holland Publishing Company.
- Dormann, C. F., Elith, J., Bacher, S., Buchmann, C., Carl, G., Carré, G., Marquéz, J. R. G., Gruber, B., Lafourcade, B., Leitão, P. J., Münkemüller, T., McClean, C., Osborne, P. E., Reineking, B., Schröder, B., Skidmore, A. K., Zurell, D., & Lautenbach, S. (2013). Collinearity: A review of methods to deal with it and a simulation study evaluating their performance. Ecography, 36(1), 27–046. https://doi.org/10.1111/j.1600-0587.2012.07348.x
- Fagnant, D. J., & Kockelman, K. (2016). A direct-demand model for bicycle counts: The impacts of level of service and other factors. Environment and Planning B: Planning and Design, 43(1), 93–107. https://doi.org/10.1177/0265813515602568
- Forsyth, A., & Krizek, K. (2010). Promoting walking and bicycling: Assessing the evidence to assist planners. Built Environment, 36(4), 429–446. https://doi.org/10.2148/benv.36.4.429
- Fraser, S. D. S., & Lock, K. (2011). Cycling for transport and public health: A systematic review of the effect of the environment on cycling. European Journal of Public Health, 21(6), 738–743. https://doi.org/10.1093/eurpub/ckq145
- Gatersleben, B., & Appleton, K. M. (2007). Contemplating cycling to work: Attitudes and perceptions in different stages of change. Transportation Research Part A: Policy and Practice, 41(4), 302–312. https://doi.org/10.1016/j.tra.2006.09.002
- Götschi, T., Garrard, J., & Giles-Corti, B. (2016). Cycling as a part of daily life: A review of health perspectives. Transport Reviews, 36(1), 45–71. https://doi.org/10.1080/01441647.2015.1057877
- Grond, K. (2016). Route choice modeling of cyclists in Toronto. University of Toronto.
- Grudgings, N., Hagen-Zanker, A., Hughes, S., Gatersleben, B., Woodall, M., & Bryans, W. (2018). Why don’t more women cycle? An analysis of female and male commuter cycling mode-share in England and Wales. Journal of Transport and Health, 10, 272–283. https://doi.org/10.1016/j.jth.2018.07.004
- Heinen, E., van Wee, B., & Maat, K. (2010). Commuting by bicycle: An overview of the literature. Transport Reviews, 30(1), 59–96. https://doi.org/10.1080/01441640903187001
- Hood, J., Sall, E., & Charlton, B. (2011). A GPS-based bicycle route choice model for San Francisco, California. Transportation Letters, 3(1), 63–75. https://doi.org/10.3328/TL.2011.03.01.63-75
- Hughes, R. G., & Harkey, D. L. (1997). Cyclists’ perception of risk in a virtual environment: Effects of lane conditions, traffic speed, and traffic volume [Paper presentation]. Traffic Congestion and Traffic Safety in the 21st Century: Challenges, Innovations, and Opportunities.
- Hunt, J. D., & Abraham, J. E. (2007). Influences on bicycle use. Transportation, 34(4), 453–470. https://doi.org/10.1007/s11116-006-9109-1
- Jacobsen, P. L., Racioppi, F., & Rutter, H. (2009). Who owns the roads? How motorised traffic discourages walking and bicycling. Injury Prevention: Journal of the International Society for Child and Adolescent Injury Prevention, 15(6), 369–373. https://doi.org/10.1136/ip.2009.022566
- Jensen, A. F., Palao, A. F., Kjaer, T., & Anker Nielsen, O. (2019). Using crowd source data in bicycle route choice modeling [Paper presentation]. Proceedings from the Annual Transport Conference at Aalborg University, 1994 (pp. 1–7).
- Jestico, B., Nelson, T., & Winters, M. (2016). Mapping ridership using crowdsourced cycling data. Journal of Transport Geography, 52, 90–97. https://doi.org/10.1016/j.jtrangeo.2016.03.006
- Khatri, R., Cherry, C. R., Nambisan, S. S., & Han, L. D. (2016). Modeling route choice of bikeshare users with GPS data [Paper presentation]. TRB 2016 Annual Meeting (pp. 1–16).
- Krenn, P., Oja, P., & Titze, S. (2014). Route choices of transport bicyclists: A comparison of actually used and shortest routes. International Journal of Behavioral Nutrition and Physical Activity, 11(1), 1–7. https://doi.org/10.1186/1479-5868-11-31
- Larsen, J., Patterson, Z., & El-Geneidy, A. (2013). Build it. But where? The use of geographic information systems in identifying locations for new cycling infrastructure. International Journal of Sustainable Transportation, 7(4), 299–317. https://doi.org/10.1080/15568318.2011.631098
- Leao, S., Lieske, S., & Pettit, C. (2017). Validating crowdsourced bicycling mobility data for supporting city planning. Transportation Letters, 7867, 1–12. https://doi.org/10.1080/19427867.2017.1401198
- Long, J. S. (2009). Group comparisons in logit and probit using predicted probabilities. Retrieved April 3, 2018, from http://www.indiana.edu/∼jslsoc/files_research/groupdif/groupwithprobabilities/groups-with-prob-2009-06-25.pdf
- Lovelace, R., Goodman, A., Aldred, R., Berkoff, N., Abbas, A., & Woodcock, J. (2017). The Propensity to cycle tool: An open source online system for sustainable transport planning. Journal of Transport and Land Use, 10(1), 1–22. https://doi.org/10.5198/jtlu.2016.862
- Lowry, M. B., Furth, P., & Hadden-Loh, T. (2016). Prioritizing new bicycle facilities to improve low-stress network connectivity. Transportation Research Part A: Policy and Practice, 86, 124–140. https://doi.org/10.1016/j.tra.2016.02.003
- Mertens, L., Compernolle, S., Deforche, B., Mackenbach, J. D., Lakerveld, J., Brug, J., Roda, C., Feuillet, T., Oppert, J.-M., Glonti, K., Rutter, H., Bardos, H., De Bourdeaudhuij, I., & Van Dyck, D. (2017). Built environmental correlates of cycling for transport across Europe. Health & Place, 44(January), 35–42. https://doi.org/10.1016/j.healthplace.2017.01.007
- Misra, A., & Watkins, K. (2017). Modeling cyclists’ willingness to deviate from shortest path using revealed preference data [Paper presentation]. Transportation Research Board 96th Annual Meeting (pp. 1–17).
- Misra, A., & Watkins, K. (2018). Modeling cyclist route choice using revealed preference data: An age and gender perspective. Transportation Research Record: Journal of the Transportation Research Board, 2672(3), 145–154. https://doi.org/10.1177/0361198118798968
- Moran, S. K., Tsay, W., Lawrence, S., & Krykewycz, G. R. (2018). Lowering bicycle stress one link at a time: Where should we invest in infrastructure? Transportation Research Record: Journal of the Transportation Research Board, 2672(36), 33–41. https://doi.org/10.1177/0361198118783109
- Morgan, A. S., Dale, H. B., Lee, W. E., & Edwards, P. J. (2010). Deaths of cyclists in London: Trends from 1992 to 2006. BMC Public Health, 10(1), 699. https://doi.org/10.1186/1471-2458-10-699
- Mueller, N., Rojas-Rueda, D., Cole-Hunter, T., de Nazelle, A., Dons, E., Gerike, R., Götschi, T., Int Panis, L., Kahlmeier, S., & Nieuwenhuijsen, M. (2015). Health impact assessment of active transportation: A systematic review. Preventive Medicine, 76, 103–114. https://doi.org/10.1016/j.ypmed.2015.04.010
- Noël, N., Leclerc, C., & Lee-Gosselin, M. (2003). CRC index: Compatibility of roads for cyclists in rural and urban fringe areas [Paper presentation]. Transportation Research Board Annual Meeting (pp. 1–20).
- Oja, P., Titze, S., Bauman, A., de Geus, B., Krenn, P., Reger-Nash, B., & Kohlberger, T. (2011). Health benefits of cycling: A systematic review. Scandinavian Journal of Medicine & Science in Sports, 21(4), 496–509. https://doi.org/10.1111/j.1600-0838.2011.01299.x
- ONS. (2014a). 2011 Census analysis – Cycling to work. Retrieved July 22, 2018, from http://webarchive.nationalarchives.gov.uk/20160107181218/http://www.ons.gov.uk/ons/dcp171776_357613.pdf
- ONS. (2014b). 2011 SWS LSOA [Location of usual residence and place of work by method of travel to work by sex by age (with “outside UK” collapsed)] -– WM12EW [CT0489] – Safeguarded. UK Data Service.
- ONS. (2021). The commuting gap: men account for 65% of commutes lasting more than an hour. Retrieved August 8, 2021, from https://www.ons.gov.uk/employmentandlabourmarket/peopleinwork/employmentandemployeetypes/articles/thecommutinggapmenaccountfor65ofcommuteslastingmorethananhour/2018-11-07
- Ordnance Survey. (2011). OS MasterMap ITN layer. Edina Digimap.
- Ordnance Survey. (2016). OS MasterMap ITN urban paths layer. Edina Digimap.
- Ordnance Survey. (2018). 5m digital terrain model (DTM): Contour dataset for the UK. Edina Digimap.
- OSM. (2019). OpenStreetMap. Retrieved from https://www.openstreetmap.org/
- Parkin, J., & Rotheram, J. (2010). Design speeds and acceleration characteristics of bicycle traffic for use in planning, design and appraisal. Transport Policy, 17(5), 335–341. https://doi.org/10.1016/j.tranpol.2010.03.001
- Parkin, J., Wardman, M., & Page, M. (2007). Models of perceived cycling risk and route acceptability. Accident; Analysis and Prevention, 39(2), 364–371. https://doi.org/10.1016/j.aap.2006.08.007
- Parkin, J., Wardman, M., & Page, M. (2008). Estimation of the determinants of bicycle mode share for the journey to work using census data. Transportation, 35(1), 93–109. https://doi.org/10.1007/s11116-007-9137-5
- Prato, C. G., Halldórsdóttir, K., & Nielsen, O. A. (2018). Evaluation of land-use and transport network effects on cyclists’ route choices in the Copenhagen Region in value-of-distance space. International Journal of Sustainable Transportation, 12(10), 770–781. https://doi.org/10.1080/15568318.2018.1437236
- Pritchard, R. (2018). Revealed preference methods for studying bicycle route choice—A systematic review. International Journal of Environmental Research and Public Health, 15(3), 470. https://doi.org/10.3390/ijerph15030470
- ROSPA. (2017). Road safety factsheet. Retrieved April 14, 2018, from https://www.rospa.com/rospaweb/docs/advice-services/road-safety/cyclists/cycling-accidents-factsheet.pdf
- Rupi, F., & Schweizer, J. (2018). Evaluating cyclist patterns using GPS data from smartphones. IET Intelligent Transport Systems, 12(4), 279–285. https://doi.org/10.1049/iet-its.2017.0285
- Sarjala, S. (2019). Built environment determinants of pedestrians’ and bicyclists’ route choices on commute trips: Applying a new grid-based method for measuring the built environment along the route. Journal of Transport Geography, 78(November), 56–69. https://doi.org/10.1016/j.jtrangeo.2019.05.004
- Steer Davies Gleave & TfL. (2012). Cycle route choice – Final survey and model report. Retrieved April 4, 2018, from http://content.tfl.gov.uk/understanding-cycle-route-choice.pdf
- Wakenshaw, G., & Bunn, N. (2015). How far do people walk? Retrieved July 22, 2018, from https://www.wyg.com/uploads/files/news/WYG_how-far-do-people-walk.pdf
- Willis, D. P., Manaugh, K., & El-Geneidy, A. (2015). Cycling under influence: Summarizing the influence of perceptions, attitudes, habits, and social environments on cycling for transportation. International Journal of Sustainable Transportation, 9(8), 565–579. https://doi.org/10.1080/15568318.2013.827285
- Winters, M., Brauer, M., Setton, E. M., & Teschke, K. (2010). Built environment influences on healthy transportation choices: Bicycling versus driving. Journal of Urban Health: Bulletin of the New York Academy of Medicine, 87(6), 969–993. https://doi.org/10.1007/s11524-010-9509-6
- Winters, M., Davidson, G., Kao, D., & Teschke, K. (2011). Motivators and deterrents of bicycling: Comparing influences on decisions to ride. Transportation, 38(1), 153–168. https://doi.org/10.1007/s11116-010-9284-y
- Yeboah, G. (2015). Route choice analysis of urban cycling behaviors using OpenStreetMap: Evidence from a British urban environment. In OpenStreetMap in GIS Science. Springer. https://doi.org/10.1007/978-3-319-14280-7
- Zimmermann, M., Mai, T., & Frejinger, E. (2017). Bike route choice modeling using GPS data without choice sets of paths. Transportation Research Part C: Emerging Technologies, 75(October), 183–196. https://doi.org/10.1016/j.trc.2016.12.009