
Abstract
In many regions, conventional bicycles and electrically assisted bicycles (e-bikes), are gaining popularity and becoming a commonly used sustainable mode in the urban transportation system. Speed pedelecs are a type of high-speed e-bike with motorized pedal assistance up to a maximum speed of 45 km/h. This relatively new mode is most often used for trips that range from 10 to 40 kilometers, making it a promising mode for promoting drivers to switch to using sustainable and active transportation. The goal of this study is to assess speed pedelec usage in the Netherlands. We set out to understand who the users are, what motivates them, and whether they experience any barriers to speed pedelec usage. Using a factor-cluster analysis we group users based on their attitudes and preferences regarding the physical environment they cycle in, their sociodemographic characteristics, personal attitudes, and social environments. The analysis revealed four primary user groups: Enthusiastic riders, Efficient riders, Concerned riders and Relaxed riders. Across the groups, 85% of the respondents reported using a speed pedelec at least once a week for a trip they would have previously made by car. However, each group has specific travel habits, motivations, and safety concerns. In contrast to previous literature about the use of conventional bicycles, attitudes about competition play an important role for speed pedelec users. Stress reduction and being outside in nature also play an important role for certain segments of speed pedelec users. In addition, believing that other road users have a negative image of speed pedelecs also determines how speed pedelec users use their bicycles. While infrastructure preferences are often cited as being a distinctive factor for users of conventional bicycles, this did not clearly apply to speed pedelec users. However, all user groups reported that on average the cycling infrastructure on their regular routes was insufficiently developed for speed pedelecs. To motivate continued speed pedelec usage, each user groups requires specific policy interventions that are aligned with their personal values related to preference, safety, and image. By understanding the specific needs and desires of different segments it becomes possible to develop effective policy interventions aimed at improving the experiences of all speed pedelec users.
1. Introduction
1.1. What is a speed pedelec?
Governments in many regions around the world are facing the challenge of improving the sustainability of urban transportation systems. It is widely recognized that transportation systems which are largely dependent on private motor vehicles are associated with negative environmental and social consequences such as transport related fuel dependency, carbon dioxide emissions, urban traffic congestion, air pollution and noise pollution (Rose, Citation2012; Steg & Gifford, Citation2005), factors which can significantly reduce the overall quality of life in urban regions (WHO, 2015). As an active travel mode, bicycling is not only capable of addressing many of these problems, but is also associated with health and well-being benefits due to increased physical activity and improved air quality (Fyhri & Fearnley, Citation2015; Hoj et al., Citation2018). Conventional bicycles, as well as electrically assisted bicycles (e-bikes), are gaining popularity and becoming a commonly-used sustainable mode in the urban transportation system in many regions (MacArthur et al., Citation2014). E-bikes can extend the role that a bicycle plays in an urban transportation system, as compared to a using a conventional bicycle, they require less physical effort to travel longer, hillier and windier routes. In the Netherlands, e-bikes, which commonly have maximum speeds of 25 km per hour, were the most frequently sold type of bicycle in 2018 (CBS, Citation2019, August 29), and are largely popular due to the fact that their relatively higher average speeds allow users to travel farther distances compared to conventional bicycles (Fishman & Cherry, Citation2016).
Yet, standard e-bikes are not the fastest pedal assisted electric bicycles on the road; speed pedelecs have the potential to travel at even higher speeds, with motorized pedal assistance up to a maximum speed of 45 km/h (de Bruijne, Citation2016). In Europe, the most commonly used speed pedelecs conform to the category L1e-B of EU-regulation No 168/2013, which means that they can have an auxiliary electric motor with a maximum of 4000 Watts, and can support pedal assistance up to 45 km/h. In contrast, a standard e-bike can have a maximum power of 250 Watt and a maximum speed of 25 km/h. In the Netherlands, speed pedelecs are a relatively new mode which require users to have a license plate and wear a helmet. The mode is most often used for trips that range from 10 to 40 kilometers and, in this context, 65% of all trips are made for the purpose of commuting (de Bruijne, Citation2016). The commuting distance across all modes is usually between 15 and 35 kilometers (CBS, Citation2018, March 15), and therefore the speed pedelec is a promising mode for promoting drivers to switch to using sustainable and active transport. Although policy makers acknowledge that a mode shift from cars to speed pedelecs would result in reduced congestion and environmental benefits, there is currently much uncertainty about where and how speed pedelec users should interact with the urban mobility system. For example, European categorization places speed pedelecs in the same vehicular category as mopeds and scooters, and in the Netherlands the same traffic legislation applies to speed pedelecs as to mopeds and scooters. This means that they are not allowed to ride on bicycle paths, but instead must use regular roads shared with cars and other motorized vehicles, or dedicated bicycle paths that also permit mopeds (Rijksoverheid, Citation2018). As a result, speed pedelec users only have partial access to the extensive bicycle path network in the Netherlands. In other European counties there are different rules, for example, in Belgium speed pedelec users can choose whether to ride on the road or in a bicycle lane.
The popular and increased usage of both speed pedelecs and e-bikes have important implications for practitioners and policy makers working in the area of urban and transport planning. Even though the growing body of studies conducted about e-bike usage has increased since 2000 (Fishman & Cherry, Citation2016), due to the fact that the speed pedelec is a relatively new form of transport, there is little known about the users and usage of the mode. Hendriks (Citation2017) studied the potential adoption of speed pedelecs for commuting and found that personal attitudes related to safety, relaxation and comfort were the most important determinants. In addition, Van den Steen et al. (Citation2019) conducted a qualitative study on the experiences of 100 participants in Belgium who tested using speed pedelec for commuting for three weeks. While the results of that qualitative study provided useful insight into the motivations and barriers of (potential) speed pedelec users, it did not offer any information about cyclists who had been using speed pedelecs for a longer time. Both studies focused on speed pedelec usage within the context of commuting, and additional information is needed about speed pedelec usage across travel purposes. Therefore, additional knowledge about the actual usage (including trip purpose), preferences, obstacles, and motivations of speed pedelec users is needed to understand both current practice and future mode adoption.
1.2. Determinants of cycling behavior
While little is known about the determinants of speed pedelec adoption, literature about conventional bicycle and e-bike usage is a helpful starting point to provide a theoretical basis for this research. Determinants of cycling behavior are commonly categorized into four dimensions: the physical environment, sociodemographic factors, personal attitudes, and the social environment.
Analyses investigating the relationship between the physical environment and bicycle usage have often revealed that favorable geographic environments and the availability of high quality bicycle infrastructure are often correlated with bicycle usage (Willis et al., Citation2015). Furthermore, individuals’ willingness to cycle longer distances tends to increase when cycle routes are located in a green environment (van Duppen & Spierings, Citation2013; Vedel et al., Citation2017).
Specific sociodemographic factors have also been found to be associated with bicycle usage. For example, various studies revealed that e-bike users tend to be older, often between the ages of 50 and 70, and have higher levels of education (Cherry & Cervero, Citation2007; Haustein & Møller, Citation2016), although this is changing in recent years. With regard to speed pedelec users, a study by Hendriks (Citation2017) revealed that male individuals were found to account for a larger share of users compared to females. Other characteristics such as income and physical fitness can also influence the extent to which individuals decide to participate in cycling (Fishman & Cherry, Citation2016; Heinen et al., Citation2010).
Personal attitudes, opinions, and preferences are also important to explain bicycle usage (Fernández-Heredia et al., Citation2014). For example, Heinen et al. (Citation2011) showed that individuals’ attitudes have an important influence on the decision to use the bicycle, and people who cycle longer distances tend to be more positive about cycling compared to people who cycle relatively shorter distances. Personal preferences and attitudes also play a role in an individual’s decision to start using a speed pedelec, and Van den Steen et al. (Citation2019) found that attitudes about travel, environmental friendliness, physical and mental health, safety, having a competitive spirit, and costs were important for determining speed pedelec usage.
An individual’s social environment (such as their household, family, neighborhood, region, etc.) has also been found to strongly influence mode usage (Trapp et al., Citation2011). If cycling is seen as an exclusive activity that is only suitable for a small, selective group, and not as an activity that everyone can include into their daily life, it will likely not help to promote adoption of the mode (Gatersleben & Haddad, Citation2010). For example, even though there is a strong cycling culture in the Netherlands, if speed pedelec usage is described as an exclusive activity that is not suitable for everyone, then adoption will likely be limited to specific groups.
1.3. Typologies of cyclists
Cyclists’ personal characteristics, experiences and preferences are distinct, and segmentation analysis is helpful for reducing the complexity and heterogeneity of user populations while also providing nuanced results. Previous studies on cyclists’ typologies have segmented based on behavior and spatial variables. For example, Bergström and Magnusson (Citation2003) identified four groups of cyclists: Winter cyclists, Summer-only cyclists, Infrequent cyclist and Never cyclists, based on their cycling frequency and intention to use a bicycle in the winter. A study by Geller (Citation2006) also distinguished four types of cyclists: No way no how, Interested but concerned, Enthused and confident and Strong and fearless, based on the user-friendliness of different types of infrastructure. However, additional analysis of these typologies by Dill and McNeil (Citation2013) demonstrated the limitations of Geller (Citation2006)’s typology. They used Geller (Citation2006)’s classification to assess the Portland population, but the behavior of the cyclists within each group did not appear to correspond well with how the segments had been named. Typologies that describe cyclists’ behavior based on a limited number of predefined variables do not always accurately describe the distinct user groups. To overcome this barrier, Damant-Sirois et al. (Citation2014) developed a more complex segmentation with a combination of variables. This multidimensional typology of cyclists in Montreal was based on four groups of variables: individual characteristics, the built environment, individual attitudes, and the social environment. Finally, they identified four cyclist groups: Dedicated cyclists, Path-using cyclists, Fairweather utilitarians, and Leisure cyclists. A benefit of this multidimensional typology is that instead of predetermining groups, it determines categories post-hoc based on user characteristics. A multidimensional typology offers significant advantages in formulating policy interventions tailored to the user groups (Haustein & Hunecke, Citation2013).
The goal of this study is to assess speed pedelec usage in the Netherlands. We set out to understand who the users are, what motivates them to use the mode, and whether they experience any barriers. Using a factor-cluster analysis we group speed pedelec users based on their attitudes and preferences regarding the physical environment they cycle in, their sociodemographic factors, their personal attitudes toward the mode, and their social environments. The segmentation analysis of speed pedelec users provides information about the complexity and heterogeneity of speed pedelec users and contributes to the existing literature as it provides in-depth information about the characteristics, habits, and preferences of distinct speed pedelec user groups.
2. Study context and data
2.1. Study context
The Netherlands has a strong cycling culture and approximately 26% of all journeys are made by bicycle (KiM, Citation2019). In general, the cycling conditions are favorable; the landscape is flat, the climate is moderate and there are approximately 35,000 kilometers of bicycle paths (Jones et al., Citation2016). The first speed pedelecs appeared on the Dutch market around 2012, and by July 2019, there were approximately 21,000 speed pedelec users in the country (CBS, Citation2019, August 29). This means that the market share of the speed pedelec in the Netherlands is relatively small compared to other modes, but sales are growing rapidly, with the number of speed pedelecs on the road having doubled over the last three years (CBS, 2020). In the Netherlands, most speed pedelecs are registered in rural areas and less so in urban settings (CBS,2020).
2.2. Data collection
This study uses data collected from speed pedelec riders living in the Netherlands. The data comes from an online survey, which was available for one month from mid-April 2020 to mid-May 2020. The survey link was distributed via newsletters, at bicycle shops and using various forms of social media. The survey focused only on speed pedelec users who owned or leased a speed pedelec at the time of completing the survey. Respondents were explicitly asked to base their answers on their pre-Covid travel behavior. The survey included questions about the four previously mentioned dimensions determining bicycle usage. Survey questions about the physical environment, personal attitudes and social environment required respondents to indicate their answer using a 5-point Likert scale from “very unimportant/very disagree” to “very important/strongly agree”. Questions about sociodemographic characteristics related to age, gender, education level, family composition and the number of days an individual commuted during an average week were also included. The survey also contained questions about the length of time that participants had been using a speed pedelec and which modes they had used prior to adopting the speed pedelec. The survey concluded with an open question for further comments. In total, 514 individuals participated in the online survey and the number of valid surveys used for the analysis is 442.
summarizes the sociodemographic characteristics of the sample. The average age of our sample is 50 years old and the majority is male (86%). More than 70% of the respondents are relatively highly educated, with a higher professional or university education level. Most of the sample participates in sports on a weekly basis and participants have owned their speed pedelec for an average of 2.9 years. A majority of the speed pedelec riders in our study have cycled for commuting in the past, and on average they commute 4.5 days per week.
Table 1. Sociodemographic characteristics of speed pedelec riders.
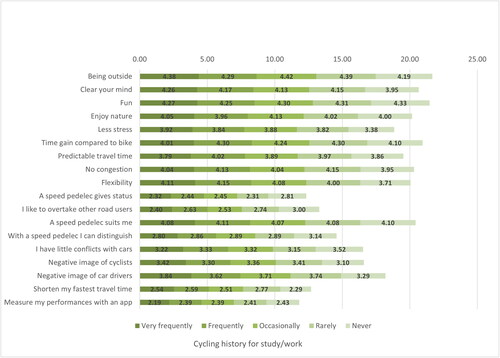
Before beginning the segmentation analysis, and to better understand the data, we conducted bivariate analysis for the variables presented in . For example, the results of a series of t-tests revealed that the only statistically significant differences (p < 0.01) between male and female speed pedelec users were the number of commuting days. Specifically, the number of commuting days in the spring and summer for women was lower (M = 3.18, SD = 1.2) compared to men (M = 3.94, SD = 1.1). Similarly, the number of commuting days in autumn and winter was also significantly lower (p < 0.01) for women (M = 2.5, SD = 1.5) than for men (M = 3.15, SD = 1.6). Further variance analysis showed that the variance in the number of speed pedelec commuting days across all seasons could be explained by education level. However, this association was found to be weak (eta = 0.16 and eta = 0.28 respectively). In addition, variance analysis also revealed that only the variation in the number of years an individual had owned a speed pedelec could be explained by age (p < 0.05). However, this association was found to be weak (eta= 0.06), and age showed no variance with the other behavioral variables, including the number of commuting days and frequency of cycling in the past for study or work. displays a comparison of the average scores of the indicators for the physical environment, personal attitudes and social environment that determine respondents’ speed pedelec usage between respondents who previously cycled to work or their place of study at different frequencies. For instance, respondents who tended to cycle occasionally in the past for study or work on average reported regarding “being outside” as more important (Average score: 4.42) in their decision to use a speed pedelec compared to respondents who had never cycled in the past for study or work (Average score: 4.19)
Figure 1. How important are these factors in your decision to use a speed pedelec: an average score ranging between “very unimportant (1)” to “very important (5)”.
3. Methodology
This study uses a factor-cluster analysis to classify specific types of speed pedelec users. Prior to the segmentation analysis, an explanatory factor analysis was employed to reduce the numbers of observed indicators relating to the physical environment, personal attitudes and social environment that determine respondents’ speed pedelec usage. A principal component analysis with varimax rotation was performed on a total of 18 variables derived from the survey. This resulted in 5-8 factors: the five factors mentioned in (healthy & outside, flexible & punctual, identity, negative image and competition) plus three additional factors (traffic & safety, environment and use of speed pedelec by family/colleagues/friends). However, the last three factors did not show enough internal consistency, with Cronbach’s Alpha of respectively 0.51, 0.50 and 0.41. Therefore, as suggested in the literature (Peterson, Citation2000), we excluded the associated items of the last three factors from the factor analysis and reconducted a factor analysis to extract five factors, as presented in . These five factors had statistically good internal consistency (for Cronbach’s Alpha, see ) and were therefore included in the cluster analysis. The reliability analysis with all variables yields a Cronbach’s alpha of 0.82, indicating an internal consistency among the indicators. The five extracted factors explain 59.2% of the total variance. presents the full results of the factor analysis.
Table 2. Variables, factors, and loadings.
The first factor, “healthy & outside” groups questions that capture speed pedelec users’ attitudes toward being outdoors and in nature, the benefits to an individual’s mental health and the pleasure of using a speed pedelec. The factor “flexible and punctual” relates to attitudes about personal travel preferences and includes opinions about travel time saving, predictability, congestion and flexibility. The factor “identity” describes the extent to which an individual personally identifies with the mode, and the factor “negative image” captures how speed pedelec users imagine the opinions that other road users have of speed pedelecs. This factor involves the negative attention speed pedelec users receive from cyclists and car drivers as well as the possible conflicts they experience such as impolite hand gestures or being forced from the road. Finally, the factor “competition” is related to the importance of striving to improve the fastest travel time and measuring performance with an app.
The second step of the analysis was to create a typology of speed pedelec users. In this research, the typologies were formed post hoc, and respondents were grouped by matching a series of multidimensional variables that potentially exert an influence on the usage of speed pedelecs. Clusters of respondents are identified and the average differences within groups are minimized while the average differences between groups are maximized. Using the factors from the abovementioned principal component analysis, K-means cluster analysis was performed to assess the presence of different kinds of speed pedelec users in the Netherlands. Finally, we compared the heterogeneity of different groups of speed pedelec users based on their sociodemographic characteristics, travel behavior and level of recognizability by other road users.
4. Results
4.1. Speed pedelec riders’ travel behavior
summarizes the descriptive analysis results of speed pedelec riders’ travel behavior. Over 90% reported using a speed pedelec for commuting and 47% of the respondents use it exclusively for commuting. Only 7% use the mode exclusively for recreation, and 46% of the respondents reported using a speed pedelec for different trip purposes including commuting, recreation, visiting friends and families, and grocery shopping. The average reported distance for a one-way commuting trip was 25 kilometers, and respondents commuted by speed pedelec more often in summer and spring than in autumn and winter. The average reported traveling speed on a dry day with little wind (36-40 km/h) is higher than on a wet and windy day (31-35 km/h) (see ).
Table 3. Sociodemographic characteristics and travel behavior of speed pedelec users.
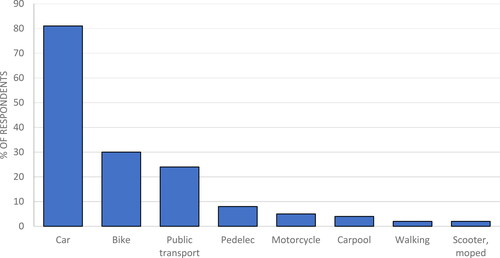
demonstrates which mode of transport the respondents used before switching to using a speed pedelec. The data in the figure exceeds one hundred percent because many people use a combination of modes. The results clearly reveal that the speed pedelec competes with car use, and 85% of the respondents reported replacing car travel (including carpooling) with speed pedelec usage. The second and third most frequently replaced trips are ones that were previously made by regular bicycle (30%) and public transport (24%).
Figure 2. Commuting mode prior to speed pedelec adoption.
4.2. User groups
Based on the results of the factor analysis, K-means cluster results were assessed for three to seven segment groups. The analysis with four groups converged to zero with 13 iterations and the minimum distance between initial centers was 6.552. Next, using ANOVA we assessed whether all factors used differed significantly among the four groups. With three, five, six and seven groups the K-means clustering failed to achieve convergence because the maximum number of twenty iterations was achieved and also the factors did not significantly differ among the groups. Only the analysis which resulted in four groups was statistically robust and therefore was used for the final analysis. In this method of K-means clustering, users can only be in one group and are attributed to the group they identify most with. The four user groups are shown in .
Figure 3. Typology of speed pedelec users.
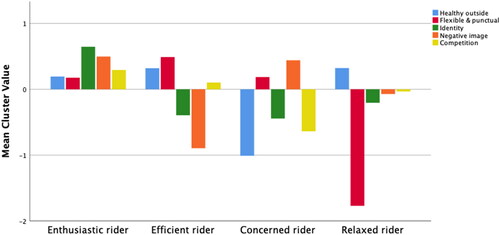
Four distinct groups of speed pedelec users were identified:
Enthusiastic riders (36% of the sample): Enthusiastic riders strongly identify with the mode and believe that the speed pedelec gives them a certain status. They believe that their speed distinguishes them from other road users and often express a desire to overtake others. They tend to be competitive and often use an app to track their ride information. One Enthusiastic rider even referred to the speed pedelec as a lifestyle: “I love the speed pedelec way of life in all weather and wind [translation by authors].” Compared to other clusters, these cyclists are annoyed by the negative image that they believe other road users such as regular cyclists and motorists have of speed pedelecs.
Efficient riders (29% of the sample): Efficient riders are motivated by the mobility advantages provided by the mode. For example, they use the speed pedelec because it represents a flexible and fast means of transport that allows them to avoid traffic congestion and state that the mode ensures for predictable travel times. Efficient riders also enjoy nature and the outdoors and find that using a speed pedelec is good for their mental health. A comment from one Efficient rider summarizes the sentiment of this group: “I bought the speed pedelec because I love cycling and don’t want to spend too much time travelling and was immediately able to travel in an active way [translation by authors].” One major difference between Enthusiastic riders and Efficient riders is that the former strongly identifies with the mode, while the latter predominantly views the speed pedelec as a convenient means of transport. Finally, Efficient riders tend to be less irritated by the fact that other road users often have a negative image of the mode.
Concerned riders (21% of the sample). Concerned riders tend to be bothered by the negative image that other road users often have of the speed pedelec and suffer from getting into potential conflicts with cars. This group does not find that using a speed pedelec is relaxing and tends to experience stress while navigating traffic situations. Specifically, unsafe traffic situations cause Concerned riders to experience stress during travel. One Concerned rider mentioned that “a speed pedelec requires very defensive riding behavior. In other words, it is always important to be very careful [translation by authors].” Finally, Concerned riders are usually not competitive in their use of the speed pedelec, and tend not to use apps to measure and decrease their travel times. Instead, they primarily focus on cycling safety.
Relaxed riders (14% of the sample): Relaxed riders enjoy nature, being outdoors and appreciate the positive effect that using a speed pedelec has on their mental health. They do not strongly identify with the mode and often use it for recreation and other trips that do not include commuting. This means that they are generally not concerned with travel time savings and avoiding congestion. One Relaxed rider who does not use his speed pedelec for commuting, but for other purposes stated that: “I use it purely for shopping and recreation and use it for different journey types and distances every day. The reason that I purchased it was that I live in a hilly environment in the South Veluwe, and that my weight, 130 kg, requires a bicycle with more power and stronger support [translated by author].”
4.3. Sociodemographic characteristics, travel behavior, and recognizability
A comparison between the sociodemographic characteristics of each group provides insight into the significant differences between the distinct user categories. shows the demographic characteristics of the four types of speed pedelec riders. While the difference in the male/female ratio between the four user groups is not significant (p > 0.05), as all four types of speed pedelec riders are characterized with a higher proportion (over 80%) of male riders, Enthusiastic riders have the highest percentage of male riders at 92%. A possible explanation for the small share of females in the Enthusiastic rider group is that women often exhibit more defensive driving behavior due to higher risk aversion (Heinen et al., Citation2010). The age differences between the user groups are statistically significant (p < 0.05); Relaxed riders have the highest average age (54.6), which is over 3.5 years higher than Enthusiastic, Efficient, and Concerned riders. The education level of the different types of speed pedelec riders is almost the same; over two thirds of all groups have an education level of HBO (higher vocational education) or university.
We only asked speed pedelec commuters to report the number of days they worked or studied outside of the home (N = 411). Concerned riders tend to report shorter average working hours outside of the home per week compared to other user groups. In addition, for all user types, a large majority cycled often for the purpose of study or work. Only for Relaxed riders is the cycling frequency slightly lower, with 53% of riders reporting that they never to occasionally had cycled for the purpose of traveling to study or work. A possible explanation could be that the strong cycling culture in the Netherlands contributed to the positive and active cycling experiences and histories held by most speed pedelec riders.
Speed pedelec riders also generally engage in physical activity and sports more often than the average Dutch population, even excluding the physical activity which these users are engaged in when using a speed pedelec for commuting. More than 63% of the respondents reported exercising once or twice a week, compared to 53% of the Dutch population (CBS). The Enthusiastic riders are the least sporty, with 43% never or only occasionally engaging in sports.
With regard to travel behavior, Concerned riders most often use the speed pedelec exclusively for commuting (55%), while Enthusiastic riders often use the mode for multiple purposes (52%) including visiting family and friends, doing grocery shopping and recreation. Relaxed riders have the highest percentage (16%) of users who use the speed pedelec only recreationally. The differences between the travel purposes of the segments were found to be statistically significant (p < 0.05) but displayed a weak association (V = 0.132). Enthusiastic riders most often use the speed pedelec for commuting, using it an average of 88% of the working days in spring and summer and 76% in autumn and winter, respectively. Relaxed riders commute the least often by speed pedelec, using the mode for 80% of commutes in the spring and summer and 54% in the autumn and winter. A variance analysis on the average number of days a week that the speed pedelec is used for commuting in the autumn and winter for four user groups revealed that the differences between Enthusiastic riders and Efficient riders and between Enthusiastic riders and Relaxed riders are statistically significant (p < 0.05), and with 4.7% of the variance being explained by differences between user types. Finally, Concerned riders and Relaxed riders tend to travel at lower average reported traveling speeds compared to Enthusiastic and Efficient riders, both on dry days with little wind and wet days with strong wind. For example, on dry days with little wind, 68% of Enthusiastic riders and 61% of Efficient riders reported traveling at speeds of 36 to 45 km/h, while for Concerned and Relaxed riders, the self-reported average traveling speeds were between 31 and 40 km/h.
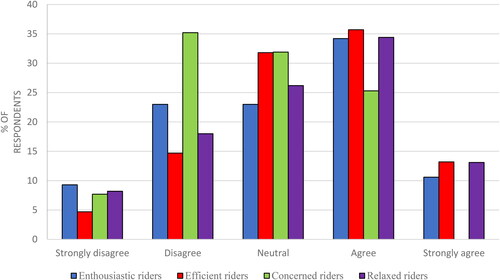
The current traffic legislation, whereby speed pedelec users are prohibited from riding on most bicycle paths, but must share roads with mixed car traffic, is not clear to all road users (especially car and other regular bicycle users). This lack of clarity about where and how speed pedelec users are expected to participate in urban mobility systems is the cause of irritations and often dangerous situations for both speed pedelec users and other road users. For instance, car drivers often do not appear to understand why a “cyclist” is riding on the road while a bicycle path appears to be available. demonstrates that not all speed pedelec user groups believe that other road users fully recognize speed pedelecs as a unique vehicle category. Concerned riders have the most negative opinions about the recognizability of speed pedelecs within the urban mobility system, with one Concerned rider reporting that he was under the impression the other road users tend to view speed pedelecs as regular e-bikes, which is problematic since different traffic and road rules apply.
Figure 4. Frequency distribution of variable: ‘I’m recognizable as a speed pedelec rider by other road users.
5. Discussion
The results of this study demonstrate that speed pedelecs users often use the mode to replace trips otherwise taken by car, conventional bicycle, or public transit. This finding applies to all user types and 85% of the respondents reported using their speed pedelec at least once a week for a trip they would have previously made by car. This substitution rate is higher than previously reported findings, and may be due to the smaller sample used in the study by de Bruijne (Citation2016). The findings regarding the shift from motorized modes to active transportation is similar to the results presented by Plazier et al. (Citation2017) who found that standard e-bikes have the potential to motive sustainable mode shift. Since speed pedelecs allow cyclists to travel even more quickly than standard e-bikes, this new mode is likely to enhance the substitution effect even further.
While speed pedelec usage is increasing across the Netherlands, it is not increasing amongst all segments of the population. For example, 86% of the users in this study are male, and the low proportion of women may be explained due to differences in risk aversion between genders (Heinen et al., Citation2010). Race bike users, who similarly travel at higher speeds, also tend to be primarily male with only a 9% participation rate for women in 2017 (KNWU, Citation2017). The speed pedelec users who participated in this study also tend to be older, with the average being 50 years old. This finding is consistent with previous studies about speed pedelec usage in the Netherlands (de Bruijne, Citation2016; Hendriks, Citation2017). The finding concerning age is also aligned with findings about e-bike users, and Wolf and Seebauer (Citation2014) found that e-bike users in Austria tended to skew disproportionately toward being older and mostly retired. However, in recent years, e-bike usage has become increasingly popular among younger groups, especially for traveling relatively longer distances (KiM, Citation2019). However, this trend has not yet been observed amongst speed pedelec users in the Netherlands. Finally, the speed pedelec users in this study reported being highly educated. However, because education level and income are highly correlated in the Netherlands, the ability to purchase a speed pedelec is likely related to disposable income. Another possible reason may be because individuals with relatively high incomes have been found to be more health conscious (Heinen et al., Citation2010).
At first sight, the results of this study suggest that speed pedelec users appear to be a homogeneous group; after all, the majority are male and use the mode for commuting. However, when taking a closer and more careful look, individuals’ personal preferences, motivations and barriers differ considerably among users.
5.1. Attitudes, opinions and preferences
Individual attitudes, opinions, and preferences regarding participation in physical activity, engaging in competition, and cycling for different trips types vary greatly among the speed pedelec users who participated in this study. Previous research also revealed that individuals’ attitudes toward various elements of cycling play an important role in the decision to use the mode (Fishman et al., Citation2015; Heinen et al., Citation2011; Willis et al., Citation2015). We hypothesize that people who appreciate flexibility and punctuality are a unique group of speed pedelec riders (which we label Efficient riders). In contrast, we suggest that the group which we label Relaxed riders can be identified as speed pedelec users who do not value this aspect as much, selecting the mode to a greater extent because it allows them to enjoy being outdoors and due to the positive effect it has on their mental health. The group which we label Efficient riders shows similarities with other segments reported in previous studies about users of conventional bicycles, such as the Flexible & punctual cyclists presented by Damant-Sirois et al. (Citation2014) who are motivated by the time efficiency of the mode. Similarly, speed pedelec riders who we identify as being a part of the Relaxed riders group are comparable to the Leisure cyclists reported by Damant-Sirois et al. (Citation2014).
In our typology of speed pedelec users, Efficient, Relaxed, and Enthusiastic riders are all found to value the health benefits related using the mode. Previous studies also identified that attitudes about health and physical activity can be helpful for segmenting and identifying potential cyclists, and the way in which Enthusiastic riders identify with the speed pedelec as a “way of life” is similar to the results presented by Gatersleben and Haddad (Citation2010). While relaxation and reduced stress are important factors motivating bicycle usage around the world (Avila-Palencia et al., Citation2017; St-Louis et al., Citation2014), little is known about the effect that using a bicycle has on individuals’ self-reported mental health. However, the results of the present study reveal that most cyclists positively associate speed-pedelec usage with stress reduction, clearing the mind, and the joy of being outside and in nature.
Competition and the use of performance apps, to our knowledge, has not been previously reported as an important element for segmenting cyclists or as a significant determinant of bicycle usage. Yet, we identify Enthusiastic and Efficient riders as being motivated to track their performance and continuously strive to reduce their travel times. While attitudes about competition play an important role for speed pedelec users, this element may also be important for other kinds of cyclists.
5.2. Image and identity
The extent to which speed pedelec users identify with the mode differs among user groups. Similarly, speed pedelec users’ perceptions of how the mode is viewed by other road users such as drivers, users of conventional bicycles and pedestrians, also varies greatly. In our typology of speed pedelec users, we hypothesize that a unique group of users, which we label Enthusiastic riders, tends to personally identify the most strongly as being speed pedelec riders; this group is also the most concerned about other mode users having a negative image or opinion about speed pedelecs. In contrast, we identify Efficient riders as being the least concerned about their own image and identity, and hypothesize that members belonging to the group Concerned riders tend to be unsatisfied when other mode users have a negative image of the speed pedelec, but do not strongly identify with the mode. The image and identity of a mode can be important for understanding continued usage, as previous studies have suggested that personally identifying with a mode is a strong determinant of future usage (Damant-Sirois et al., Citation2014; van Lierop & El-Geneidy, Citation2018).
Speed pedelecs users in Belgium reported that they feel that they are not clearly accepted anywhere in the urban mobility system–neither on the road with cars nor on bicycle paths shared with users of conventional bicycles (Van den Steen et al., Citation2019). While these results are based on the perceptions of speed pedelec users, and not those of other modes, the negative image of the speed pedelec may be a reason for limited adoption and participation. For example, Gatersleben and Haddad (Citation2010) suggest that if people have a strong opinion of what a typical cyclists looks or acts like, they may be less likely to adopt the mode if they themselves do not identify with it or do not imagine that it is a suitable and socially appropriate activity for everyone. The perception that speed pedelecs are not socially accepted is therefore not only problematic for Enthusiastic and Concerned riders but may also be hindering speed pedelec adoption more generally.
5.3. Infrastructure
Previous studies have found that different groups of cyclists have specific preferences about bicycle infrastructure (Damant-Sirois et al., Citation2014; Geller, Citation2006). However, in this study, speed pedelec users’ opinions and preferences about infrastructure remained consistent across the four groups, and shows the average and standard deviation for traffic and safety related questions. Specifically, the table displays the basic results of the infrastructure perception of the whole sample and the different groups of users. All user groups reported that on average the infrastructure on the routes they took was insufficiently developed for speed pedelecs. A likely reason is that although cycling infrastructure in the Netherlands is extremely well developed, traffic legislation in the Netherlands currently restricts speed pedelec usage on many bicycle paths. Speed pedelecs are permitted on bicycle infrastructure where mopeds are also allowed, and almost 90% of the respondents stated that they felt safe on this kind of infrastructure when it was located outside of city centers. Speed pedelec users tended to feel unsafe cycling in mixed traffic, especially in situations where they were restricted to using the road network, as opposed to the bicycle network. Finally, many participants mentioned the importance of having access to secured bicycle parking both at home and at work, a finding that is consistent with previous studies assessing barriers to bicycle usage (Hunt & Abraham, Citation2007; Van Lierop et al., Citation2015).
Table 4. Likert scale scores (1 = agree very little, 5 = agree very much): traffic & safety.
5.4. Barriers for speed pedelec usage
This research demonstrates that speed pedelecs are not yet an integrated part of the urban mobility system. The main barriers for speed pedelec usage are the negative image that other road users have of speed pedelecs and the restrictions on the use of bicycle infrastructure. The negative image is primarily a barrier for Enthusiastic and Concerned riders, who consequentially do not feel respected on the road, which often leads to feeling unsafe. These safety related issues are also reflected in the fact that Enthusiastic and Concerned riders mention that they experience many conflicts with cars. More generally, the current traffic legislation and related restrictions on the use of bicycle infrastructure in the Netherlands is a barrier to all speed pedelec riders. This is evident by all types of users reporting that they do not feel comfortable traveling at high speeds in mixed traffic.
6. Policy recommendations
This research has demonstrated that the characteristics, attitudes, needs and preferences of speed pedelec users differ compared to those reported in previous studies concerning conventional cyclists (e.g. Fernández-Heredia et al., Citation2014; Heinen et al., Citation2011). In addition, the results show that significant differences exist among speed pedelec users in terms of their attitudes and preferences such as valuing the mode because it is ‘flexible and punctual’ and that the mode is related to a certain ‘image and identity.’ However, perceptions about infrastructure are mostly consistent across user groups. The opinions of all user groups should be taken into consideration when regional governments, cities, and employment hubs take actions to promote the adoption and use of this sustainable mode. For example, while the current traffic legislation restricts the use of speed pedelecs to certain areas and types of infrastructure, the results of this research revealed that all segments of speed pedelec users felt uncomfortable traveling at high speeds in mixed traffic. Negative perceptions regarding traffic safety are likely to discourage speed pedelec usage and adoption. Therefore, a unified infrastructure policy is needed to encourage the continued usage and adoption of speed pedelec use in the Netherlands. For example, setting speed limits on bicycle paths and allowing speed pedelecs to choose to travel at lower speeds on the bicycle path or at higher speeds on the road network would likely encourage higher adoption and usage of the mode altogether. The Dutch technology platform for transport, CROW, advises the use of pilot projects to gain more knowledge about how speed pedelec users engage with existing bicycle infrastructure (Hulshof & Wolters, Citation2019). Planned pilot projects in the city of Rotterdam and the province of Gelderland are expected provide more information on the actual behavior of speed pedelec users when they have freedom of choice on the use of infrastructure (bicycle path vs. mixed road traffic). The differences between the types of users revealed in this study provide policy makers insight how to integrate speed pedelecs in the Dutch mobility system, starting with pilot projects. An important condition to encourage the efficient use of high-speed bicycles, such as speed pedelecs and e-bikes is by further developing the bicycle highway network that is accessible to speed pedelec users and by providing secured parking at both origin and destination locations (Li et al., Citation2013; Skov-Petersen et al., Citation2017). Improving the safety and directness of the route as well as the ease of parking will likely encourage Efficient riders to continue and increase using the mode across trips types and seasons. In addition, the availability and visibility of bicycle highways and secured parking would likely attract new riders, who have similar characteristics and values as the Efficient riders identified in this study.
Enthusiastic and Concerned riders, who make up 57% of the users, are dissatisfied with the negative image that other road users often attribute to the speed pedelec. Information campaigns that educate other traffic users about speed pedelec usage can be helpful in promoting a more positive image of the mode. For instance, information campaigns could educate other traffic users that speed pedelecs (which have a license plate) belong on the road, not the bike path. Similarly, these campaigns should highlight that speed pedelec users are not adding to traffic congestion, and instead have environmental and sustainability benefits since they often replace the use of cars. Increasing the social acceptance of the speed pedelec is not only likely to result in a more comfortable ride for current users, but also attract new users such as women and young people. Finally, studies have found that as individuals increase their engagement with cycling, their attitudes toward the mode become more favorable. Accordingly, and since speed pedelecs are a relatively new mode, we recommend that cities promote the use of the mode by setting up test-ride locations to encourage potential users to try out this new, fast, and sustainable mode.
7. Conclusion
Speed pedelecs are a relatively new form of urban transportation that have the potential to positively influence sustainable travel in urban regions. This study set out to assess the characteristics, attitudes, needs and preferences of speed pedelec users in the Netherlands, and identified four distinct groups: Enthusiastic riders, Efficient riders, Concerned riders and Relaxed riders. Each group has specific opinions about using the mode for health benefits, the flexibility of the mode, the competitive element, the image of the mode, as well as the extent to which they identify as a speed pedelec users. In addition, the four groups also used the mode for different trip purposes, at different speeds, and with variability across seasons. For example, Enthusiastic riders experience using the speed pedelec as a way of life and use it throughout the year, for commuting, going shopping as well as recreational activities such as visiting friends. Similar to Enthusiastic riders, Efficient riders also travel at relatively high speeds, but do not use the speed pedelecs as frequently in the fall when the weather tends to be wetter. Concerned riders are the most careful group, ride at lower speeds and primarily use the bicycle for commuting purposes. Relaxed riders tend to use speed pedelecs for recreational cycling and when they do use it for commuting they do so primarily in in the spring and summer when the weather is dry. Yet, despite the differences between the groups, most speed pedelec users agree that the infrastructure and traffic regulations are currently not adequate to make ideal usage of the mode. They primarily feel safe on bicycle infrastructure that allows high speed bicycles and mopeds such as certain bicycle highways, with many experiencing discomfort and safety concerns when cycling in mixed traffic. Finally, across the four groups, many users reported that they used the speed pedelec to replace car trips.
This research, however, is subject to several limitations. While the present research focused on better understanding the attitudes, opinions, preferences and habits of current speed pedelec users in the Netherlands, it did not include the opinions and experiences of non-speed pedelec users. Future studies should consider engaging other mode users, to enable a better understanding of the specific characteristics of speed pedelec users thorough a comparison with non-speed pedelec users. Moreover, future studies should assess the needs and desires of potential users, especially non-users who currently use cars for commuting purposes. Focusing on the needs of potential users is likely to result in adoption of the mode and contribute a shift in the usage of more sustainable modes. Future studies should assess how to motivate increased participation amongst women, younger and lower-income groups. In addition, the results of this study suggest a consistency exists in how speed pedelec users experience infrastructure. Accordingly, future studies should consider modeling these perceptions to better understand any subtle differences between subjective and objective experiences by matching sensors and GPS data to the self-reported survey data. The quality of the speed pedelec itself or the parking and charging infrastructure should also be taken into account. In addition, while the current study applied a factor-cluster analysis of speed pedelec users to provide in-depth information about the characteristics, habits, preferences, and behaviors of distinct speed pedelec user groups, a limitation of this method is that it does not allow for users to be in more than one category at a time. Therefore, future studies could consider latent class analysis where users can be placed into more than one category to better reflect the complex and heterogeneity of user groups. Future studies could also consider conducting regression analyses to evaluate the association between socio-demographics, attitudes, usage behavior, and mode substitution pattern of speed pedelecs users. This could help shed light on the underlying mechanisms influencing the different behavior patterns for which people use speed pedelecs. Finally, additional research is needed to better understand how infrastructure and traffic regulations can accommodate the needs of speed pedelec users while ensuring safe road conditions for users of all modes.
By understanding the specific needs and desires of different speed pedelec user groups, the results of our research demonstrate important hypotheses concerning the possible policy implications needed to accommodate specific speed pedelec user groups. For example, the consensus among all speed pedelec user groups concerning infrastructure suggests that it is likely possible to develop a unified approach to accommodate different types of speed pedelec users in terms of amending the built environment. However, other facets of speed-pedelec usage were not experienced in the same way across segments, suggesting that group-specific programs and policies may be needed to facilitate the growth of overall speed pedelec usage. For example, it is critical to develop effective policy interventions aimed at improving the interaction between speed pedelec users and other road and bicycle path users. A harmonious and safe integration is needed to ensure the success of the speed pedelec as an accessible mode which has the potential to play an important role in the development of sustainable urban futures.
Declarations of interest
No potential conflict of interest was reported by the authors.
Acknowledgments
The authors wish to thank all the participants for their time and contribution. As well as reviewers for their valuable feedback.
References
- Avila-Palencia, I., de Nazelle, A., Cole-Hunter, T., Donaire-Gonzalez, D., Jerrett, M., Rodriguez, D. A., & Nieuwenhuijsen, M. J. (2017). The relationship between bicycle commuting and perceived stress: a cross-sectional study. BMJ Open, 7(6), e013542. https://doi.org/10.1136/bmjopen-2016-013542
- Bergström, A., & Magnusson, R. (2003). Potential of transferring car trips to bicycle during winter. Transportation Research Part A: Policy and Practice, 37(8), 649–666. https://doi.org/10.1016/S0965-8564(03)00012-0
- CBS. (2018, March 15). Woon-werkafstanden 2016. https://www.cbs.nl/nl-nl/achtergrond/2018/11/woon-werkafstanden-2016
- CBS (2019, August 29). Aantal speed-pedelecs met 60 procent gestegen. https://www.cbs.nl/nl-nl/nieuws/2019/35/aantal-speed-pedelecs-met-60-procent-gestegen
- Cherry, C., & Cervero, R. (2007). Use characteristics and mode choice behavior of electric bike users in China. Transport Policy, 14(3), 247–257. https://doi.org/10.1016/j.tranpol.2007.02.005
- Damant-Sirois, G., Grimsrud, M., & El-Geneidy, A. M. (2014). What’s your type: A multidimensional cyclist typology. Transportation, 41(6), 1153–1169. https://doi.org/10.1007/s11116-014-9523-8
- de Bruijne, R. (2016). Revolutie of risico. Grontmij.
- Dill, J., & McNeil, N. (2013). Four types of cyclists? Examination of typology for better understanding of bicycling behavior and potential. Transportation Research Record: Journal of the Transportation Research Board, 2387(1), 129–138. https://doi.org/10.3141/2387-15
- Fernández-Heredia, Á., Monzón, A., & Jara-Díaz, S. (2014). Understanding cyclists’ perceptions, keys for a successful bicycle promotion. Transportation Research Part A: Policy and Practice, 63, 1–11. https://doi.org/10.1016/j.tra.2014.02.013
- Fishman, E., & Cherry, C. (2016). E-bikes in the mainstream: Reviewing a decade of research. Transport Reviews, 36(1), 72–91. https://doi.org/10.1080/01441647.2015.1069907
- Fishman, E., Washington, S., Haworth, N., & Watson, A. (2015). Factors influencing bike share membership: An analysis of Melbourne and Brisbane. Transportation Research Part A: Policy and Practice, 71, 17–30. https://doi.org/10.1016/j.tra.2014.10.021
- Fyhri, A., & Fearnley, N. (2015). Effects of e-bikes on bicycle use and mode share. Transportation Research Part D: Transport and Environment, 36, 45–52. https://doi.org/10.1016/j.trd.2015.02.005
- Gatersleben, B., & Haddad, H. (2010). Who is the typical bicyclist? Transportation Research Part F: Traffic Psychology and Behaviour, 13(1), 41–48. https://doi.org/10.1016/j.trf.2009.10.003
- Geller, R. (2006). Four types of cyclists. http://www.portlandoregon.gov/transportation/
- Haustein, S., & Hunecke, M. (2013). Identifying target groups for environmentally sustainable transport: assessment of different segmentation approaches. Current Opinion in Environmental Sustainability, 5(2), 197–204. https://doi.org/10.1016/j.cosust.2013.04.009
- Haustein, S., & Møller, M. (2016). Age and attitude: Changes in cycling patterns of different e-bike user segments. International Journal of Sustainable Transportation, 10(9), 836–846. https://doi.org/10.1080/15568318.2016.1162881
- Heinen, E., Maat, K., & van Wee, B. (2011). The role of attitudes toward characteristics of bicycle commuting on the choice to cycle to work over various distances. Transportation Research Part D: Transport and Environment, 16(2), 102–109. https://doi.org/10.1016/j.trd.2010.08.010
- Heinen, E., van Wee, B., & Maat, K. (2010). Commuting by bicycle: An overview of the literature. Transport Reviews, 30(1), 59–96. https://doi.org/10.1080/01441640903187001
- Hendriks, B. (2017). Moving on to the active modes. A research on the potential of speed pedelecs becoming a major mode in computer traffic [Master thesis]. Radboud University. https://theses.ubn.ru.nl/bitstream/handle/123456789/5404/Hendriks,_Babet_1.pdf?sequence=1
- Hoj, T. H., Bramwell, J. J., Lister, C., Grant, E., Crookston, B. T., Hall, C., & West, J. H. (2018). Increasing active transportation through e-bike use: Pilot study comparing the health benefits, attitudes, and beliefs surrounding e-bikes and conventional bikes. JMIR Public Health and Surveillance, 4(4), e10461. https://doi.org/10.2196/10461
- Hulshof, R., & Wolters, s. (2019). Een verkenning naar scenario’s voor de plek op de weg van de speed-pedelec op het Nederlandse wegennet. Ede: CROW-Fietsberaad. Geraadpleegd van https://www.fietsberaad.nl/getmedia/8ae8d4b0-3e3c-4660-8ee2-75b63f76e53d/CROWFietsberaadnotitie_scenarios-speed-pedelec-versie31-1-2019.pdf.aspx?ext=.pdf.
- Hunt, J. D., & Abraham, J. E. (2007). Influences on bicycle use. Transportation, 34(4), 453–470. https://doi.org/10.1007/s11116-006-9109-1
- Jones, T., Harms, L., & Heinen, E. (2016). Motives, perceptions and experiences of electric bicycle owners and implications for health, wellbeing and mobility. Journal of Transport Geography, 53, 41–49. https://doi.org/10.1016/j.jtrangeo.2016.04.006
- KiM. (2019). Mobiliteitsbeeld 2019. Kennisinstituut voor het Mobiliteitsbeleid.
- KNWU. (2017). Nederlandse wielersportmonitor 2017 – Editie 4. https://www.knwu.nl/storage/2018/01/Wielersportmonitor-2017-Super-sportieven.pdf
- Li, Z., Wang, W., Yang, C., & Ragland, D. R. (2013). Bicycle commuting market analysis using attitudinal market segmentation approach. Transportation Research Part A: Policy and Practice, 47, 56–68. https://doi.org/10.1016/j.tra.2012.10.017
- MacArthur, J., Dill, J., & Person, M. (2014). Electric bikes in North America: Results of an online survey. Transportation Research Record: Journal of the Transportation Research Board, 2468(1), 123–130. https://doi.org/10.3141/2468-14
- Peterson, R. A. (2000). A meta-analysis of variance accounted for and factor loadings in exploratory factor analysis. Marketing Letters, 11(3), 261–275. https://doi.org/10.1023/A:1008191211004
- Plazier, P. A., Weitkamp, G., & van den Berg, A. E. (2017). “Cycling was never so easy!” An analysis of e-bike commuters’ motives, travel behaviour and experiences using GPS-tracking and interviews. Journal of Transport Geography, 65, 25–34. https://doi.org/10.1016/j.jtrangeo.2017.09.017
- Rijksoverheid. (n.d.). Welke regels gelden voor speed pedelecs? https://www.rijksoverheid.nl/onderwerpen/bijzondere-voertuigen/vraag-en-antwoord/welke-regels-gelden-voor-speed-pedelec
- Rose, G. (2012). E-bikes and urban transportation: Emerging issues and unresolved questions. Transportation, 39(1), 81–96. https://doi.org/10.1007/s11116-011-9328-y
- Skov-Petersen, H., Jacobsen, J. B., Vedel, S. E., Thomas Alexander, S. N., & Rask, S. (2017). Effects of upgrading to cycle highways – An analysis of demand induction, use patterns and satisfaction before and after. Journal of Transport Geography, 64, 203–210. https://doi.org/10.1016/j.jtrangeo.2017.09.011
- St-Louis, E., Manaugh, K., van Lierop, D., & El-Geneidy, A. (2014). The happy commuter: A comparison of commuter satisfaction across modes. Transportation Research Part F: Traffic Psychology and Behaviour, 26, 160–170. https://doi.org/10.1016/j.trf.2014.07.004
- Steg, L., & Gifford, R. (2005). Sustainable transportation and quality of life. Journal of Transport Geography, 13(1), 59–69. https://doi.org/10.1016/j.jtrangeo.2004.11.003
- Trapp, G. S., Giles-Corti, B., Christian, H. E., Bulsara, M., Timperio, A. F., McCormack, G. R., & Villaneuva, K. P. (2011). On your bike! A cross-sectional study of the individual, social and environmental correlates of cycling to school. The International Journal of Behavioral Nutrition and Physical Activity, 8(1), 123. https://doi.org/10.1186/1479-5868-8-123
- Van den Steen, N., Herteleer, B., Cappelle, J., & Vanhaverbeke, L. (2019). Motivations and barriers for using speed pedelecs for daily commuting. World Electric Vehicle Journal, 10(4), 87. https://doi.org/10.3390/wevj10040087
- van Duppen, J., & Spierings, B. (2013). Retracing trajectories: the embodied experience of cycling, urban sensescapes and the commute between ‘neighbourhood’ and ‘city’ in Utrecht, NL. Journal of Transport Geography, 30, 234–243. https://doi.org/10.1016/j.jtrangeo.2013.02.006
- van Lierop, D., & El-Geneidy, A. (2018). Is having a positive image of public transit associated with travel satisfaction and continued transit usage? An exploratory study of bus transit. Public Transport, 10(2), 241–256. https://doi.org/10.1007/s12469-018-0175-5
- Van Lierop, D., Grimsrud, M., & El-Geneidy, A. (2015). Breaking into bicycle theft: Insights from Montreal, Canada. International Journal of Sustainable Transportation, 9(7), 490–501. https://doi.org/10.1080/15568318.2013.811332
- Vedel, S. E., Jacobsen, J. B., & Skov-Petersen, H. (2017). Bicyclists’ preferences for route characteristics and crowding in Copenhagen–A choice experiment study of commuters. Transportation Research Part A: Policy and Practice, 100, 53–64.
- Willis, D. P., Manaugh, K., & El-Geneidy, A. (2015). Cycling under influence: Summarizing the influence of perceptions, attitudes, habits, and social environments on cycling for transportation. International Journal of Sustainable Transportation, 9(8), 565–579. https://doi.org/10.1080/15568318.2013.827285
- Wolf, A., & Seebauer, S. (2014). Technology adoption of electric bicycles: A survey among early adopters. Transportation Research Part A: Policy and Practice, 69, 196–211.