
Article title: Low emission scenarios with shared and electric cars: Analyzing life cycle emissions, biofuel use, battery utilization, and fleet development
Authors: Hampus Berg Mårtensson, Mattias Höjer, and Jonas Åkerman
Journal: International Journal of Sustainable Transportation
DOI: https://doi.org/10.1080/15568318.2023.2248049
This article was originally published with errors in . The errors were connected to how indirect emissions from production of vehicles were calculated. They have since been corrected. have also been corrected. A number of textual edits have been made in order to take into account decisions within the EU regarding the emissions trading system, EU ETS, that were taken between first submission and publishing of the article.
The corrected versions of , , and appear below.
Table 2. Indirect emissions from vehicle production, maintenance and end-of-life in 2018 and 2030, respectively (based on Ricardo, 2020, with modifications).
Table 3. Specific direct and indirect emissions as well as energy use in 2018 and 2030, among new cars.
Table 7. Average annual rate of removal and addition of cars for 2023–2030 in the scenarios divided by the averages during 2011–2020.
The corrected versions of , , and appear below.
Figure 3. Accumulated direct GHG emissions and indirect fuel and vehicle cycle GHG emissions. The first column group refers to 2018 data multiplied by a factor eight to make them comparable to the following six column groups, representing accumulated emissions 2023–2030 in the six scenarios.
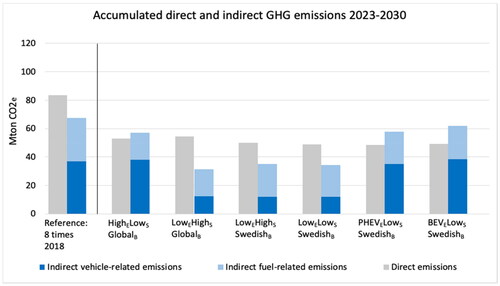
Figure 4. The accumulated indirect emissions in the scenarios 2023–2030 and a comparative “budget ceiling” for indirect emissions within EU ETS. Staying below the budget ceiling means indirect emissions do not increase beyond their current share of total emissions within EU ETS.
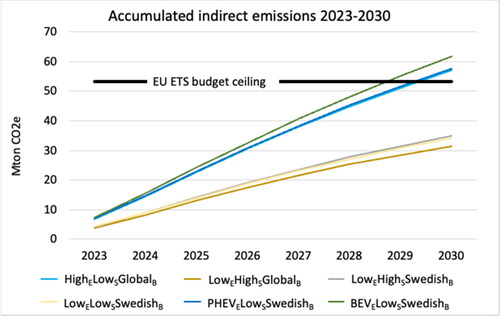
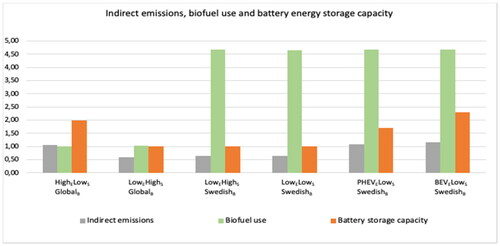
Figure 9. Accumulated indirect emissions 2023–2030, biofuel use and battery energy storage capacity in the scenarios. Indirect emissions are normalized against the long term EU ETS ceiling (see Section 5.2). Biofuel use and Battery storage capacity are normalized against the scenario minimum. In 2018, biofuel use was 6.1 times the scenario minimum, and battery storage capacity was 0.02 times the scenario minimum.
The following textual edit has been made on page 1.
The fourth bullet point in the abstract now reads:
Reducing direct emissions through a high production of electric cars causes tensions in relation to the European Emissions Trading System due to the indirect emissions that arise. It is therefore important to consider indirect emissions in policymaking.
The following textual edit has been made on page 4.
The following text has been removed:
Finally, the total emissions from adding and removing vehicles in the fleet 2030 are based on the number of cars needed to keep the fleet constant in terms of numbers of vehicles it includes in 2030, and does not include the effect of the path taken towards the respective futures.
The following textual edits have been made on pages 8–9.
The first two paragraphs under Section 5.2. Indirect greenhouse gas emissions now read:
The share of indirect emissions out of total emissions was 45% in 2018. In the three scenarios with high electrification, the share is 52–56%, considering the period 2023–2030, despite a smaller vehicle fleet but due mainly to high production of electric vehicles. In the scenarios with low electrification and a very much reduced car fleet, the share has fallen somewhat (see ).
About 40% of emissions are covered by the EU Emissions Trading System, EU ETS. Emissions within the system require emission allowances. The emission allowances are traded on a market, and the amount of emission allowances is decreasing every year. During the current phase of EU ETS (Directive (EU) 2023/959), emission allowances are reduced by 62% in 2030 as compared to 2005. The EU climate policy also includes a Carbon Border Adjustment Mechanism (CBAM) connected to the EU ETS. It is expected to hinder carbon leakage through a carbon pricing system applied on energy-intensive products imported into the EU (c.f. European commission 2021a). Most of the indirect emissions would either occur within the European Union’s Emissions Trading System (EU ETS), or within areas covered by the suggested EU Carbon Border Adjustment Mechanism (CBAM).
The following textual change has been made on page 10.
The two paragraphs preceding Section 5.3. Battery utilization and demand now read:
In , the accumulated indirect emissions 2023–2030 in the 2030-scenarios are compared to the EU ETS budget ceiling, provided the indirect emissions keep their share of total emissions within EU ETS. The approach has similarities to the one used by Pietzcker et al. (2021), addressing the transition of the EU power system until 2030. The EU ETS budget ceiling is calculated from Pahle et al (2023, Figure 1), and is based on the current regulations with a linear reduction of emission allowances from 2027 down to zero in 2039 as well as some assumptions regarding annulments of emission allowances from the market stability reserve (MSR). Since the population size in the EU is not expected to change to any greater extent between 2023 and 2030 (Eurostat, 2020), roughly the same numbers apply on a per-capita basis. The accumulated emissions 2023–2030 reaches the budget ceiling already around 2029 in all scenarios with high electrification, i.e. HighELowSGlobalB, PHEVELowSSwedishB and BEVELowSSwedishB (see ). EU has also decided to introduce an emissions trading system for buildings and road transport. The system is expected to start in 2027, but it may be delayed. We do not take that part into account in this article.
The following textual edit has been made on page 14.
The paragraph beginning with “Regarding the role of electric car sharing …” now reads:
Regarding the role of electric car sharing, it has been suggested to have great potential relating to emissions reductions (see Chen & Kockelman, 2016; Shaheen et al., 2019). In order to explore whether such effects would be significant on the level of the fleet as a whole, two alternative scenarios were created out of the low electrification, high sharing, and global biofuel scenario. In the first shared cars were BEVs and in the second ICEVs, while maintaining the total numbers of cars per category in the fleet as a whole. The difference between the two scenarios in terms of life cycle emissions was small, indicating a rather limited potential for the combination (shared electric) to achieve emissions reductions on the fleet level, even with a high level of sharing.
The following textual edits have been made on page 15.
The paragraph beginning with “The challenges with ramping up battery production …” now reads:
The challenges with ramping up battery production, with links to raw material availability was pointed to in the introduction. Attention needs to be directed to the development so that emissions reductions from rapid electrification of the passenger car fleets in some regions or countries does not come at the expense of reducing emissions elsewhere. The high electrification scenarios include a considerable level of use, with battery capacity in Swedish passenger cars growing to up to 15.1 times the global per capita level in 2030 (see Section 5.3). Adding the social and environmental impacts as well as the geopolitical risks related to raw material extraction and battery production (see, e.g., IEA, 2019b, p. 22), yields potential tensions in a development similar to the one in the high electrification scenarios. It is noteworthy that total battery capacity in the scenarios differ with a factor of two, with the highest level of use in the high BEV, low sharing, Swedish biofuel scenario and the lowest in the low electrification scenarios.
The paragraph beginning with “It should be noted that …” now reads:
It should be noted that higher battery utilization requires PHEVs’ share of distance traveled using electricity to remain at a high level (here 40%), despite penetration of new user segments, a behavioral issue relatable to that of car sharing. The future of PHEV UFs is highly uncertain and will depend on e.g. the extent to which PHEVs are used privately, charging infrastructure development, energy prices, etc. Therefore, it is important to continuously monitor PHEV UFs. It might even be necessary to implement directed policies aimed at creating incentives for a higher share of electric propulsion.
The first two paragraphs under Section 6.3. Indirect emissions and resource use now read:
The share of total emissions constituted by indirect emissions differs greatly between the three scenarios with high electrification and the three with low electrification. While the former have a significantly higher share for accumulated indirect emissions 2023–2030 compared to 2018, the latter have a lower share (see ). The reason is not only a higher share for electric cars, but also that the total vehicle fleet is larger in the high electrification scenarios (albeit still smaller than in 2018). Thus, the policy-recommendation by Dirnaichner et al. (2022), to aim at reduced passenger car fleet size is valid (even with a high share of electric cars).
In this article, we relate all indirect emissions to the EU Emissions Trading System, EU ETS (see Section 5.2). All indirect emissions after passing the EU ETS budget ceiling will require that other sectors within EU ETS reduce their emissions more. In a way, it means that when indirect emissions pass the EU ETS-ceiling, it lowers the ceiling for other sectors, since the total EU ETS budget is in principle fixed. All three scenarios with high numbers of electric cars pass through that ceiling already around 2029. The other three seem to be quite in line with EU ETS budget with zero-emissions in 2039. This is an indication that a fast increase of electric vehicles risks coming into conflict with other sectors, regarding the available room for emissions. In this paper, this is so despite the vehicle fleet being considerably smaller than in 2023. There are implications for targets and regulations that consider the vehicle use phase only. This includes the Swedish official target as well as targets of other countries and regions aimed at the transport sector specifically (cf. International Transport Forum, 2018 & 2021). While electric cars, and low-emission cars in general are favored by the use-phase scope, potential life cycle emissions reductions from, for example, sharing are not reflected in full. Hence, there is a risk for sub-optimization in the pursuit of reducing total emissions. Therefore, targets designed to include the whole life cycle may be an alternative (see e.g. Hawkins et al., 2013).
The following textual edits have been made on page 16.
The paragraph preceding Section 6.4. Fleet development now reads:
Finally, accumulated indirect emissions from electric power for vehicle propulsion range between 1.1 and 2.1 Mton CO2e in the scenarios and constitute a minor part of total indirect emissions (approximately 5%). The static approach used to estimate emissions from electric power (see Section 2.3.3), therefore has marginal effect on total indirect emissions. Still, future work could clarify the effect on emissions per unit energy from introducing electric cars at various levels in the region. In addition, in other regions of the world emissions per unit of electric power are higher. In those cases, a static method to estimate emissions from electric cars might be more problematic.
The text accompanying the fourth bullet point under Section 7. Conclusion now reads:
A rapid electrification is likely to increase the share of indirect emissions, as illustrated by the three high electrification scenarios, in which this share has increased to 52–56% during the period 2023–2030 as compared to 45% in 2018. This means that the scenarios with high electrification do not match the speed at which emissions allowances within the EU ETS are reduced, despite the vehicle fleet being considerably smaller than in 2018. This points to the need of addressing life cycle emissions from cars, and shows that using emission targets focused on use-phase emissions only, could contribute to unfeasible demands for reductions in other sectors included in the EU ETS.
The following textual edit was made on page 17.
The text accompanying the first bullet point now reads:
While emissions beyond the use-phase should be considered, emissions within an emissions trading system should be presented separately from emissions not within the system and from emissions within other emissions trading systems. Emissions outside the vehicle use phase need to be considered to ensure that emissions are reduced in an absolute sense and not merely transferred to other parts of the life cycle. Still, adding life cycle emissions together may be inappropriate in situations when part of the emissions from the life cycle in question is within an emissions trading system like EU ETS. The reason is that emissions reductions within one part of the trading system have immediate implications on the emissions allowed in other parts of the system. As a consequence, we present direct emissions and indirect emissions separately, but in the same figure, in this article. Our approach entail simplifications, since some of the indirect emissions are not within EU ETS, but it is a start regarding how this can be dealt with in the future. It should also be noted that even though we claim that this is the most reasonable way of presenting data at this point in time, policy changes, such as a reform of EU ETS, could change this. For example, in the latest reform of EU ETS, it was decided to create a new emissions trading system for fossil fuels used to power cars and heat buildings from 2027.
The textual edits described above necessitated the removal of one reference and the addition of two new references.
The following reference has been removed:
European Council. (2022). ’Fit for 55’: Council and Parliament reach provisional deal on EU emissions trading system and the Social Climate Fund. https://www.consilium.europa.eu/en/press/press-releases/2022/12/18/fit-for-55-council-and-parliament-reach-provisional-deal-on-eu-emissions-trading-system-and-the-social-climate-fund/.
The following references have been added:
Directive (EU) 2023/959 of the European Parliament and of the Council of 10 May 2023 amending Directive 2003/87/EC establishing a system for greenhouse gas emission allowance trading within the Union and Decision (EU) 2015/1814 concerning the establishment and operation of a market stability reserve for the Union greenhouse gas emission trading system (Text with EEA relevance), https://eur-lex.europa.eu/eli/dir/2023/959/oj
Pahle, M., Günther, C., Osorio, S., and Quemin, S. (2023, February 28). The emerging endgame: The EU ETS on the road towards climate neutrality. Available at SSRN: https://ssrn.com/abstract=4373443