
 ?Mathematical formulae have been encoded as MathML and are displayed in this HTML version using MathJax in order to improve their display. Uncheck the box to turn MathJax off. This feature requires Javascript. Click on a formula to zoom.
Abstract
Active school travel has been associated with a wide range of psychological and physiological benefits. However, many parents (particularly those of primary school children) are concerned about their children’s safety due to traffic and urban infrastructure. In this research, we collected information about the geographical school routes, the transportation mode, and the accompaniment status of children of a German primary school. Children and their parents also rated the overall safety of the entire school route. Our findings underline that even primary school children can travel actively to school (about two-thirds in our sample) if the routes to school are short enough and consist of a comparatively safe infrastructure. Children rated their school routes to be significantly safer than their parents did. Furthermore, we found evidence for differences with regard to specific aspects: For example, parents’ (but not children’s) safety perceptions are enhanced by a higher proportion of streets with reduced speed limits. Given that parents who feel the school route is unsafe are less likely to allow their child to travel to school alone, traffic calming measures appear one measure suitable to accommodate their concerns. In contrast to traffic-related issues as the subjectively most prevalent hazard, our survey points toward single-person crashes as a more common case that may be rather underestimated by parents.
Introduction
A rich body of research supports the notion of positive psychological and physiological effects of active school travel (i.e. walking, cycling, or riding a scooter, as compared to passive transportation modes, such as public transport of parents driving their children with a car; see Amiour et al., Citation2022; Aranda-Balboa et al., Citation2020; Cloutier et al., Citation2021, for overviews). Despite these positive impacts, the proportion of children walking or biking to school appears to be declining (Wangzom et al., Citation2023). In the US, only about 11% of children walk or bike to school (Kontou et al., Citation2020). However, there are huge differences between countries. For example, more than 90% of children in the Netherlands use active school travel modes (Helbich, Citation2017).
Consequently, researchers and practitioners examined the factors supporting or prohibiting active school travel. One of the most important aspects concerns the distance to the school (Wangzom et al., Citation2023). The closer the school is located to children’s location of residence, the higher the probability they walk to school. An overview by Wangzom et al. (Citation2023) implies that a high proportion of primary school children did walk a distance of about 1 km across various countries (e.g. The Netherlands: Aarts et al., Citation2013; Finland: Broberg & Sarjala, Citation2015; Canada: Guliani et al., Citation2015; Iran: Mehdizadeh et al., Citation2017; China: Sun et al., Citation2018; or Scotland: Waygood & Susilo, Citation2015), with 2 km representing the limit of a reasonable walking distance (Rodrigues et al., Citation2018). Thus, local and spatially close schools must be seen as one mandatory requirement for a successful implementation of active school travel.
Next to the actual distance, findings converge on traffic safety, crime-related safety, and lack of social support as barriers to active school travel (e.g. Amiour et al., Citation2022; Aranda-Balboa et al., Citation2020; Huertas-Delgado et al., Citation2017). Parents (as the main decision makers about the transportation mode, especially for primary school children) are less likely to allow their children to walk or cycle to school if they perceive the neighborhood or the traffic situation as unsafe (Larsen et al., Citation2013; Oluyomi et al., Citation2014; Wangzom et al., Citation2023).
Several studies also investigate the effects of the built environment on active school travel (e.g. Broberg & Sarjala, Citation2015). In studies linking mapping tasks with GIS data, for example, incomplete or missing sidewalks were found to represent an inhibiting factor, whereas parks and greenery have been identified as supportive factors (Ozbil et al., Citation2021; Larsen et al., Citation2013; also see Wilson et al., Citation2019, for a qualitative approach).
Effects of crash risk, perceived crash risk, and traffic infrastructure on active school travel
According to a report by the German Social Accident Insurance (which is responsible for all school-related accidents and crashes), there were ∼6.3% of road traffic-related crashes and accidents per 1,000 primary school children in 2022 (Deutsche Gesetzliche Unfallversicherung e.V., Citation2023). This proportion is actually lower than for any type of secondary school, most likely due to the shorter school routes and greater parental supervision. Next to incidents on the school route, this also includes any traffic-related incidents occurring during excursions, etc. The report does indicate that more than 50% of all incidents (irrespective of age and school type) involve a child riding a bike, whereas walking, riding a scooter, using public transport, or driving each account for between 7% and 12% of all incidents. Unfortunately, more specific data for primary schools are not provided. Finally, the report underlines that the number of actual traffic-related crashes on school routes does only account for <50% of all incidents: A high number of cases appear to be single-person crashes and accidents occurring on the sidewalk due to slipping, tripping, and falling, resulting mostly in minor injuries. As all available data is limited to cases that require professional medical attention, this may also imply that the proportion of such single-person incidents (e.g. those resulting in minor bruises not requiring medical attention) is actually underrepresented.
Concerning specific traffic infrastructure elements and attributes, high traffic volume and high car speeds are among the most frequently identified factors with a negative impact on both children’s and their parents’ perceived school way safety (Amiour et al., Citation2022; Benoit et al., Citation2021; Cloutier et al., Citation2021; Wangzom et al., Citation2023; Wilson et al., Citation2019). However, the evidence for the positive effects of traffic calming measures on the number of incidents appears to be mixed (Amiour et al., Citation2022). Similarly, the complexity and density of intersections have been identified as a source of risk (e.g. Guliani et al., Citation2015; Huertas-Delgado et al., Citation2017), as are intersections featuring traffic lights. A potential explanation is that traffic lights are installed at larger and complex intersections. The review by Amiour et al. (Citation2022) suggests that the effects of traffic lights on perceived safety are also mixed: Whereas they appear to increase the safety perception of parents (Rothman et al., Citation2015), this is not necessarily the case for children (Olvera et al., Citation2012). In an online mapping and questionnaire study from Finland, a higher intersection density decreased the probability of active school travel (Broberg & Sarjala, Citation2015). Dessing et al. (Citation2016) found that children’s preferred walking routes (identified via GPS tracking) contained more traffic lights but less zebra crossings as compared to the shortest possible route (identified by GIS analysis). Wilson et al. (Citation2019) report that students complained about specific street crossings (both with traffic lights or zebra crossings) due to the inattentiveness or recklessness of car drivers.
Another factor with potential relevance for school way safety concerns the accompaniment of the children on their way to school. Children were more likely to perceive crossing a busy road to be safe when traveling with their friends as compared to when traveling alone (Soori, Citation2000). In a qualitative interview study, Canadian children aged 11–12 years emphasized the positive aspects of sharing the school route with siblings, friends, or other students (Wilson et al., Citation2019). Parents also estimated the route to school safer when being able to accompany their child (Oluyomi et al., Citation2014).
Safety perceptions of primary school children and their parents
A recent literature review (Amiour et al., Citation2022) suggests that the overall number of studies investigating school way safety of children below the age of 12 is limited (for another literature review, see Wangzom et al., Citation2023). Primary school children are a particularly sensitive group with regard to traffic safety, as they are at a stage of increasing independence and autonomy, whereas their cognitive, perceptual, and motor capacities are still under development. For example, 6–9 year-old children have greater difficulties in estimating the existence, direction, and time-to-arrival of a car based on sound (Barton et al., Citation2013). Younger children also have greater difficulties to understand the behavior and limitations of others, such as a car driver’s blind spots (Twisk et al., Citation2013). For a detailed overview about children’s development of traffic related competence, see Schützhofer et al. (Citation2018). Cloutier et al. (Citation2021) conclude that the variability of the populations studied so far allows no clear answers.
A large proportion of the studies concerned with primary school children investigated only the parents’ perspective (as pointed out by Wilson et al., Citation2019). A high traffic volume, high traffic speed, and intersections are among the most frequently mentioned aspects of parental safety concerns. One study also identified negative impacts of specific crossing features, such as mid-block crossing, traffic lights, or school crossing guards on parents’ decision to allow their children to walk to school (Rothman et al., Citation2015).
Few studies focus on the perspective of children. Basbas et al. (Citation2009) report that Greek children in the sixth grade of their elementary school indicated traffic volume and speed, inadequate or missing pedestrian crossings, and parked cars as major deterrents (thus resembling closely to the perception of parents). A recent study from Germany interviewed primary and secondary school children with regard to their perceived school way safety and compared them with the perceptions of school management (Gössling et al., Citation2024). Primary school children in particular reported risks related to infrastructure (e.g. intersections), the organization of traffic (e.g. at construction sites), and the reckless behavior of other traffic participants (e.g. being overlooked by drivers ignoring traffic rules).
A limited number of papers aimed at comparing the perspectives of children and their parents with regard to school way safety. Their findings underline a high level of agreement concerning critical factors (with traffic volume, general distance, and crossing situations, but also crime and strangers, among the most frequently mentioned issues; see Larsen et al., Citation2013; Napier et al., Citation2011; Oluyomi et al., Citation2014; Olvera et al., Citation2012). In general, however, it appears that children rate traffic situations and their routes to school to be safer than their parents do (e.g. Olvera et al., Citation2012; Soori, Citation2000).
Aims
In this research, we focus on two aspects of active school travel that are as of yet less well investigated. First, we examine primary school children aged 6–10 years with regard to the safety perception of their route to school. Second, we compare their perceptions to that of their parents as the final decision makers about the transportation mode. Previous research suggests that children should be generally less concerned about traffic safety than their parents are. We aim at identifying commonalities and differences between children and parents’ safety ratings with regard to the used transportation mode, the accompaniment status, as well as aspects of the traffic infrastructure that have been found crucial by previous research. Our findings contribute to understanding how parents can be encouraged to allow their children to use active transportation modes to travel to primary school.
Data collection and methods
Ethics statement
The survey was conducted in compliance with the Declaration of Helsinki. More specifically, the purpose, structure, and procedure of the survey was officially approved by the school’s headmaster after a detailed presentation and before the survey was conducted. Participants (i.e. parents and children) were fully informed about the procedures and goals of the survey, and not deceived in any way. They were informed that their participation was completely voluntarily and that they could withdraw from the survey without negative consequences. There was no foreseeable physical or psychological harm resulting from participation. Parents were asked to provide their written, informed consent for further processing of the anonymized data for scientific purposes only. According to the guidelines of the German Research Foundation,Footnote1 the present study was thus exempt from a formal ethics approval. Similarly, with the headmaster’s approval and the parents’ consent, there is no requirement for researchers to obtain a police background check in Germany when conducting such a study.
National and local background
The survey took place in Freiburg im Breisgau, Germany, a university city with about 230,000 inhabitants involved in an ongoing expansion process, accompanied by a shortage of living space and rising real estate prices. Crime rates in Freiburg are high as compared to other parts of the federal state of Baden-Württemberg, in particular with regard to burglary and sexual offenses (Polizeipräsidium Freiburg, Citation2022). At the same time, Germany is considered to be a very safe country,Footnote2 and crime rates have been continuously declining throughout the last decades (Tonry, Citation2014).
Participants were recruited from a single public primary school located in a city district of about 7,900 residents (Haußmann, Citation2022). The average age in this district is 40.3 years (as compared to 40.9 years in all of Freiburg). On average, there are 21 children younger than 15 years for 100 potentially employable residents (as compared to 19.8 children in all of Freiburg). The proportion of residents with migration background is about 17%. No detailed information about average income was available. However, the district is considered attractive and mostly quite with few large streets. It consists mostly of old building apartments and some villas. Consequently, high rents lead to a high proportion of academics and upper middle class residents. Considering the background of this specific school district, we did not consider crime as a relevant factor with regard to active school travel.
The primary school investigated in this research has pupils from the first to the fourth grade. Almost all children in Germany start going to primary school at age 6 or 7 years and transfer to a secondary school at age 10–11. With four school classes for each school year, about 380 pupils visit the school. This is an above average size for German standards.Footnote3
According to German traffic laws, children up to 8 years using their bike must cycle on the sidewalk (which is standard element of German streets) and are allowed to use the sidewalk until the age of 10. It is widely recommended (but not required by law) that children do only use their bike in the company of adults until they complete a “bike exam” taking place in the third or fourth grade, which covers both theoretical knowledge about traffic rules and practical skills.
Consequently, a common mode of transportation for German primary school children are non-motorized scooters, which must be ridden on the sidewalk. (In contrast, e-scooters must be ridden on the street. However, they are not legal to use below the age of 14.)
Procedure and data collection
The survey was advertised by an email from the headmaster to all parents. Each set of questionnaires and maps (see Section National and local background for details) was put in a Din A4 envelope, and all teachers received packages of these envelopes they distributed among the pupils of their class in February 2022. The pupils were instructed to complete the survey at home with their parents and return them to their teacher.
A reminder email was sent after two weeks. After four weeks, 208 surveys were returned.
Materials
We prepared a paper-based survey that was distributed to all pupils by the teachers of each class. This survey consisted of several parts, which were filled out by the children and their parents at home and subsequently returned to school.
On the first page, the purpose and the structure of the survey were explained. It was emphasized that the children were supposed to respond to the survey as independently as possible because we were particularly interested in children’s opinions and impressions. Parents were allowed to support their children when working on the survey to ascertain a correct understanding of each item but requested to respect their child’s opinions even if those did not reflect their own perspective. As it was to be expected that most children aged 6–10 years would be unable to identify their place of residence and their route to school on a map correctly, parents were instructed to monitor the respective part of the survey more closely (again focusing on geographical correctness, but not their child’s expressed opinions about dangerous or safe locations). This page also included a section providing information about the anonymized and aggregated processing of the submitted data for scientific purposes. Parents were asked to provide their informed consent to this processing by signing the respective section.
The first part of the actual survey was directly addressed to the children. They were instructed to respond to all items to the best of their knowledge and to ask their parents for support if necessary. It was explicitly stated that they could opt out of responding to any item. They were asked to provide information about their gender, age, school year, the most frequent mode of transportation for the route to and from school, and whether they were accompanied by their parents or by other children. They were asked to rate how safe they feel on their entire route to school by marking one of five smileys with very unhappy to very happy expressions and corresponding colors changing from red to green.
The second part of the survey was concerned with a geographical assessment of the route to school. For this purpose, we prepared a map covering the school district (with the exception of a suburb located further south, see ). The location of the school was highlighted, as were traffic lights, zebra crossings, and public transport stops. Although highlighting safety-related traffic features could potentially bias the participants’ responses toward these features, we considered it necessary to provide spatial indicators that allowed matching the actual school route with the map as unambiguously as possible. From our initial inspection and preliminary interviews with parents and children, we reasoned that these traffic features were well-known and central elements of the school routes, thus making them more suitable than other landmarks (e.g. shops).
Figure 1. Illustration of map used in the survey.
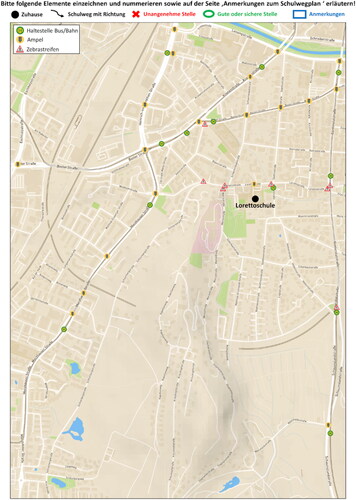
On the top of the map, there was a brief instruction how the children and their parents were to indicate and mark their home (with a black dot), the route to and from school (with a black line), uncomfortable locations (with red marks), comfortable or safe locations (with green marks), and other notes (with blue marks). The different color codes were thought to make the task more playful for the children. Additionally, many workbooks in German primary schools include tasks where children are supposed to mark, for example, different word groups with different colors. Open explanations corresponding to these markings could be provided on the following, empty page of the survey. A detailed account of these descriptions is beyond the scope of this research and will be presented elsewhere.
The third part of the survey was addressing the both parents. They were asked to provide an estimation of the duration of the route to school in minutes, as well as of the overall safety of their child’s route to school on the same scale used by the children. Finally, they were asked about crashes and accidents that happened to their child on the route to school.
Participants
Parents did not sign the informed consent in 24 cases. These cases were excluded from further analysis. There were also only two cases of children who were always driven to school by car, and they were excluded from all further analysis as well.
Of the remaining 173 children, 51% identified as girls, and one pupil as of diverse gender. We decided to exclude the case indicating a diverse gender from all computations including gender as a variable due to the lack of statistical power.
Concerning the school year, 26.6% were in their first school year (age: M = 6.8 years, SD = .5, range: 6–8), 28.3% in the second school year (age: M = 7.6 years, SD = .5, range: 7–8), 31.8% in the third school year (age: M = 8.5 years, SD = .5, range: 8–9), and 13.3% in the fourth school year (age: M = 9.5 years, SD = .6, range: 9–11), respectively. We decided to consider the children’s school year rather than their actual age in our analysis, with the reasoning that, for example, the switch from day care to primary school is the main factor driving changes in transportation mode and requirements, not the age in years. Similarly, the bike exam takes place in the fourth year, irrespective of a child’s biological age.
In another 16 cases, parents gave their consent but did not provide any other data (e.g. they did not rate the safety of the school route of their children). Thus, paired safety perceptions of children and their parents could be evaluated in a final dataset of 156 cases.
Digitalization and linking of GIS data
All information provided on the map (including additional statements provided on the following page of the survey) were manually transferred to QGIS 3.16 for further processing. In 23 cases, children indicated to travel on one route to school and back on another. In these cases, all parameters outlined below were summarized separately for both indicated routes.
The smileys representing the safety rating were recoded to range from 1 = red/very unhappy to 5 = green/very happy. In other words, higher values represent a safer school route. Descriptively, the safety perceptions of children (M = 4.15, SD = .89, range: 1–5) were higher than those of their parents (M = 3.27, SD = 1.05, range: 1–5). A Spearman correlation showed that the safety perceptions of children and their parents overlapped significantly, but were far from identical (r = .33, p < .001).
We applied a hexagonal grid with a diameter of 25 m to the area shown on the map (see ). We used OpenStreetMap to determine the prevalence of infrastructure elements that were potentially relevant for children’s safety perceptions, namely intersections, crossing aids, and speed limits, which were spatially joined to all respective hexagons:
Figure 2. Illustration of the digitalized school routes.
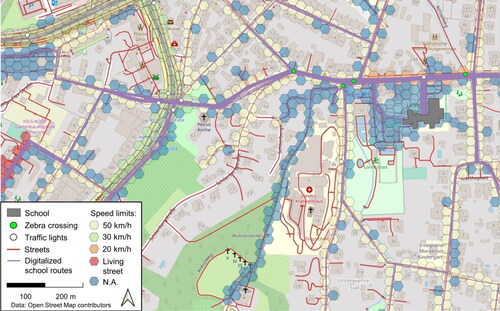
Intersections: All hexagons that encompassed at least one intersection of public streets used by motorized vehicles.
Traffic lights: All hexagons that encompassed at least one traffic light. It should be noted that all but a single traffic light were located at intersections.
Zebra crossings: All hexagons that encompassed at least one zebra crossing.
Speed limit: The speed limit was determined by the longest highway segment in each hexagon. We distinguished between the following speed limits: 50, 30, 20 km/h, Living Street (i.e. a street giving priority to pedestrians, with all vehicles being limited to “walking speed” of 5–10 km/h). Hexagons featuring no highway segments or no highway segments with speed limits (i.e. driveways) were labeled as “N.A.”
For each individual school route, we counted the number of hexagons as an approximation of the route’s length. This may result in minor misrepresentations of the metric length. However, we could only determine the metric length through the digitalized route that was indicated on the survey map. In other words, the available metric length represents an approximation of the true length as well. A Pearson correlation of the number of hexagons and the metric length of the indicated school route showed an almost perfect relation, r = .99, p < .001.
For each route, we counted the absolute number of hexagons featuring each of the mentioned infrastructure elements. We reasoned that the absolute number of infrastructure elements (e.g. traffic lights) was highly dependent on the length of the school route. Thus, we computed the proportion of hexagons featuring an infrastructure element relative to the total number of hexagons, separately for each school route.
Descriptive values of all variables are presented in .
Table 1. Descriptive information about school route variables, separately as absolute values and in proportion to the number of hexagons of the respective school route.
We did not consider several factors that were addressed in previous studies, mostly due to our focus on a single primary school. For example, we could not differentiate crime rates due to the rather narrow geographical focus. Similarly, sidewalks are consistently present in the entire study area.
Statistical approach
All analyses were conducted with Statistical Package for the Social Sciences (SPSS), version 28.
We considered the following issues when contemplating our statistical approach: The 5-level safety ratings represented an ordinal-scale dependent variable. As children and their parents can be expected to share a lot of variance, we decided to treat each pair as a random parameter with a single ID, with the respective safety ratings as a repeated measure. Our analysis included both categorical and continuous variables. We thus opted for a General Estimating Equations (GEE) model as the most suitable approach accounting for all mentioned issues. A detailed description of this model is provided in the section “Safety perceptions of children and parents.”
As a possible alternative, an ordinal regression procedure also would have allowed testing the assumption of parallel lines. However, we dismissed this approach as it does not allow the inclusion of repeated measurements or random effects. Using a generalized linear mixed model would have allowed accounting for repeated measures and random effects, but was incompatible due to the ordinal-level safety rating.
Results
Distributions of transportation mode, length, and accompaniment status
A descriptive inspection of the most frequent transportation mode across all school years showed that 29% walked, 29% used a scooter, seven percent used public transport, and seven percent rode a bike, with the remaining 29% indicating more than one transportation mode. The visualization of transportation modes in shows few discernible differences between school years, with the exception that a lower proportion of first graders travel by scooter.
Figure 3. Distribution of transportation mode by school year.
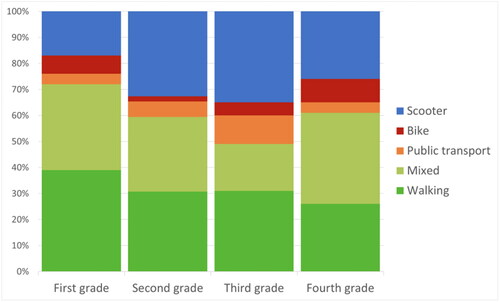
The literature review of Wangzom et al. (Citation2023) suggests that the length of the school route might affect the chosen transportation mode. implies that children walking to school had a noticeably shorter route than those traveling by bike or scooter, converging to the 1 km distance reported by other researchers (e.g. Aarts et al., Citation2013; Guliani et al., Citation2015; Mehdizadeh et al., Citation2017; Sun et al., Citation2018; Waygood & Susilo, Citation2015). Interestingly, the time estimated by the parents was about comparable for all three modes.
Table 2. Length and duration of school routes, separately for transportation mode.
Children using public transport or mixed transportation modes had longer routes to school and required more time for their school way. In other words, the transportation mode choice is clearly affected by the distance children have to travel to their school, with an average travel time of 10–15 min being an acceptable duration for parents and children.
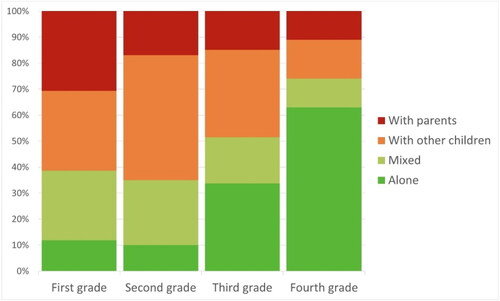
Concerning the accompaniment status, 24% indicated to walk alone, 20% with their parents, and 35% shared their route to school with other children. The remaining 21% indicated more than one option. The visualization of transportation modes in suggests that the proportion of children being accompanied by their parents decreases with the school year, whereas the proportion of children traveling alone increases with the school year.
Figure 4. Distribution of accompaniment status by school year.
Safety perceptions of children and parents
We now turn to a closer examination of the factors affecting the safety perceptions of primary school children and their parents, respectively. For this purpose, we computed a GEE model with the safety rating as an ordinal logistic dependent variable. Pairs of children and their parents were assigned a unique subject ID to account for their shared background, and their safety ratings were treated as a repeated measure variable, with an independent working correlation matrix. We included gender, school year, transportation mode, and accompaniment status as categorical factors. All variables linked to the school route were treated as continuous variables. “Route length” is based on the number of hexagons the individual route crosses. Speed limitsFootnote4 (e.g. “50 km/h”) and crossing aids (e.g. “zebra crossings”) represent the proportion of hexagons featuring the respective element for each school route.
We included interaction terms for the group factor (parents vs. children) and all other factors, respectively, to identify potential elements leading to differences between children’s and parents’ safety perceptions. In other words, a significant main effect indicates whether a given factor has an impact on the safety perception of both groups. A significant interaction effect indicates whether a given factor leads to children perceiving their school route to be more (or less) dangerous than their parents do. These considerations resulted in the following model:
Statistical information is provided in .
Table 3. Details concerning all parameter estimates in the generalized estimating equations model testing the effects of demographic and route variables on the safety ratings of children and their parents.
Effects of demographic variables
The model underlined the descriptive impression that children (M = 4.15, SD = .89) perceived their school route to be significantly safer than their parents (M = 3.27, SD = 1.05) did. There were neither main effects nor interaction effects that would have indicated that safety perceptions of children and parents were affected by either gender or school year.
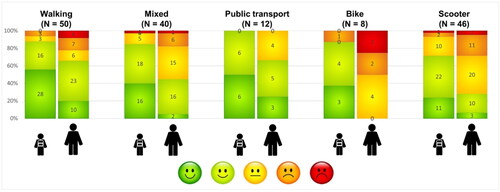
The safety ratings of children using mixed transportation modes or public transport did not differ significantly from those walking to school. The model indicates that riding a scooter or a bike was rated to be generally less safe than walking. The illustration of the safety ratings’ distribution across the different transportation modes in underlines these effects. There were no significant interaction terms in the model indicating differences between children and their parents. However, the visual inspection of implies that parents consider bicycles to be a less safe transportation mode than their children do. A general statistical trend in this direction did not reach significance due to the small number of children using this transportation mode.
Figure 5. Distribution of children’s and parents’ safety ratings, depending on transportation mode (with the respective number of children using this transportation mode in brackets).
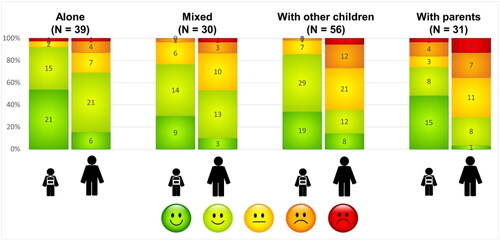
Concerning the accompaniment status, the parameter estimates suggest that traveling together with other children or together with the parents was perceived to be less safe than traveling alone, by both children and their parents. A visualization of children’s and parents’ safety ratings of the accompaniments is presented in . An inspection of this figure suggests that descriptively, parents rated the school route less safe when their children were accompanied by other children or themselves. In contrast, children’s safety ratings remained rather unchanged. However, this impression was not reflected in the statistical model.
Figure 6. Distribution of children’s and parents’ safety ratings, depending on accompaniment status (with the respective number of children indicating this accompaniment status in brackets).
Effects of infrastructure variables
We now turn toward the potential effects of traffic infrastructure on perceived school route safety. The statistical model shows that the actual length of the school route to school is not particularly relevant in this regard.
School routes were rated to be safer if the proportion of streets with a speed limit of 20 km/h was higher. A corresponding effect for streets with a speed limit of 30 km/h just missed significance (p = .06). This effect did not extend to living streets. Interestingly, there was also a significant interaction effect indicating that children did not feel safer due to a higher proportion of streets with a speed limit of 20 km/h (and a similar trend for streets with a speed limit of 30 km/h). In other words, traffic calming measures may be more appreciated by parents of primary school children than by the children themselves.
Finally, children’s and parents’ opinions converged on a higher proportion of intersections on the school way reducing the perceived safety (although this effect just missed significance, p = .06). The number of traffic lights had no discernible effects. There was also no main effect on the proportion of zebra crossings. However, an interaction effect indicated that children (but not their parents) felt that their route to school became significantly safer with a higher proportion of zebra crossings. It should be noted that this effect stands in contrast to frequent complaints related to zebra crossings children mentioned in the survey. We come back to this contradiction in the discussion section.
Self-reported crashes, single-person crashes, and near-misses
The vast majority (78%) of parents declared that their child never had a crash or accident on the route school. Near misses were reported by another 4.6%. There were two cases of crashes or collisions with other road users resulting in injuries (1.2%), and another six cases without injuries (3.5%). The number of these incidents are too low to allow for a more detailed analysis. There was a significant number of reports of single-person crashes (12.7%), for example, due to children slipping on wet roots or rubble. Most of these single crashes resulted in bruises. Fourteen of the 22 reported single-person crashes occurred to children riding a scooter, thus suggesting a disproportionally high risk of this transportation mode.
Discussion
Active transportation to school is widely considered to have highly positive effects on children (Amiour et al., Citation2022; Aranda-Balboa et al., Citation2020; Cloutier et al., Citation2021). The proportion of children using active transportation modes appears to be in decline, primarily due to parents’ concerns about traffic safety. Despite a rich body of literature on this topic, the knowledge concerning the needs and perceptions of primary school children (as well as their parents) as a particularly vulnerable group is still limited. In this research, we shed light on the factors impairing the perceived school route safety of primary school children and their parents.
Effects of transportation mode and accompaniment status on safety perceptions
Most importantly, we found that children perceived their route to school to be much safer than their parents did (in line with Olvera et al., Citation2012; Soori, Citation2000). It is not quite clear whether this discrepancy results from an underestimation of traffic-related dangers on the children’s side, or whether it reflects parents’ concern about their children’s safety.
We found some evidence for differences between different transportation modes and accompaniment types: Riding a bike or a scooter was rated to be less safe than walking. Noticeably, our survey did indeed reveal a higher number of single-person crashes when riding a scooter (see section “Findings about self-reported crashes and accidents”). Descriptively, parents were more concerned about children riding their bikes than the children were. Additionally, we found that whereas the distance children covered on their school route increased from those walking over those riding a scooter and those riding a bike, the overall time required for this route remained rather comparable across all transportation modes.
The school routes of children who traveled to school with either other children or their parents were rated less safe school routes of children traveling alone, by both children and their parents. At first glance, this effect appears surprising, because it could be assumed that parental supervision should lead to an increase rather than a decrease in perceived safety (as reported by Oluyomi et al., Citation2014). We assume that the causal direction is reversed: Parents escorting their children to school do so because they consider the route to school unsafe. Vice versa, children and their parents do not consider the way to school to be safer because the children are walking unsupervised, but because they consider the route to school to be sufficiently safe and manageable.
Effects of infrastructure on safety perceptions
A larger proportion of streets with a reduced speed limit (in particular a speed limit of 20 km/h, and a speed limit of 30 km/h showing a corresponding trend) increased the safety ratings. Arguably, reducing speed limits on streets close to primary schools appears to be a suitable measure to make parents confident to let their children travel to school actively and unsupervised. Interestingly, interaction terms suggest that these effects do not entirely extend to children’s safety ratings. Possibly, they are not yet aware of such regulations and their intentions in the first place. Younger children are also less able to judge the speed of approaching correctly (Barton et al., Citation2013).
Both children and their parents showed a strong trend in the direction that a higher number of intersections decreased the safety of the route to school. This impression appears justified considering that the majority of crashes and accidents are linked to intersections risk (e.g. Guliani et al., Citation2015; Huertas-Delgado et al., Citation2017). There was no evidence that traffic lights had a positive effect (thus contributing to the heterogeneous findings summarized by Amiour et al., Citation2022). Circumstantial evidence and explanations can be derived from the open comments children provided about challenges and dangers on their route to school. We noticed frequent complaints about short green light phases for pedestrians, cyclists running red lights, or reports about an intersection with a tramline in between the car lanes with a separate traffic light. At this intersection, the traffic lights could show green for the car lanes, but red for the tram lane due to an approaching tram. Taken together, it is clear that despite the apparently clear traffic routing by traffic lights, the actual situation can still encompass a wide range of uncertainties for primary school children.
Zebra crossings contributed significantly more to the safety perceptions of children than to those of their parents. At the same time, we received a large number of complaints about both cars and cyclists not stopping properly for children at zebra crossings, as well as about difficulties children had to deduce car drivers’ behavior and intention correctly (in line with Dessing et al., Citation2016; Wilson et al., Citation2019). Thus, our findings rather imply that children prefer zebra crossing to intersections without crossing support. Parents appear to be even more aware of the ambiguities of zebra crossings than primary school children are.
Findings about self-reported crashes and accidents
This research was not primarily focused on objective safety indicators. However, we asked parents to report crashes and collisions that had occurred to their children on the way to school. Given that parents rated the safety of their children’s school routes to be low to medium, the actual proportion of parents reporting crashes and collisions was rather limited. Crashes with other road users were also far less frequent than single-person crashes, most of which resulted from children slipping when riding their scooters over wet roots or potholes in the sidewalk (as reported by Deutsche Gesetzliche Unfallversicherung e.V., Citation2023). This may also be reflected in the lower safety ratings of children riding to school with their scooters as compared to other transportation modes. Nevertheless, a high proportion of children of all school years (even in the first grade) indicated to use scooters, covering noticeably longer distances than children walking to school. Interestingly, however, this did not extend to the parents’ ratings. In other words, traffic volume and speed appear to be a much more blatant and salient hazard as compared to the structural conditions of the built environment (additionally affected by weather and season), although the latter are responsible for a much higher proportion of incidents. One argument is the potentially higher severity of injuries resulting from a collision with another road user as compared to a single crash. However, our very limited dataset suggests that the majority of collisions with other road users did not result in injuries. In contrast, most single-person crashes resulted in bruises, but there were cases of cuts requiring stitches or broken bones as well. Thus, it could be concluded that there is a misrepresentation about hazard sources on school routes deserving further investigation. However, a promotion of active transportation for primary school children is more likely to be successful if it accounts for hazards and risks that are perceived as most pressing by parents. In line with previous research (Amiour et al., Citation2022; Benoit et al., Citation2021; Cloutier et al., Citation2021; Wangzom et al., Citation2023), our findings suggest that traffic calming measures and the design of safe intersections are central in this regard.
Limitations
We aimed at distinguishing between children’s own perspectives and perceptions of their route to school and that of their parents’ opinions as much as possible through the setup of the survey. It is clear that children aged six to eleven years old are strongly influenced by their parents’ opinions and perceptions. It is not clear to what extent parents influenced their children’s opinions when they worked on the survey. However, the safety ratings of children and their parents showed a significant, but limited level of correlation. Furthermore, our analysis point toward differences between children’s and parents’ safety perceptions. Thus, we argue that this confound is limited.
We distributed and advertised the survey equally throughout all classes. Nevertheless, the return quota in fourth grade classes was only about half as high as in the other school years. We have no proper explanation for this difference. However, older children are somewhat underrepresented in our sample.
Similarly, our sample may also be affected by an underrepresentation of children driven to school by car. There was only a small proportion indicating to use only this transportation mode. It is possible that parents feel ashamed admitting of driving their children to school. Thus, the overall proportion of driving for the entire school may be larger than for the sample that did return their completed surveys. However, the school principal discourages parents to drive their children to school and promotes active school ways. From the personal observation of the authors, it appears that the proportion of this transportation mode is indeed limited.
Conclusions
In this survey, we aimed at shedding more light on a group of children which has been as of yet underrepresented in the investigation of active school travel, namely primary school children. We compared their perceived school way safety to that of their parents. Our findings show that parents consider the school route of their children significantly less safe than their children do. Furthermore, we found evidence for differences with regard to specific aspects: Children’s safety perceptions are enhanced by more zebra crossings. Parents’ safety perceptions are enhanced by a higher proportion of streets with reduced speed limits on their children’s school routes. Our findings also suggest that it is not the case that parents are afraid when their children walk to school alone, but rather that parents who perceive the school route as dangerous will not let their children walk alone. Traffic calming measures appear one measure that can accommodate parents’ concerns. In contrast to the perception of traffic-related issues as the most prevalent hazard, our survey also points toward single-person crashes as a hazard that may be rather underestimated by parents.
Due to our goal to collect detailed information about school routes of primary school children on paper maps requiring the parents’ support, our research was focused on a single school. A greater generalizability could be achieved by upscaling the approach described here to all schools of an entire city. A survey on a city-wide level would require digital solutions for the collection of the school routes and subjectively dangerous locations to limit the workload of the data preparation (e.g. the bike barometer introduced by Benoit et al., Citation2021). Such a digital solution may come at the potential cost of limiting primary school children’s involvement in the process. However, this approach could provide insights into reasons leading to the decision pro (or contra) a specific transportation mode, which may be informed both by parental considerations and preferences as well as by geographical and infrastructural constraints (Mammen et al., Citation2014). It would also allow the inclusion of factors not considered in this research, for example, crime rates. Finally, the incorporation of walkability indexes or a formal analysis of the urban network based on Space Syntax measures (Ozbil et al., Citation2021) could enable the subsequent design of citywide school routes with traffic infrastructures that are particularly adapted to children’s needs, thus supporting safe and active school travel.
Acknowledgments
We thank Simon Lotz for helping with the digitalization of the school routes.
Disclosure statement
No potential conflict of interest was reported by the author(s).
Data availability statement
The data that support the findings of this study are available on request from the corresponding author. The data are not publicly available due to containing information that could compromise the privacy of research participants.
Notes
3 With 2.88 million pupils visiting about 15,500 primary in Germany, the average primary school is visited by about 186 children, see https://de.statista.com/statistik/daten/studie/235833/umfrage/grundschulen-in-deutschland/.
4 We avoided the problem of a perfect multicollinearity of the speed limit variables (i.e., that these values add up to 100%) by not including the proportion of hexagons without an identifiable speed limit.
References
- Aarts, M.-J., Mathijssen, J. J. P., van Oers, J. A. M., & Schuit, A. J. (2013). Associations between environmental characteristics and active commuting to school among children: A cross-sectional study. International Journal of Behavioral Medicine, 20(4), 538–555. https://doi.org/10.1007/s12529-012-9271-0
- Amiour, Y., Waygood, E. O. D., & van den Berg, P. E. W. (2022). Objective and perceived traffic safety for children: A systematic literature review of traffic and built environment characteristics related to safe travel. International Journal of Environmental Research and Public Health, 19(5), 2641. https://doi.org/10.3390/ijerph19052641
- Aranda-Balboa, M. J., Huertas-Delgado, F. J., Herrador-Colmenero, M., Cardon, G., & Chillón, P. (2020). Parental barriers to active transport to school: A systematic review. International Journal of Public Health, 65(1), 87–98. https://doi.org/10.1007/s00038-019-01313-1
- Barton, B. K., Lew, R., Kovesdi, C., Cottrell, N. D., & Ulrich, T. (2013). Developmental differences in auditory detection and localization of approaching vehicles. Accident; Analysis and Prevention, 53, 1–8. https://doi.org/10.1016/j.aap.2012.12.040
- Basbas, S., Kokkalis, A., & Konstantinidou, C. (2009). Perception of the traffic safety level provided in elementary school areas. WIT Transactions on the Built Environment, 107, 599–609. https://doi.org/10.2495/UT090531
- Benoit, S., Van de Weghe, N., Van Dyck, D. (2021). Environmental factors associated with perceived cycling safety of intersections, road segments and home-to-school routes of adolescents in Flanders. Cycling & Society Annual Symposium, Abstracts. Cycling & Society Annual Symposium. http://hdl.handle.net/1854/LU-8740518
- Broberg, A., & Sarjala, S. (2015). School travel mode choice and the characteristics of the urban built environment: The case of Helsinki, Finland. Transport Policy, 37, 1–10. https://doi.org/10.1016/j.tranpol.2014.10.011
- Cloutier, M.-S., Beaulieu, E., Fridman, L., Macpherson, A. K., Hagel, B. E., Howard, A. W., Churchill, T., Fuselli, P., Macarthur, C., & Rothman, L. (2021). State-of-the-art review: Preventing child and youth pedestrian motor vehicle collisions: Critical issues and future directions. Injury Prevention, 27(1), 77–84. https://doi.org/10.1136/injuryprev-2020-043829
- Dessing, D., de Vries, S. I., Hegeman, G., Verhagen, E., van Mechelen, W., & Pierik, F. H. (2016). Children’s route choice during active transportation to school: Difference between shortest and actual route. International Journal of Behavioral Nutrition and Physical Activity, 13(1), 48. https://doi.org/10.1186/s12966-016-0373-y
- Deutsche Gesetzliche Unfallversicherung e.V. (2023). Schülerunfallgeschehen 2022. Deutsche Gesetzliche Unfallversicherung e.V. https://publikationen.dguv.de/detail/index/sArticle/4757
- Gössling, S., Kees, J., Hologa, R., Riach, N., & von Stülpnagel, R. (2024). Children’s safe routes to school: Real and perceived risks, and evidence of an incapacity-incapability space. Journal of Cycling and Micromobility Research, 2, 100019. https://doi.org/10.1016/j.jcmr.2024.100019
- Guliani, A., Mitra, R., Buliung, R. N., Larsen, K., & Faulkner, G. E. J. (2015). Gender-based differences in school travel mode choice behaviour: Examining the relationship between the neighbourhood environment and perceived traffic safety. Journal of Transport & Health, 2(4), 502–511. https://doi.org/10.1016/j.jth.2015.08.008
- Haußmann, M. (2022). Statistisches Jahrbuch Freiburg 2022. Amt für Bürgerservice und Informationsmanagement, Abteilung Informationsmanagement. https://www.freiburg.de/pb/site/Freiburg/get/params_E-215682991/1631036/JAHRBUCH%20FINAL.pdf
- Helbich, M. (2017). Children’s school commuting in the Netherlands: Does it matter how urban form is incorporated in mode choice models? International Journal of Sustainable Transportation, 11(7), 507–517. https://doi.org/10.1080/15568318.2016.1275892
- Huertas-Delgado, F. J., Herrador-Colmenero, M., Villa-González, E., Aranda-Balboa, M. J., Cáceres, M. V., Mandic, S., & Chillón, P. (2017). Parental perceptions of barriers to active commuting to school in Spanish children and adolescents. European Journal of Public Health, 27(3), 416–421. https://doi.org/10.1093/eurpub/ckw249
- Kontou, E., McDonald, N. C., Brookshire, K., Pullen-Seufert, N. C., & LaJeunesse, S. (2020). U.S. active school travel in 2017: Prevalence and correlates. Preventive Medicine Reports, 17, 101024. https://doi.org/10.1016/j.pmedr.2019.101024
- Larsen, K., Buliung, R. N., & Faulkner, G. E. J. (2013). Safety and school travel: How does the environment along the route relate to safety and mode choice? Transportation Research Record: Journal of the Transportation Research Board, 2327(1), 9–18. https://doi.org/10.3141/2327-02
- Mammen, G., Stone, M. R., Buliung, R., & Faulkner, G. (2014). School travel planning in Canada: Identifying child, family, and school-level characteristics associated with travel mode shift from driving to active school travel. Journal of Transport & Health, 1(4), 288–294. https://doi.org/10.1016/j.jth.2014.09.004
- Mehdizadeh, M., Mamdoohi, A., & Nordfjaern, T. (2017). Walking time to school, children’s active school travel and their related factors. Journal of Transport & Health, 6, 313–326. https://doi.org/10.1016/j.jth.2017.01.012
- Napier, M. A., Brown, B. B., Werner, C. M., & Gallimore, J. (2011). Walking to school: Community design and child and parent barriers. Journal of Environmental Psychology, 31(1), 45–51. https://doi.org/10.1016/j.jenvp.2010.04.005
- Oluyomi, A. O., Lee, C., Nehme, E., Dowdy, D., Ory, M. G., & Hoelscher, D. M. (2014). Parental safety concerns and active school commute: Correlates across multiple domains in the home-to-school journey. International Journal of Behavioral Nutrition and Physical Activity, 11(1), 32. https://doi.org/10.1186/1479-5868-11-32
- Olvera, N., Smith, D. W., Lee, C., Liu, J., Lee, J., Kellam, S., & Kim, J.-H. (2012). Hispanic maternal and children’s perceptions of neighborhood safety related to walking and cycling. Health & Place, 18(1), 71–75. https://doi.org/10.1016/j.healthplace.2011.08.022
- Ozbil, A., Yesiltepe, D., Argin, G., & Rybarczyk, G. (2021). Children’s active school travel: Examining the combined perceived and objective built-environment factors from space syntax. International Journal of Environmental Research and Public Health, 18(1), 286. https://doi.org/10.3390/ijerph18010286
- Polizeipräsidium Freiburg (2022). Polizeiliche Kriminalstatistik—2022.
- Rodrigues, D., Padez, C., & Machado-Rodrigues, A. M. (2018). Environmental and socio-demographic factors associated with 6–10-year-old children’s school travel in urban and non-urban settings. Journal of Urban Health, 95(6), 859–868. https://doi.org/10.1007/s11524-018-0295-x
- Rothman, L., Buliung, R., To, T., Macarthur, C., Macpherson, A., & Howard, A. (2015). Associations between parents׳ perception of traffic danger, the built environment and walking to school. Journal of Transport & Health, 2(3), 327–335. https://doi.org/10.1016/j.jth.2015.05.004
- Schützhofer, B., Rauch, J., & Stark, J. (2018). The development of traffic competences—Do children need special infrastructure to be safe in traffic? Transactions on Transport Sciences, 9(2), 3–17. https://doi.org/10.5507/tots.2018.011
- Soori, H. (2000). Children’s risk perception and parents’ views on levels of risk that children attach to outdoor activities. Saudi Medical Journal, 21(5), 455–460.
- Sun, G., Han, X., Sun, S., & Oreskovic, N. (2018). Living in school catchment neighborhoods: Perceived built environments and active commuting behaviors of children in China. Journal of Transport & Health, 8, 251–261. https://doi.org/10.1016/j.jth.2017.12.009
- Tonry, M. (2014). Why crime rates are falling throughout the western world. Crime and Justice, 43(1), 1–63. https://doi.org/10.1086/678181
- Twisk, D., Vlakveld, W., Mesken, J., Shope, J. T., & Kok, G. (2013). Inexperience and risky decisions of young adolescents, as pedestrians and cyclists, in interactions with lorries, and the effects of competency versus awareness education. Accident; Analysis and Prevention, 55, 219–225. https://doi.org/10.1016/j.aap.2013.02.038
- Wangzom, D., White, M., & Paay, J. (2023). Perceived safety influencing active travel to school—A built environment perspective. International Journal of Environmental Research and Public Health, 20(2), 1026. https://doi.org/10.3390/ijerph20021026
- Waygood, E. O. D., & Susilo, Y. O. (2015). Walking to school in Scotland: Do perceptions of neighbourhood quality matter? IATSS Research, 38(2), 125–129. https://doi.org/10.1016/j.iatssr.2014.12.002
- Wilson, K., Coen, S. E., Piaskoski, A., & Gilliland, J. A. (2019). Children’s perspectives on neighbourhood barriers and enablers to active school travel: A participatory mapping study. Canadian Geographies, 63(1), 112–128. https://doi.org/10.1111/cag.12488