
 ?Mathematical formulae have been encoded as MathML and are displayed in this HTML version using MathJax in order to improve their display. Uncheck the box to turn MathJax off. This feature requires Javascript. Click on a formula to zoom.
ABSTRACT
Although Montessori is the most common unconventional education model, no multi-state study has compared standardized test proficiency of Montessori schools with districts. Here we report on this for the 10 states/regions with the most public Montessori schools (n = 195). In 3rd grade, Montessori schools were less proficient in math but more proficient in ELA. In 8th grade they were also more proficient on ELA and showed a trend to greater proficiency in math. Black, Hispanic, and economically disadvantaged students at Montessori schools were more proficient on ELA tests, and performed better or similarly on math tests, at both grade levels. Achievement gaps were generally smaller. Difference in percent proficient in 8th grade controlling for 3rd grade was consistently greater at Montessori schools than in districts. Potential reasons for the different performance of Montessori schools are discussed.
For better or for worse, standardized testing has taken on enormous importance in American schools. Although there are arguments that standardized testing has changed schooling for the worse (Au, Citation2013; Darling-Hammond, Citation2007; Haberman, Citation2010; Heissel, Adam, Doleac, Figlio, & Meer, Citation2019; Jones, Citation2007; Zhao, Citation2016, Citation2017), higher scores do predict better life outcomes, like higher earnings (Goldhaber & Özek, Citation2019; Hanushek, Citation2019). Furthermore, careful research suggests this may be causal: Having a teacher who raises test scores leads to better life outcomes for children (Chetty, Friedman, & Rockoff, Citation2014a, Citation2014b). These effects are small (for example, a one standard deviation improvement in teacher efficacy in a single grade raises age-28 earnings by 1.3%), but small effects can compound into meaningful differences. This does not necessarily mean that standardized tests have been a net positive, but such effects are used as a justification for them.
Researchers have also studied whether particular school programs, like “no-excuses” charter (Cheng, Hitt, Kisida, & Mills, Citation2017) or Waldorf (Larrison, Daly, & VanVooren, Citation2012) programs, produce or are at least associated with higher test scores. Waldorf is an example of a pedagogically progressive school program. Progressive schools use curricula and methods that individualize most instruction, often using project-based learning, and de-emphasize testing and grades (Tyack & Cuban, Citation1995, pp. 194–8). They take a constructivist stance, in that children are viewed as constructing their own understandings (Brooks & Brooks, Citation2001).
The most common and long-lasting progressive school model is Montessori (Debs, Citation2019), yet it has been studied very little, and the results (summarized below) have been mixed. There are both private and public Montessori schools in the United States; private ones charge tuition and are not required to administer state tests, whereas public ones are funded through taxes and must administer those tests and post results publicly. Therefore, we focus on public Montessori schools. Although they represent fewer than a fifth of all US Montessori schools, there are currently over 500 public Montessori schools in the United States (Debs, Citation2016c; National Center for Montessori in the Public Sector [NCMPS], Citation2014). A 2016 study estimated that 59% of these public Montessori schools were magnet or district schools, and the others were charter schools, with an average school size of 315 students (Debs, Citation2016c). Because public Montessori schools serve well over 100,000 children in 42 states,Footnote1 and the number of public Montessori schools has more than doubled in recent years (National Center for Montessori in the Public Sector [NCMPS], Citation2014), it is important to know how they perform, and proficiency on state tests is one metric. Below we describe Montessori education for unfamiliar readers, consider theoretical and empirical reasons why Montessori might or might not be associated with higher test scores, and then present the study. First, we acknowledge two weaknesses of this study.
The first weakness of this study is our data type. Obtaining district-level permission to view individual child test scores is difficult and costly, even within a state (Jacob et al., 2014). Privacy concerns mean many districts will not share them. Researchers have accessed individual child scores, but typically only for single districts or school types. As a first step, the approach taken here was to use publicly available aggregated data. Such data are one way to gauge school performance (Jacob et al., 2014). Here we use percent proficient metrics, which are highly problematic in some circumstances since states can change cutoff scores from year to year (Ho, Citation2008; Holland, Citation2002); those circumstances do not apply here because we compared schools with their districts, for which benchmarks are the same. The advantages of using percent proficient are that it allows cross state comparisons (since many states do not report scaled scores) and has the same range across topics, grades, and districts. Thus, we record the percent of students proficient in math and English Language Arts (ELA, or its equivalent such as reading) for 3rd grade, the lowest grade when tests are mandated, and for 8th grade, the highest grade when successive annual tests are mandated. We did not use scores from high school because very few public Montessori schools extend past middle school. Although states set their own benchmarks, Montessori schools are compared with all non-Montessori schools in their surrounding districts, controlling for demographics. This is not a perfect approach; it provides one angle on the issue. An attendant strength is that it allows us to examine performance at almost 200 Montessori schools across many states.
Second, selection effects are a weakness of this study, since most public Montessori schools are choice schools. Montessori schools tend to have slightly wealthier and Whiter populations because those families seek out Montessori (Debs, Citation2019). Although these obvious features can be (and are, in this study) controlled for, other hidden characteristics like (perhaps) family values that lead one to choose Montessori might be responsible for any effects found. In other words, if Montessori students do differently on standardized tests, it might be because the family does or does not value some characteristic, like academic achievement, and this value causes children’s scores. We do not know any ways in which Montessori parents systematically differ on unobserved variables like this. Two studies gave Montessori and conventional school parents many different questionnaires (personality, values, parenting styles, etc.) to reveal such differences but failed to find any (Denervaud, Knebel, Immordino-Yang, & Hagmann, Citation2020; Dreyer & Rigler, Citation1969). Random lottery studies are the only sure way to control for unobserved differences, but there are to our knowledge are only three random lottery studies of Montessori education. Two used high fidelity public Montessori programs, and both found better results in preschool; the one that also tested 6th graders found that Montessori students did significantly better only on a writing task and social measures, but not on several Woodcock Johnson tests including Applied (Math) Problems and Letter Word (Lillard & Else-Quest, Citation2006; Lillard et al., Citation2017). The most recent lottery study used French public preschool classrooms that lacked many Montessori materials (particularly math ones) and where the teachers had no formal Montessori training; under these circumstances, Montessori students had superior results in literacy only (Courtier et al., Citation2021). Overall, lottery studies suggest Montessori schooling can cause better performance at earlier ages, but only one lottery control study has included older children. It had only a few positive results. Although lottery studies are ideal to address selection effects, they are rarely feasible, and other studies can still be of interest.
Our purpose is to see if the percentages of children meeting their state’s standard for proficiency differ at Montessori schools because if they do differ, it should encourage further research examining change in individuals’ scores over time (as Culclasure, Fleming, & Riga, Citation2018 did for South Carolina public Montessori programs) and/or encourage using scaled scores from the subset of states which report them. Although the present study cannot provide evidence that schools cause changes in test scores, it could lay the groundwork to see if a clearer causal design is worth implementing.
Montessori schooling
Montessori education is a complex, deeply thought-out system developed in the early decades of the last century by an Italian physician and her collaborators, based on close observation of children and their responses to curated materials and an evolving set of environmental conditions (Lillard & McHugh, Citation2019a, Citation2019b; Montessori, Citation2017). The children Montessori initially observed were atypically developing; the next group consisted of lower income students; and eventually Montessori worked with children of all social classes in Europe, America, and Asia, including 9 years in India during and after World War II. Her biology background engendered a systems view in which development is the unfurling of new capacities, adapting organisms to the environment at multiple levels. Hence, the Montessori educational environment is carefully constructed to respond to developmental needs at each stage of development, resulting in classrooms for children under age 3 and for each subsequent 3-year age span. The teacher’s role is not to tell information so much as to connect children to materials in the environment, which are self-correcting (meaning students can recognize their mistakes themselves, without teacher correction) and enlighten children through their repeated use. Montessori education leaves children free to choose their own activities, reasoning that an unperturbed organism will be in touch with its own developmental needs. Free choice comes with the caveat that one makes constructive choices, which (in Montessori theory) an undisrupted organism will. Furthermore, the freedom a child has in Montessori exists in the context of a tight structure; there are particular ways to use the materials, for example, and limitations on what choices a child can make, but a child is free to make any of the permitted choices. There are no grades or gold stars as Montessori believed these would perturb development; instead, learning is its own reward. There are also no explicit tests; the goal of Montessori education is human development, not acquisition of information that is amenable to testing. However, despite this different goal, public Montessori schools must administer standardized tests annually in accordance with federal law, making them sites for the current study. For further insight on the Montessori approach, readers are directed to videos at Montessori-guide.org, a logic model (Culclasure, Daoust, Cote, & Zoll, Citation2019), and books by Maria Montessori.
Why Montessori might differ in levels of test score proficiency
There are both theoretical and empirical reasons to expect public Montessori schools to have different levels of proficiency on the standardized tests that all public schools must administer. Theoretically, Montessori has several features (Culclasure et al., Citation2019) that have been shown in empirical work to improve academic and social-emotional outcomes; having better social-emotional outcomes has, in turn, been associated with better academic outcomes (Blair & Raver, Citation2015). For example, Lillard (Citation2017) explained how Montessori involves embodied cognition (learning occurs through acting on materials), self-determination and free choice, learning topics of personal interest, cultivating one’s executive function, contextualized learning, ample peer engagement, a highly organized environment, and warm, loving adults who tightly structure children’s experiences–all features with strong evidential support for improved outcomes (see also Darling-Hammond, Flook, Cook-Harvey, Barron, & Osher, Citation2020; National Academies of Sciences Engineering and Medicine [NASEM], Citation2018).
On the other hand, Montessori is sometimes criticized for being too free, like discovery learning programs, which are typically not successful (Alfieri, Brooks, Aldrich, & Tenenbaum, Citation2011; Chien et al., Citation2010; Klahr & Nigam, Citation2004; Mayer, Citation2004; Stockard, Wood, Coughlin, & Rasplica Khoury, Citation2018; Winsler & Carlton, Citation2010). Montessori has also been criticized for a lack of pretend play, sometimes considered crucial for development (Elkind, Citation1983; but see Lillard et al., Citation2013; Lillard & Taggart, Citation2019). Some research shows negative effects of mixed-age classrooms (Checchi & De Paola, Citation2018), which could suggest Montessori schools would do less well on performance measures. Further, frequent testing is associated with better learning (Yang, Luo, Vadillo, Yu, & Shanks, Citation2021), and Montessori minimizes testing. For all these reasons, one might expect children at Montessori schools to perform worse on standardized tests.
Moving to empirical reasons, one might expect better performance because some empirical studies have shown better outcomes for children in public Montessori schools. The most stringent are the lottery control studies already reviewed, which showed better or similar outcomes, but only one went beyond kindergarten and it showed positive results on social and writing measures but not math and reading. However, the sample was small and limited to one Montessori school. In addition, the lottery studies used outcomes selected by researchers (like the Woodcock–Johnson test), not mandated state exams, and researcher-selected tests are typically associated with larger effects (Kraft, Citation2020).
Other studies used state exams but did not have lottery waitlist controls; they had mixed results. One study examined a Montessori school in “a large urban district in western New York” (Lopata, Wallace, & Finn, Citation2005, p. 8) state. Because there was only one public Montessori school fitting that description at the time, clearly it was the public Montessori school in Buffalo, whose website (viewed by the last author in 2006) indicated it was using non-Montessori practices like homework, grades, and specials. Using standardized scores for math and ELA, researchers found worse results in ELA for Montessori in 8th grade but no difference in math, nor in either subject in 4th grade (Lopata et al., Citation2005). Another study compared more than 500 students in two public Montessori schools to a similar number of students in other demographically comparable public schools in the same district (Mallett & Schroeder, Citation2015). No significant differences were found in reading or math in first, second, or third grades, suggesting the samples were equal at the outset. Montessori students scored significantly higher in both reading and math in fourth and fifth grades. As these studies are limited to one or two Montessori schools, they may reflect more about the schools themselves than Montessori pedagogy.
In one of the only long-range studies, Dohrmann, Nishida, Gartner, Lipsky, and Grimm (Citation2007) examined high school students from a single district (Milwaukee Public Schools) who had attended one of two Montessori schools through 5th grade. The Montessori alumni performed better in math/science than their high school classmates but similarly in English/social studies.
The largest study (Culclasure et al., Citation2018) of Montessori pedagogy’s effect on standardized test scores involved over 7,000 children in the state of South Carolina. The study examined third through eighth - grade standardized test scores across three school years for Montessori programs in 45 public schools, including charter and traditional public schools; most were Title-I schools. One set of analyses simply compared the scores to those of all other public school students in the state, controlling for gender, race, ESL status, special education, and free/reduced lunch status. In a separate set of analyses, Montessori students were matched with other public school students on those demographics and their prior year’s scores in each subject. In both sets of analyses, Montessori students performed significantly better on ELA in every year; in math, they performed better in the matched analyses on two of the three years. In fact, across 28 different analyses, 16 were significantly different, and 15 of these favored Montessori. In 9 of 14 sets of analyses, contrary to what one might expect, larger effect sizes were obtained when samples were matched than when state scores were used for the comparison (Culclasure et al., Citation2018). This study also found compellingly better performance for Black and lower income students attending Montessori schools.
Although this last study and the lottery studies control (at least to a degree) for selection effects, the present study does not, and (as stated earlier) self-selection is another theoretical reason why Montessori could be associated with higher test scores. Montessori is very rarely the default option; families must select into them. Although two studies (Denervaud et al., Citation2020; Dreyer & Rigler, Citation1969) seeking specific characteristics of Montessori-selection families failed to find any, we expect there are some. If unobserved variables associated with selecting Montessori schools lead to higher test scores, then one would expect to see Montessori students score more highly at all ages. For example, families that read more might be particularly drawn to Montessori, and the home reading might lead to higher literacy proficiency at Montessori schools at both third and eighth grade; alternatively, families that engage in more home math activities might be drawn to Montessori, leading to higher levels of math proficiency at both levels. The aforementioned lottery studies (Lillard & Else-Quest, Citation2006; Lillard et al., Citation2017; for literacy only, Courtier et al., Citation2021) and the well-controlled Culclasure et al. (Citation2018) study suggest that the curriculum itself causes higher scores in both domains, but the present study design cannot support causal claims.
Student body composition differences in Montessori and non-Montessori schools
Black, Hispanic, and lower income children in the United States often do less well on academic achievement measures than White children and middle-income children (Ansari & Winsler, Citation2014; Carnevale, Fasules, Quinn, & Peltier Campbell, Citation2019; Duncan, Magnuson, Murnane, & Votruba-Drzal, Citation2019). While the reasons for this are complex and widely believed to stem from opportunity gaps (Duncan & Murane, Citation2014), the goal to eliminate them is incontestable, which raises the question whether different subgroups perform differently in Montessori. There are theoretical reasons why they might. As mentioned, in Montessori education much of the teaching is done by materials, not people. Teacher expectations are an important determinant of children’s progress in conventional settings (Good, Sterzinger, & Lavigne, Citation2018), and reducing the role of the teacher in conveying learning might particularly help children who are often recipients of bias (Dee & Gershenson, Citation2017). Second, Montessori practices “looping” in which children and teachers stay together for 3 years. This has been shown to be helpful to all children, with some of the largest gains being made by what the study described as “minority” children (Hill & Jones, Citation2018). Over half of children in public Montessori schools are students of color (Debs, Citation2016c), and some studies suggest that such children might in fact do particularly well in Montessori settings. In addition to the Culclasure et al. (Citation2018) study mentioned above, Brown and Lewis (Citation2017) compared eight years (2006–2014) of third-grade reading and math scores from African American students at three Montessori magnet and conventional magnet schools matched for demographics. Montessori students outperformed their district peers in reading. No significant differences were found between the Montessori and conventional schools for math; on average, both the Montessori and the control schools (which included a STEM school) performed .57 standard deviations above the district mean. Another study suggested that less racial disproportionality in discipline exists in public Montessori schools (Brown & Steele, Citation2015). Since discipline typically means suspension from class, this suggests Black children miss proportionately less class time in Montessori, which might assist learning. These results suggest that Montessori might be beneficial for Black students in particular. CitationAnsari and Winsler (2014, Citation2020) found that while a single year of a Montessori preschool was associated with higher gains than a single year of HighScopeFootnote2 for Hispanic students in kindergarten and 3rd grade, for Black students the two programs were equally beneficial. In sum, although in theory Montessori could better support children of color, results for Black students are mixed, and more data on whether they do better in Montessori is important to gather. For Hispanic children, there are very few published results, and getting more information is warranted.
In addition to different racial groups, how economically disadvantaged children fare in Montessori schools is of interest. All three of the lottery studies involved economically disadvantaged children. In one longitudinal lottery study cited above, the academic scores of the lower income half of the Montessori sample approached those of higher income children by the end of kindergarten (Lillard et al., Citation2017). The samples in both of the other lottery studies included significant proportions of lower income children and both showed positive results from Montessori in reading (Courtier et al., Citation2021); one showed positive results in math and social-emotional development as well (Lillard & Else-Quest, Citation2006). Based on the empirical literature and theory, we hypothesized that economically disadvantaged, Black, and Hispanic children would do relatively well in Montessori, and also show smaller gaps with higher income and White children, respectively.
Summary
Overall, empirical studies are inconsistent regarding Montessori school performance on standardized tests, and there are theoretical reasons to think many different patterns of results are possible. It is important to extend analysis beyond single schools and districts to multiple states. We did so using internet-published state databases from US states with many public Montessori schools. Because consecutive federally mandated tests begin in 3rd grade and end in 8th grade, and our resources were limited, we focused on 3rd and 8th grade scores in the 10 states/regions with the most public Montessori schools. Because results at small schools can vary widely across consecutive years and some public Montessori schools are small, we collected them for the most recent three pre-Covid years (2017–19). We examined both overall proficiency and the difference in proficiency levels at 8th grade when accounting for proficiency in 3rd grade, as well as data disaggregated for three subgroups: Black, Hispanic, and economically disadvantaged. Achievement gaps in percents proficient were examined as well.
Method
School selection
First, we identified the 10 states with the most public Montessori schools by consulting the Montessori Census, an online database of US Montessori programs (National Center for Montessori in the Public Sector [NCMPS], Citation2019). Results were filtered to include only public schools with 3rd and/or 8th grade Montessori as whole school programs (some otherwise conventional schools include isolated Montessori classrooms). A count of the number of schools meeting criteria for all 50 states and Washington, D.C. revealed that California, South Carolina, Michigan, Colorado, Texas, Florida, Arizona, Minnesota, Wisconsin, and the metropolitan Washington, D.C. region (including Maryland and Virginia public Montessori schools) had the most Montessori schools. Although fairly complete, the Montessori Census does not include every public Montessori school. We then supplemented it using the records of the 2012-13 Whole-School Montessori and the American Public Montessori Historical data sets for those states (Debs, Citation2016a, Citation2016b). This resulted in 229 schools whose websites were checked to ensure they were whole school Montessori programs at 3rd and/or 8th grade; this eliminated 33 schools, and a 34th was excluded because it closed during data collection. The final sample was 195 Montessori schools.
Next, each school’s district was identified by searching the web for the school and for publicly available state databases. Comparisons were made between Montessori schools and their districts rather than with specific non-Montessori schools because we did not have adequate information to allow us to accurately pair individual schools, nor is it clear that doing so would be desirable given that individual schools can offer different types of programs; comparison with the district average gives a comparison of Montessori with all district non-Montessori schools. If a Montessori school was the only school in its district (as for some charter schools), the geographically closest district was used. Because some districts have more than one Montessori school, the comparison set included 119 districts. Data were collected for three school years (2016–2017, 2017–2018, and 2018–2019) from publicly available school report card databases (Arizona Department of Education [ADE], Citation2019; California Assessment of Student Performance and Progress [CASPP], Citation2019; Colorado Department of Education [CDE], Citation2019; Florida Department of Education [FDE], Citation2019; Maryland State Department of Education [MSDE], Citation2019; Michigan School Data [MSD], Citation2019; Minnesota Department of Education [MDE], Citation2019; National Center for Education Statistics [NCES], Citation2019; Office of the State Superintendent of Education: DC [OSSE], Citation2019; South Carolina Department of Education [SCDE], Citation2020; Texas Education Agency [TEA], Citation2020; Virginia Department of Education [VDE], Citation2019; Wisconsin Department of Public Instruction [WDPI], Citation2020). District data were statistically adjusted to remove the Montessori contribution by using the following equation:
where Mb was the percent of students proficient in the district not enrolled in Montessori, Mc was the percent of students proficient in the school district (including Montessori students), Ma was the percent of students proficient in the Montessori school, and p was the percent of Montessori students enrolled in the district. When there was more than one Montessori school, the equation was expanded upon as follows:
Demographics
Ninety-nine Montessori schools had both 3rd and 8th grades, 92 included just 3rd, and 4 included just 8th grade. For each school and district that reported the information, the percentage of students by race and socioeconomic status were recorded. For analysis, the percentage of students historically affected by the racial opportunity gap was calculated. This group included American Indian/Alaskan Native, Black, Hispanic, and Hawaiian/Pacific Islander students. Multiple race students were included in this group as well. Researchers have documented the opportunity gaps between each of these groups of students as compared to White students, even when socio-economic status is the same (Carnevale et al., Citation2019; Pang, Han, & Pang, Citation2011; Powers, Citation2005). Asian students were not included in this group because although Asian children do face racial discrimination in the United States, research has shown that Asian children perform as well or better than their White peers on measures of academic achievement (Pang et al., Citation2011; Powers, Citation2005). On average, in the Montessori schools 45.75% of the students were historically affected by the racial opportunity gap, compared to 49.78% for districts, t(937) = 2.30, p = .02, d = .15. The percentage of economically disadvantaged students (as determined by each state) also differed between the Montessori schools (M = 38.94%) and districts (M = 47.09%; t[858.35] = 5.42, p < .001, d = .36). Because these differences are themselves associated with levels of proficiency in state tests, they were accounted for in analyses.
Academic performance
Academic performance was operationalized as the percentage of students proficient on ELA (ELA) and math state - standardized tests in 3rd and 8th grades. Although each state sets its own proficiency benchmarks, states also use different tests and change tests periodically so this metric enables comparisons when individual level standardized scores are not available. As noted, district proficiency levels were recalculated to remove Montessori school performance.
Treatment of missing data
Data are withheld when a group is small, leaving some missing data. Where other Montessori schools in the district reported data, values were imputed with regression to create an estimated score. These imputed scores were used to remove Montessori student performance from and correct the district data, but they were not included as Montessori school scores in analyses. If all the Montessori schools in the same district were missing a datapoint, the district’s matching datapoint was eliminated.
Analysis
Except where noted, all data were analyzed using repeated measures analyses of covariance (ANCOVAs) in SPSS or R, covarying percentages of students historically affected by the racial opportunity gap and of economically disadvantaged students. These were followed up with Tukey’s post-hoc comparisons, and effect sizes were calculated with adjusted means. The basic ANCOVA equation was:
where represents the observed reading/math score for the
th school at grade 3 or grade 8,
represents whether the
th school is a Montessori school (1: yes; 0: no), and
is the error term. The coefficient
was tested to see how Montessori affected scores at grade 3 or 8.
The normality and equality of variance assumptions for the ANCOVA procedure were checked before running the analysis (see Appendix). The data were symmetric and balanced, but there was more variance in the Montessori data as would be expected since (1) there were more Montessori scores and (2) districts are composed of many schools, which would itself lead to smaller variance within districts across years. However, ANCOVA is robust to the violation of normality and homogeneity of variance assumptions, especially when data are symmetric and balanced, so it is appropriate to use ANCOVA. Still, to check if this influenced results, our first set of models was checked against models that added grade level enrollment data as a covariate.
Results
First, we examine overall proficiency of Montessori schools and districts on standardized ELA and math tests at 3rd and then at 8th grade. Next, we examine this for subgroups of Black, Hispanic, and economically disadvantaged students. We then examine Black/White and economic achievement gaps. Finally, we examine the percent proficient in 8th grade in each school/district controlling for the percent proficient in 3rd grade in that same school/district.
Enrollment is greater in districts than in schools. To examine the effect of enrollment size, we ran all models with and without enrollment as a covariate. There was very little change in model fit; therefore, we reported the original results that did not account for enrollment.
Overall results
Controlling for the percentage of economically disadvantaged students and those historically affected by the racial opportunity gap (as defined here), there was a significant main effect indicating that a higher percentage of non-Montessori students were proficient on state standardized tests at 3rd grade, F(1, 816) = 7.94, p = .005, ηp2 = .01. There was also an interaction between Montessori (yes/no) and test type (math/ELA), F(1, 816) = 143.36, p < .001, ηp2 = .15. Follow-up tests indicated that a slightly greater percentage of Montessori students were proficient in 3rd grade ELA (est. marginal means, 47.05% vs. 44.95%, mean difference = 2.10, SE = 1.04, p = .044, d = 0.13), and a much larger percentage of district students were proficient in 3rd grade math (est. marginal means, 43.90% vs. 52.04%, mean difference = −8.14, SE = 1.19, p < .001, d = .47). Effect sizes for the overall and subgroup results are in .
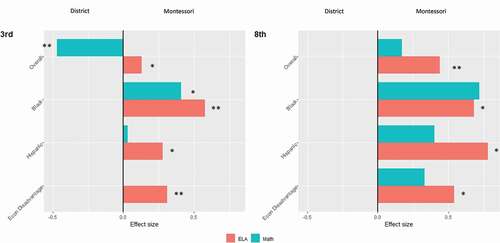
In 8th grade, a greater percentage of students in Montessori school were likely to test above proficiency thresholds, F(1, 349) = 10.58, p = .001, ηp2 = .03. There was also an interaction between Montessori (yes/no) and test type (math/ELA), F(1, 349) = 5.36, p = .021, ηp2 = .015. A significantly greater percentage of Montessori students were proficient in ELA (est. marginal means, 53.38% vs. 45.70%, mean difference = 7.68, SE = 1.58, p < .001, d = .44), but the greater percentage of Montessori students who were proficient in math (39.41%, vs. 36.07%) was not significant (mean difference = 3.34, SE = 2.03, p = .10, d = .17).
Subsamples
Black
Again controlling for the covariates of economic disadvantage and race, among Black students, a significant main effect in 3rd grade indicated a higher percentage of Black students were proficient on the tests at Montessori schools than in the other district schools as a whole, F(1, 147) = 8.65, p < .05, ηp2 = 0.06. There was no significant interaction between Montessori and the test. A group difference was observed for Black students on both 3rd grade ELA (est. marginal mean 36.16% vs. 27.17%, mean difference = 9.00, SE = 2.78, p = .001, d = .58) and 3rd grade math tests (est. marginal means 38.01% vs. 30.44%, mean difference = 7.57, SE = 3.31, p = .023, d = .41). At 8th grade, although effect sizes were larger, smaller sample sizes rendered the main effect and interaction between pedagogy and test type insignificant. Because the effect sizes were large (Kraft, Citation2020), exploratory follow-up tests were conducted. A greater percentage of Black Montessori students were proficient on 8th grade ELA tests (est. marginal means 41.91% vs. 28.74%, mean difference = 13.18, SE = 5.43, p < .018, d = .68), and a trend (with a large effect size) were observed for math (est. marginal means 32.82% vs. 18.83%, mean difference = 14.00, SE = 7.37, p = .066, d = 0.72).
Hispanic
There was no significant main effect for Hispanic students in 3rd grade, but there was an interaction between Montessori (yes/no) and test type (math/ELA), F(280) = 7.65, p = .006, ηp2 = .03. A significantly greater percentage of Hispanic Montessori students were proficient on 3rd grade ELA tests (est. marginal means, 43.54% vs. 39.02%, mean difference = 4.52, SE = 2.00, p = .024, d = 0.28), but no significant difference was found for math. At 8th grade as well, there was a significant main effect, F(1, 78) = 7.04, p = .010, ηp2 = .08, but no Montessori X Test interaction. A significantly greater percentage of Hispanic 8th grade Montessori students were proficient on ELA tests (est. marginal means 52.12% vs. 38.88%, mean difference = 13.23, SE = 3.68, p = .001, d = .78), but there was no difference for 8th grade math.
Economic disadvantage
For economically disadvantaged students, at 3rd grade there was no significant main effect, but there was an interaction between Montessori (yes/no) and test type (math/ELA), F(1,381) = 15.52, p < .001, ηp2 = 0.04. Significantly more economically disadvantaged Montessori students were proficient on 3rd grade ELA tests (est. marginal means 38.82% vs. 34.19%, mean difference = 4.63, SE = 1.54, p = .003, d = .31), but no difference was observed for math. In 8th grade, economically disadvantaged Montessori students were more proficient overall, F(1,102) = 6.82, p = .010, ηp2 = .06, but there was no Montessori X Test interaction. The Montessori advantage was observed on 8th grade ELA tests (est. marginal means 41.89% vs. 32.68%, mean difference = 9.21, SE = 3.02, p = .003, d = .54), but was not significant for 8th grade math (est. marginal means 33.09% vs. 27.18%, mean difference = 5.91, SE = 3.62, p = .105, d = .33).
Achievement gaps
Achievement gaps were examined between Black and White students and economically disadvantaged and non-economically disadvantaged students. To calculate the achievement gap, we subtracted the percentage of students proficient in one subgroup from the percentage proficient of students in the other group in the same school or district.
For 3rd grade ELA, the Black-White achievement gap was significantly smaller in Montessori than in other district schools (est. marginal means, 25.65% vs. 37.04%, mean difference = 11.39, SE = 3.15, p < .001, d = .77). The difference was insignificant for 3rd grade math. Achievement gap differences are shown in . There was insufficient data to conduct this analysis at 8th grade.
Figure 2. Achievement Gaps in Percent Proficient by Grade, Test, and Subgroup
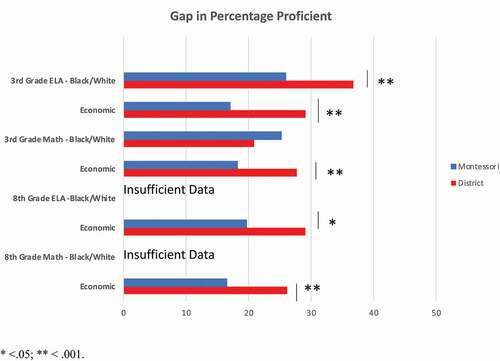
Next, we examined achievement gaps for economically disadvantaged subgroups. For 3rd grade ELA, the achievement gap in Montessori was significantly smaller than in district schools (est. marginal means, 17.16% vs. 28.97%, mean difference = 11.81, SE = 1.67, p < .001, d = .95). A significant effect was also found for 3rd grade math (est. marginal means, 18.22% for Montessori vs. 27.69% for district, mean difference = 9.47, SE = 1.85, p < .001, d = .73). For 8th grade ELA, the Montessori schools again had a significantly smaller gap (est. marginal means 20.30% vs. 28.26%, mean difference = 7.95, SE = 3.84, p = .042, d = .60). Montessori schools also had a significantly smaller gap in 8th grade math (est. marginal means 15.57% vs. 27.39%, mean difference = 11.82, SE = 3.41, p = .001, d =1.07). Thus, on both tests at both levels, economically disadvantaged students were more likely to be proficient if they were in Montessori schools.
Proficiency across grade levels
Differences in proficiency across the 3rd and 8th grades was examined last. This assumes that on average the children in a school or district’s 3rd grade classes are similar in most ways (other than age) to children in its 8th grade classes. For these analyses, we used a Bayesian approach to model estimation. Multiple imputations were used for missing data analysis. Because there were no significant differences in proficiency levels across the three school years, test performance was averaged across the three years to simplify this set of models and reduce missing values (important for this analysis since half of the schools had only one of the examined grade levels). We examined 8th grade performance while controlling for 3rd grade performance in the same school or district using ANCOVAs. The equation was:
where represents the observed reading/math score for the
th school at grade 8,
represents whether the
th school is a Montessori school (1: yes; 0: no),
is the ELA/math score for the
th school at grade 3, and
is the error term. The coefficients
and
were tested to see how Montessori and scores in grade 3 affected scores at grade 8. As compared to their districts, Montessori schools demonstrated a significantly greater percentage of students meeting the proficiency standard for ELA at 8th grade after controlling for the school or district’s 3rd grade proficiency levels, ∆M = 8.75, SD = 1.73, 95% credible interval = 5.30– 12.11. This was true for math as well, ∆M = 10.59, SD = 2.67, 95% credible interval = 5.43– 15.88. These results are shown in .
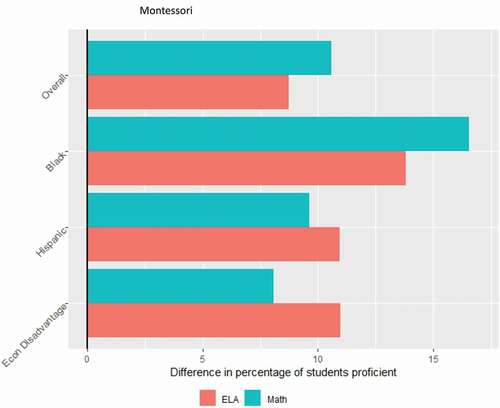
The same pattern was observed for Black students. A greater percent of Black students in Montessori in 8th grade were proficient in both ELA and math after controlling for 3rd grade proficiencies: ∆MELA = 13.83, SD = 5.09, 95% credible interval = 3.83– 23.82; ∆MMath = 16.55, SD = 6.98, 95% credible interval = 2.36– 30.29. The pattern was observed for Hispanic students in ELA, ∆M = 10.93, SD = 3.41, 95% credible interval = 4.22– 17.76, but was insignificant for math. Finally, the proportion of economically disadvantaged students in Montessori schools was also significantly greater at 8th grade after accounting for 3rd grade on ELA tests, ∆M = 10.97, SD = 3.09, 95% credible interval = 4.92– 17.04, but not on math.
Again, all models were also run adding enrollment as a covariate; there was no significant improvement in model fit (in fact, because of missingness, model fit was typically reduced).
Discussion
Because past research on state test scores for children in Montessori is limited and has mixed results, this study examined publicly posted proficiency levels at a large number of schools in the 10 states/areas of the US with the most public whole-school Montessori programs. The study thus provides a broader picture of academic achievement on standardized tests in public Montessori schools than has been provided thus far. The figures show that children in Montessori schools typically exceed their district peers on standardized tests as viewed from several angles. In ELA tests, children in Montessori schools were more likely to be proficient than their district peers in every comparison, at both grades, overall and across all subgroups. In math, the Montessori advantage was significant for Black children in 3rd grade, but overall, in 3rd grade, Montessori students were less likely to be proficient in math. In 8th grade the sample sizes were smaller, but judging by effect sizes, math proficiency was higher in Montessori schools by at least one-third SD for all subgroups. Focusing on the Black-White achievement gap, in 3rd grade Montessori had a smaller gap than comparison districts in ELA; there was no difference in the size of the gap for 8th grade there were insufficient data for analysis. Montessori also had a smaller achievement gap for economic advantage/disadvantage at both grades, on both subjects.
These findings are consistent with past research indicating that lower income, Black, and Hispanic students perform particularly well in the Montessori model (Ansari & Winsler, Citation2014, 2020; Brown & Lewis, Citation2017; Lillard et al., Citation2017). Comparing Montessori schools to their districts in terms of the difference in proficiency levels across 3rd and 8th grades, Montessori schools overall had greater differences in percentage proficient on both math and ELA tests in 8th grade controlling for 3rd grade. We caution here that different children’s scores are calculated at each grade, but school grade is the participant here, and there is no reason to expect characteristics of the population of children that constitute a school grade changes markedly across these grades (with the obvious exception of age). The overall pattern of seeing a greater difference in the proportion of children proficient at 8th grade on both tests is also true for Black children. For Hispanic and for economically disadvantaged children, Montessori schools showed significantly greater differences than districts in proficiency levels in 8th grade controlling for 3rd grade on ELA but not math tests, although the percentage change in math proficiency was in both cases over 7% greater at Montessori schools.
This study examines correlations between standardized test performance and school type. It is possible that the Montessori program confers these advantages; that would be consistent with lottery control studies’ kindergarten-level results and most studies of scores in individual states and districts, including one that matched students and controlled for individual students’ prior scores to examine growth (Culclasure et al., Citation2018). However, it is also possible that the results reflect self-selection: that families whose children would do better at any school happen to select Montessori schools more often. One point against this is the 3rd grade math results, which strongly favored other district schools. One might surmise that families who read more to their children enroll them in Montessori, and families that engage in more math at home enroll their children at other schools. If that were true, the results showing Montessori schools fare somewhat better on 8th grade math might suggest program effects. Yet the premise that selection effects produced the reading scores is not well-supported, in that all three existing lottery studies of public Montessori schools (which control for selection effects) have shown better results on reading for children who attend Montessori, indicating that the Montessori program does influence reading skills. Furthermore, two of those lottery studies included baseline data indicating no differences at baseline. Yet those studies concerned preschool-aged children. Selection effects cannot be ruled out with the present design.
The alternate possibility is that the Montessori program caused the differences in scores. Here we consider why Montessori might raise ELA test performance, what might explain the math pattern of lower performance in 3rd grade but equal at 8th, and finally, what might explain the general advantage for Black, Hispanic, and economically disadvantaged children.
ELA test results
The finding that Montessori schools had higher ELA scores in every comparison in this study aligns with prior research showing that Montessori students do well in ELA. Although results in some other studies could also reflect selection (Brown & Lewis, Citation2017; Culclasure et al., Citation2018; Mallett & Schroeder, Citation2015), this is not the case for studies that used random lotteries, and thus selection was controlled for (Courtier et al., Citation2021; Lillard & Else-Quest, Citation2006; Lillard et al., Citation2017); in one of these, low-income Montessori students improved more in reading across preschool than controls even though their Montessori teachers had no formal Montessori training (Courtier et al., Citation2021). The method with which reading is taught in Montessori is well-supported by other research, which could explain these findings. For one, children learn to write before they learn to read, making their learning of the letter symbols and sounds “embodied,” and embodied learning is typically superior to learning that does not involve moving the body (Lillard, Citation2017, Chapter 2; Shapiro & Stolz, Citation2019). For example, children who trace letters while learning their sounds learn them better than children who only look at the letters (Bara, Gentaz, & Colé, Citation2007). Montessori children trace sandpaper letters while learning the associated sounds. In addition, Montessori teaches the sounds, not the names of the letters, and this “phonics” approach also leads to better reading (Rayner, Foorman, Perfetti, Pesetsky, & Seidenberg, Citation2001). Reading ability at later ages is strongly predicted by earlier reading ability (Cunningham & Stanovich, Citation1997). This early alignment of the Montessori program with practices that result in better reading could explain the greater proficiency found both for every comparison in this study and in lottery control studies as well.
Math test results
Although Black children were more proficient in math in both grades (as a trend but with a larger effect size at 8th grade), and the achievement gap in math for economically disadvantaged children was smaller in both grades, Montessori fared worse overall in 3rd grade and similarly in 8th grade overall on math tests. This aligns with the lottery control studies, which showed variable math performance. This might be surprising in that Montessori has an array of manipulatives – hands-on learning materials like the Trinomial Cube (a set of wooden blocks that illustrate the logic of the trinomial equation) – that empirical research supports (Laski, Jor’dan, Daoust, & Murray, Citation2015). It is possible that the manipulatives themselves create problems for working out math using only paper and pencil; Montessori children might depend on manipulatives to carry out math problems, and therefore do poorly on standardized tests where manipulatives are not available. This might be particularly the case at younger ages as children in Montessori classrooms are said to use the materials less after around age 9 as they become more apt at abstraction. It has also been suggested that because the manipulatives engender true understanding, Montessori students excel on deeper conceptual math problems but not on more superficial problems that appear on state standardized tests (Basargekar & Lillard, Citation2021; Mix, Smith, Stockton, Cheng, & Barterian, Citation2017). Whether younger Montessori children would perform as well as or better than traditionally schooled children on conceptual questions or if the materials were available during standardized tests are interesting research questions. Excepting overall in 3rd grade, Montessori schools never performed worse in math, and at 8th grade they performed slightly better (p = .10, d = .17).
Black children and economically disadvantaged children
These two subgroups often perform less well on standardized tests but showed a pattern of higher levels of proficiency at Montessori schools. If Montessori is causing that difference, a possible reason is that individualized teaching in Montessori classrooms might leave children less vulnerable to unconscious teacher bias as discussed in the Introduction. In conventional schools, children are frequently tracked into higher and lower performing groups and then remain in those tracks. In Montessori, there are no tracks; for the most part, all children are expected to master most of the materials in a classroom in the 3 years they are there. Alternatively, Montessori has been described as a culturally responsive pedagogy that might be especially helpful for students historically affected by the racial opportunity gap (Brunold-Conesa, Citation2019; Debs & Brown, Citation2017; Lillard, Taggart, Yonas, & Seale, Citationin press). Regardless, the results address an issue that some parents, especially parents of color, raise, namely a belief that Montessori lacks strong academics (Debs, Citation2019). Children with opportunity gaps, whose scores tend to be lower in most schools, do as well or better in Montessori schools than in their districts at large, in both math and ELA.
Limitations
We mention above the limitations of self-selection as a possible explanation of our results, although the fact that the ELA findings are mirrored in lottery control studies and the fact that children overall did somewhat worse on math in 3rd grade but similarly by 8th grade suggest program effects. Another possibility is that some other feature of Montessori schools besides the curriculum – possibly smaller school or class sizes, or teachers who get extra training – is responsible for the effects. However, school size research at the high school level demonstrates that schools with 600–900 students have the highest academic achievement as compared to smaller and larger schools (Lee & Smith, Citation1997). Smaller class sizes are associated with favorable effects for teachers and students alike, such as increased participation and more favorable attitudes toward students (Smith & Glass, Citation1980), yet they are inconsistently associated with higher test scores (Ehrenberg, Brewer, Gamoran, & Willms, Citation2001). Additionally, increased teacher training is not associated with greater standardized test achievement. Even when this training comes in the form of an advanced degree, improved student performance is only seen in middle school math, not in ELA and not in elementary or high school (Harris & Sass, Citation2011). Another limitation of the study is that it included data from only 10 states/regions. It is possible that states with more Montessori implement the program differently than states with less Montessori, but it is difficult to say how it would differ. Non-Montessori schools also differ by state and district in their outcomes. It may be the case that poorly performing districts are more likely to adopt the Montessori model in a few schools, and the model might not fare as comparatively well in other districts. Similarly, we cannot extend our findings to private school contexts as private schools are not federally required to test their students, and funding and governance differ in private schools as compared to public schools.
Ideally, a longitudinal lottery control study could follow a cohort of children in Montessori preschool through the end of high school. Examining test performance and growth over time for children whose families intended them to go to Montessori (but the “lottery losers” did not get in) would provide a clearer picture of academic achievement of Montessori students as compared to their peers. If the ideal study is infeasible, getting individual scores of students matched by race and income, and controlling for each year’s prior score while examining growth (as in Culclasure et al., Citation2018), can also provide more insight as to how Montessori affects students of many backgrounds.
In sum, a higher percentage of students in all public Montessori schools across 10 states/regions was proficient on state tests compared to their districts, and achievement gaps were smaller in Montessori schools as compared to their districts. This adds to the literature by showing that across many states, children in Montessori performed reliably better on ELA tests. Furthermore, Black children did reliably better on math tests as well, and achievement gaps were generally smaller; for economically disadvantaged children these gaps were smaller on both tests at both ages. These results are novel and important. Montessori is the most common progressive pedagogy today (Debs, Citation2019) so a better understanding of its outcomes is crucial. However, our design does not allow for causal conclusions. The next step is to obtain individual student scores from multiple districts, to allow for fine-grained analyses of change over time, and if significant differences are found, then to seek to conduct longitudinal lottery control studies, and explore more deeply possible reasons for the effects.
Disclosure statement
No potential conflict of interest was reported by the author(s).
Additional information
Funding
Notes
1. Our search revealed no public Montessori schools in Alabama, Hawaii, Maine, North Dakota, South Dakota, Rhode Island, Vermont, or West Virginia.
2. HighScope is the play-based preschool program first developed for the famous Perry Preschool project (Schweinhart et al., Citation2005). See http://highscope.org.
References
- Alfieri, L., Brooks, P. J., Aldrich, N. J., & Tenenbaum, H. R. (2011). Does discovery-based instruction enhance learning? Journal of Educational Psychology, 103(1), 1–18. doi:https://doi.org/10.1037/a0021017
- Ansari, A., & Winsler, A. (2014). Montessori public school pre-k programs and the school readiness of low-income black and latino children. Journal of Educational Psychology, 106(4), 1066–1079. doi:https://doi.org/10.1037/a0036799
- Ansari, A., & Winsler, A. (2020). The long-term benefits of Montessori pre-K for Latinx children from low-income families. Applied Developmental Science, 1–15. doi:https://doi.org/10.1080/10888691.2020.1781632
- Arizona Department of Education. (2019). Accountability & research data. https://www.azed.gov/data/public-data-sets
- Au, W. (2013). Hiding behind high-stakes testing: Meritocracy, objectivity and inequality in U.S. education. International Education Journal, 12(2), 7–20.
- Bara, F., Gentaz, E., & Colé, P. (2007). Haptics in learning to read with children from low socio-economic status families. British Journal of Developmental Psychology, 25(4), 643–663. doi:https://doi.org/10.1348/026151007X186643
- Basargekar, A., & Lillard. (2021). Math achievement outcomes associated with Montessori education. Early Child Development and Care, 1–12. doi:https://doi.org/10.1080/03004430.2020.1860955
- Blair, C., & Raver, C. C. (2015). School readiness and self-regulation: A developmental psychobiological approach. Annual Review of Psychology, 66(1), 711–731. doi:https://doi.org/10.1146/annurev-psych-010814-015221
- Brooks, J. G., & Brooks, M. G. (2001). In search of understanding:The case for constructivist classrooms. Prentice-Hall.
- Brown, K. E., & Lewis, C. W. (2017). A comparison of reading and math achievement for African American third grade students in Montessori and other magnet schools. Source: The Journal of Negro Education, 86(4), 439–448. doi:https://doi.org/10.7709/jnegroeducation.86.4.0439
- Brown, K. E., & Steele, A. S. L. (2015). Racial discipline disproportionality in Montessori and traditional public schools: A comparative study using the relative rate index. Journal of Montessori Research, 1(1), 14. doi:https://doi.org/10.17161/jomr.v1i1.4941
- Brunold-Conesa, C. (2019). Culturally responsive pedagogy: An interaction with Montessori education. Independent Teacher. https://www.nais.org/magazine/independent-teacher/spring-2019/culturally-responsive-pedagogy-an-intersection-with-montessori-education/
- California Assessment of Student Performance and Progress. (2019). Test results for California’s Assessments. https://caaspp-elpac.cde.ca.gov/caaspp/AboutCAASPP
- Carnevale, A. P., Fasules, M. L., Quinn, M. C., & Peltier Campbell, K. (2019). Born to win, schooled to lose: Why equally talented students don’t get equal chances to be all they can be. https://cew.georgetown.edu/cew-reports/schooled2lose/%0Ahttps://1gyhoq479ufd3yna29x7ubjn-wpengine.netdna-ssl.com/wp-content/uploads/ES-Born_to_win-schooled_to_lose.pdf
- Checchi, D., & De Paola, M. (2018). The effect of multigrade classes on cognitive and non- cognitive skills. Causal evidence exploiting minimum class size rules in Italy✰. Economics of Education Review, 67(February), 235–253. doi:https://doi.org/10.1016/j.econedurev.2018.10.003
- Cheng, A., Hitt, C., Kisida, B., & Mills, J. N. (2017). “No Excuses” charter schools: A meta-analysis of the experimental evidence on student achievement. Journal of School Choice, 11(2), 209–238. doi:https://doi.org/10.1080/15582159.2017.1286210
- Chetty, R., Friedman, J. N., & Rockoff, J. E. (2014a). Measuring the impacts of teachers I: Evaluating bias in teacher value-added estimates. American Economic Review, 104(9), 2593–2632. doi:https://doi.org/10.1257/aer.104.9.2593
- Chetty, R., Friedman, J. N., & Rockoff, J. E. (2014b). Measuring the impacts of teachers II: Teacher value-added and student outcomes in adulthood. Journal of Chemical Information and Modeling, 53(9), 1689–1699.
- Chien, N. C., Howes, C., Burchinal, M., Pianta, R. C., Ritchie, S., Bryant, D. M., … Barbarin, O. A. (2010). Children’s classroom engagement and school readiness gains in prekindergarten. Child Development, 81(5), 1534–1549. doi:https://doi.org/10.1111/j.1467-8624.2010.01490.x
- Colorado Department of Education. (2019). CMAS - mathematics, English language arts, science and social studies data and results. https://www.cde.state.co.us/assessment/cmas-dataandresults
- Courtier, P., Gardes, M.-L., Van der Henst, J.-B., Noveck, I. A., Croset, M.-C., Epinat‐Duclos, J., … Prado, J. (2021). Effects of Montessori education on the academic, cognitive, and social development of disadvantaged preschoolers: A randomized controlled study in the French public-school system. Child Development. On line first. doi:https://doi.org/10.1111/cdev.13575.
- Culclasure, B., Daoust, C. J., Cote, S. M., & Zoll, S. (2019). Designing a logic model to inform Montessori research. Journal of Montessori Research, 5(1). doi:https://doi.org/10.17161/jomr.v5i1.9788
- Culclasure, B., Fleming, D., & Riga, G. (2018). An evaluation of Montessori education in south carolina’s public schools. Geenville, SC: The Riley Institute at Furman University.
- Cunningham, A. E., & Stanovich, K. E. (1997). Early reading acquisition and its relation to reading experience and ability 10 years later. Developmental Psychology, 33(6), 934–945. doi:https://doi.org/10.1037//0012-1649.33.6.934
- Darling-Hammond, L. (2007). Race, inequality and educational accountability: The irony of “No Child Left Behind.” Race Ethnicity and Education, 10(3), 245–260. doi:https://doi.org/10.1080/13613320701503207
- Darling-Hammond, L., Flook, L., Cook-Harvey, C., Barron, B., & Osher, D. (2020). Implications for educational practice of the science of learning and development. Applied Developmental Science, 24(2), 97–140. doi:https://doi.org/10.1080/10888691.2018.1537791
- Debs, M. C. (2016a). 2012–2013 whole-school Montessori data set.
- Debs, M. C. (2016b). American public Montessori historical data set. https://goo.gl/mF7RHs
- Debs, M. C. (2016c). Racial and economic diversity in U.S. public Montessori schools. Journal of Montessori Research, 2(2), 15–34. doi:https://doi.org/10.17161/jomr.v2i2.5848
- Debs, M. C. (2019). Diverse families, desirable schools. Cambridge, MA: Harvard Education Press.
- Debs, M. C., & Brown, K. E. (2017). Students of color and public Montessori schools: A review of the literature. Journal of Montessori Research, 3(1), 1. doi:https://doi.org/10.17161/jomr.v3i1.5859
- Dee, T., & Gershenson, S. (2017). Unconscious Bias in the Classroom: Evidence and opportunities. Stanford Center for Education Policy Analysis.
- Denervaud, S., Knebel, J. F., Immordino-Yang, M. H., & Hagmann, P. (2020). Effects of traditional versus Montessori schooling on 4- to 15-year old children’s performance monitoring. Mind, Brain, and Education, 14(2), 167–175. doi:https://doi.org/10.1111/mbe.12233
- Dohrmann, K. R., Nishida, T. K., Gartner, A., Lipsky, D. K., & Grimm, K. J. (2007). High school outcomes for students in a public Montessori program. Journal of Research in Childhood Education, 22(2), 205–217. doi:https://doi.org/10.1080/02568540709594622
- Dreyer, A. S., & Rigler, D. (1969). Cognitive performance in Montessori and nursery school children. The Journal of Educational Research, 62(9), 411–416. doi:https://doi.org/10.1080/00220671.1969.10883885
- Duncan, G. J., Magnuson, K., Murnane, R., & Votruba-Drzal, E. (2019). Income inequality and the well-being of American families. Family Relations, 68(3), 313–325. doi:https://doi.org/10.1111/fare.12364
- Duncan, G. J., & Murane, R. J. (2014). Restoring opportunity. Cambridge, MA: Harvard Education Press.
- Ehrenberg, R. G., Brewer, D. J., Gamoran, A., & Willms, D. J. (2001). Does class size matter? Scientific American, 285(5), 78–85. doi:https://doi.org/10.1038/scientificamerican1101-78
- Elkind, D. (1983). Montessori education - abiding contributions and contemporary challenges. Young Children, 38(2), 3–10. //a1983px92600001.
- Florida Department of Education. (2019). Florida’s PK-12 education information portal. https://edstats.fldoe.org/SASPortal/main.do
- Goldhaber, D., & Özek, U. (2019). How much should we rely on student test achievement as a measure of success? Educational Researcher, 48(7), 479–483. doi:https://doi.org/10.3102/0013189X19874061
- Good, T. L., Sterzinger, N., & Lavigne, A. (2018). Expectation effects: Pygmalion and the initial 20 years of research. Educational Research and Evaluation, 24(3–5), 99–123. doi:https://doi.org/10.1080/13803611.2018.1548817
- Haberman, M. (2010). The pedagogy of poverty versus good teaching. Phi Delta Kappan, 92(2), 81–87. doi:https://doi.org/10.1177/003172171009200223
- Hanushek, E. A. (2019). Testing, accountability, and the American economy. The ANNALS of the American Academy of Political and Social Science, 683(1), 110–128. doi:https://doi.org/10.1177/0002716219841299
- Harris, D. N., & Sass, T. R. (2011). Teacher training, teacher quality and student achievement. Journal of Public Economics, 95(7–8), 798–812. doi:https://doi.org/10.1016/j.jpubeco.2010.11.009
- Heissel, J. A., Adam, E. K., Doleac, J. L., Figlio, D. N., & Meer, J. (2019). Testing, stress, and performance: How students respond physiologically to high-stakes testing. Education Finance and Policy, March, 1–50. doi:https://doi.org/10.1162/edfp_a_00306
- Hill, A. J., & Jones, D. B. (2018). A teacher who knows me: The academic benefits of repeat student-teacher matches. Economics of Education Review, 64(March), 1–12. doi:https://doi.org/10.1016/j.econedurev.2018.03.004
- Ho, A. D. (2008). The problem with “proficiency”: Limitations of statistics and policy under No Child Left Behind. Educational Researcher, 37(6), 351–360. doi:https://doi.org/10.3102/0013189x08323842
- Holland, P. W. (2002). Two measures of change in the gaps between the CDFs of test-score distributions. Journal of Educational and Behavioral Statistics, 27(1), 3–17. doi:https://doi.org/10.3102/10769986027001003
- Jones, B. D. (2007). The unintended outcomes of high-stakes testing. Journal of Applied School Psychology, 23(2), 65–86. doi:https://doi.org/10.1300/J370v23n02
- Klahr, D., & Nigam, M. (2004). The equivalence of learning paths in early science instruction. Effects of direct instruction and discovery learning. Psychological Science,15(10), 661–667. https://doi.org/10.1111/j.0956-7976.2004.00737.x
- Kraft, M. A. (2020). Interpreting Effect Sizes of Education Interventions. Educational Researcher, 49(4), 241–253. doi:https://doi.org/10.3102/0013189X20912798
- Larrison, A. L., Daly, A. J., & VanVooren, C. (2012). Twenty years and counting: A look at Waldorf in the public sector using online sources. Current Issues in Education, 15(3), 24.
- Laski, E. V., Jor’dan, J. R., Daoust, C., & Murray, A. K. (2015). What makes mathematics manipulatives effective? Lessons From cognitive science and Montessori education. SAGE Open, 5(2), 215824401558958. doi:https://doi.org/10.1177/2158244015589588
- Lee, V. E., & Smith, J. B. (1997). High school size: Which works best and for whom? Educational Evaluation and Policy Analysis, 19(3), 205–227. doi:https://doi.org/10.3102/01623737019003205
- Lillard, A. S. (2017). Montessori: The Science Behind the Genius (3rd ed.). New York: Oxford.
- Lillard, A. S., & Else-Quest, N. (2006). Evaluating Montessori education. Science, 313(5795), 1893–1894. doi:https://doi.org/10.1126/science.1132362
- Lillard, A. S., Heise, M. J., Richey, E. M., Tong, X., Hart, A., & Bray, P. M. (2017). Montessori preschool elevates and equalizes child outcomes: A longitudinal study. Frontiers in Psychology, 8(OCT), 1–19. doi:https://doi.org/10.3389/fpsyg.2017.01783
- Lillard, A. S., Lerner, M. D., Hopkins, E. J., Dore, R. A., Smith, E. D., & Palmquist, C. M. (2013). The impact of pretend play on children’s development: A review of the evidence. Psychological Bulletin, 139(1), 1–34. doi:https://doi.org/10.1037/a0029321
- Lillard, A. S., & McHugh, V. (2019a). Authentic Montessori: The Dotteresa’s view at the end of her life part II. Journal of Montessori Research, 5(1), 19–34. doi:https://doi.org/10.17161/jomr.v5i1.9753
- Lillard, A. S., & McHugh, V. (2019b). Authentic Montessori: The Dottoressa’s View at the End of Her Life Part I. Journal of Montessori Research, 5(1), 1–18. doi:https://doi.org/10.17161/jomr.v5i1.7716
- Lillard, A. S., & Taggart, J. (2019). Pretend play and fantasy: What if Montessori was right? Child Development Perspectives, 13(2), 85–90. doi:https://doi.org/10.1111/cdep.12314
- Lillard, A. S., Taggart, J., Yonas, D., & Seale, M. N. (in press). An alternative to “no excuses”: Considering Montessori as culturally responsive pedagogy. Journal of Negro Education.
- Lopata, C., Wallce, N., & Finn, K. (2005). Comparison of academic achievement between Montessori and traditional education programs. Journal of Research in Childhood Education, 20(1), 5–13. doi:https://doi.org/10.1080/02568540509594546
- Mallett, J. D., & Schroeder, J. L. (2015). Academic achievement outcomes: A comparison of Montessori and non-Montessori public elementary school students. Journal of Elementary Education, 25(1), 39–53.
- Maryland State Department of Education. (2019). Maryland School Report Card. https://reportcard.msde.maryland.gov/
- Maxwell, S., Delaney, H., & Kelley, K. (2018). A model comparison perspective. New York: Routledge
- Mayer, R. E. (2004). Should there be a three-strikes rule against pure discovery learning? The case for guided methods of instruction. doi:https://doi.org/10.1037/0003-066X.59.1.14
- Michigan School Data. (2019). Grades 3–8 state testing performance. https://www.mischooldata.org/grades-3-8-state-testing-includes-psat-data-performance/
- Minnesota Department of Education. (2019). Minnesota Report Card. https://rc.education.mn.gov/
- Mix, K. S., Smith, L. B., Stockton, J. D. S., Cheng, Y. L., & Barterian, J. A. (2017). Grounding the symbols for place value: Evidence from training and long-term exposure to base-10 models. Journal of Cognition and Development, 18(1), 129–151. doi:https://doi.org/10.1080/15248372.2016.1180296
- Montessori, M. (2017). The discovery of the child (2nd ed., M. J. Costello ed.). Amsterdam: Pierson.
- National Academies of Sciences Engineering and Medicine. (2018). How people learn II: Learners, contexts, and cultures. Washington D.C.: National Academies Press.
- National Center for Education Statistics. (2019). Common Core of Data. https://nces.ed.gov/ccd/
- National Center for Montessori in the Public Sector. (2014). Growth of Public Montessori in the United States: 1975–2014. https://www.public-montessori.org/white-papers/growth-of-public-montessori-in-the-united-states-1975-2014/
- National Center for Montessori in the Public Sector. (2019). Montessori census. https://www.montessoricensus.org/
- Office of the State Superintendent of Education: DC. (2019). Data and reports. https://osse.dc.gov/page/data-and-reports-0
- Pang, V. O., Han, P. P., & Pang, J. M. (2011). Asian American and Pacific Islander students: Equity and the achievement gap. Educational Researcher, 40(8), 378–389. doi:https://doi.org/10.3102/0013189X11424222
- Powers, K. (2005). Promoting school achievement among American Indian students throughout the school years. Childhood Education, 81(6), 338–342. doi:https://doi.org/10.1080/00094056.2005.10521323
- Rayner, K., Foorman, B. R., Perfetti, C. A., Pesetsky, D., & Seidenberg, M. S. (2001). How psychological science informs the teaching of reading. Psychological Science in the Public Interest, 2(2), 31–74. doi:https://doi.org/10.1111/1529-1006.00004
- Schweinhart, L. J., Montie, J., Xiang, Z., Barnett, W. S., Belfield, C. R., & Nores, M. (2005). Lifetime effects: The High/Scope Perry Preschool study through age 40. Ypsilanti, MI: High/Scope.
- Shapiro, L., & Stolz, S. A. (2019). Embodied cognition and its significance for education. Theory and Research in Education, 17(1), 19–39. doi:https://doi.org/10.1177/1477878518822149
- Smith, M. L., & Glass, G. V. (1980). Meta-analysis of research on class size and its relationship to attitudes and instruction. American Educational Research Journal, 17(4), 419–433. doi:https://doi.org/10.3102/00028312017004419
- South Carolina Department of Education. (2020). Test Scores. https://ed.sc.gov/data/test-scores/
- Stockard, J., Wood, T. W., Coughlin, C., & Rasplica Khoury, C. (2018). The effectiveness of direct instruction curricula: A meta-analysis of a half century of research. Review of Educational Research, 88(4), 479–507. doi:https://doi.org/10.3102/0034654317751919
- Texas Edcuation Agency. (2020). Texas academic performance reports. https://tea.texas.gov/texas-schools/accountability/academic-accountability/performance-reporting/texas-academic-performance-reports
- Tyack, D. B., & Cuban, L. (1995). Tinkering toward Utopia. Cambridge, MA: Harvard University Press.
- Virginia Department of Education. (2019). SOL test pass rates & other results. https://www.doe.virginia.gov/statistics_reports/sol-pass-rates/index.shtml
- Winsler, A., & Carlton, M. P. (2010). Observations of children’s task activities and social interactions in relation to teacher perceptions in a child-centered preschool: Are we leaving too much to chance? doi:https://doi.org/10.1207/s15566935eed1402_2
- Wisconsin Department of Public Instruction. (2020). Accountability report cards. https://apps2.dpi.wi.gov/reportcards/
- Yang, C., Luo, L., Vadillo, M. A., Yu, R., & Shanks, D. R. (2021). Testing (quizzing) boosts classroom learning: A systematic and meta-analytic review. Psychological Bulletin, 147(4), 399–435. doi:https://doi.org/10.1037/bul0000309
- Zhao, Y. (2016). From Deficiency to strength: Shifting the mindset about education inequality. Journal of Social Issues, 72(4), 720–739. doi:https://doi.org/10.1111/josi.12191
- Zhao, Y. (2017). What works may hurt: Side effects in education. Journal of Educational Change, 18(1), 1–19. doi:https://doi.org/10.1007/s10833-016-9294-4
Appendix
ANCOVA model diagnostics
The model diagnostics below were based on observed data when Bayesian methods were not used. When Bayesian methods were used, missing data were imputed using multiple imputation techniques. Since we assume that the missing data are missing at random, the assumptions should still hold with the Bayesian modeling approach.
Figure A1. Third Grade Reading: Residuals X Order of Observation (A), Residuals XProficiency (B), and Residuals X District (0.0) or Montessori (1.0)(C).
Figure A2 Third Grade Math: Residuals X Order of Observation (A), Residuals XProficiency (B), and Residuals X District (0.0) or Montessori (1.0)(C).
Independence
Since the district scores do not contain Montessori school scores (as they were removed) and different districts and schools should be independent from each other, it is reasonable to believe the independence assumption is satisfied. In addition, we plotted residuals against the order of observation, and any variables used in the model. (A pattern that is not random suggests a lack of independence.) The plots below do not show any pattern, indicating that the independence assumption is satisfied.
Figure A3 Reading: Plot of Normality of the Model Residuals.
Figure A4 Math: Plot of Normality of the Model Residuals.
Figure A5 Homoscedasticity of Reading Scores: Plot of Square Root of Standardize Residuals vs. Fitted Values.
Normality
Below we show the plots and test the normality of the model residuals.
Figure A6 Homoscedasticity of Math Scores: Plot of Square Root of Standardize Residuals vs. Fitted Values.

Figure A7 Linearity and Reading Scores: Residuals by Fitted Values.
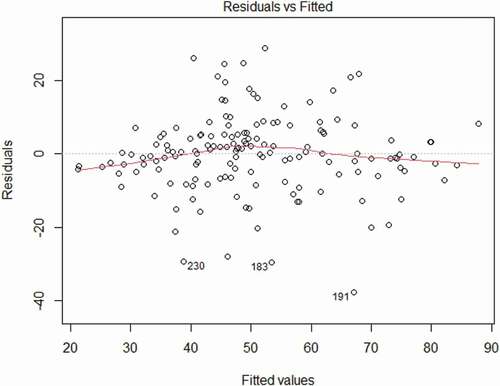
Shapiro–Wilk normality test: p = .001 ≥ nonnormal
D’Agostino skewness test: skewness = −0.269, p = .162 ≥ not skewed, symmetric
Anscombe-Glynn kurtosis test: kurtosis = 4.516, p = .005 ≥ heavy-tailed
As pointed out in the literature (e.g., Maxwell, Delaney & Kelly, Citation2018), ANCOVA is robust against the violation of the normality assumption especially for symmetric data. Since the residuals are symmetric, we can still use ANCOVA.
Figure A8 Linearity and Math Scores: Residuals by Fitted Values.
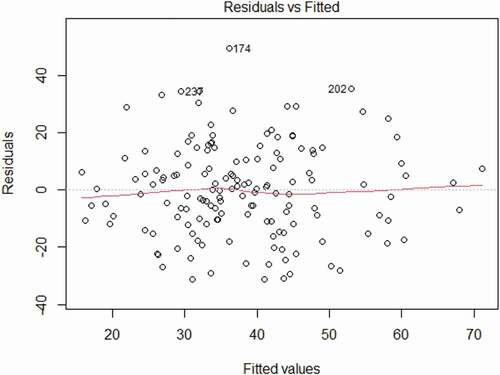
Shapiro-Wilke normality test: p = .297 ≥ normal
D’Agostino skewness test: skewness = 0.259, p = .181 ≥ not skewed
Anscombe-Glynn kurtosis test: kurtosis = 2.817, p = .797 ≥ not heavy-tailed
The normality assumption is satisfied.
Homogeneity of variance
The error variance of the model should be constant across the values of the independent variables. We check the homoscedasticity by plotting the square root of standardized residuals versus fitted values. There should be no clear pattern in the distribution. From the plots below, we conclude that the homogeneity of variance assumption is satisfied.
Linearity
Fitted values and residuals should show no fitted pattern. As we can see in the two plots below, the linearity assumption is satisfied for models fitted to reading and math scores, respectively.
Note that although the above illustration is for the overall scores, model diagnostics for specific subgroups (e.g., white, black, etc.) are similar.
Also note that ANCOVA is robust against the violation of normality and homogeneity of variance assumptions, especially when data are symmetric and balanced. Although our data were not balanced with missing data, when Bayesian methods were applied, multiple imputations were automatically implemented, so the data became balanced.