
 ?Mathematical formulae have been encoded as MathML and are displayed in this HTML version using MathJax in order to improve their display. Uncheck the box to turn MathJax off. This feature requires Javascript. Click on a formula to zoom.
ABSTRACT
This paper expands on previous work on charter school typology and presents disparities in standardized test outcomes across models by using standardized Z-Scores weighted by NAEP performance. Analyses indicate that in ELA, Classical schools have the highest relative performance, followed by Montessori and Art schools. In math, Classical schools once again have the highest relative performance, followed by Montessori and STEM schools. For reasons discussed in the paper it is premature to posit causality, so the results should instead be viewed as descriptive. We suggest a more pluralistic testing framework may be appropriate when evaluating the performance of specialized schools.
Background
The question of what defines a high-quality education has been a subject of ongoing debate among educators, parents, and policy makers. Despite numerous endeavors to assess student progress and outcomes, this underlying divergence of opinion persists. Nonetheless, policy makers require effective methods for evaluating public programs in order to optimize the allocation of public resources. Standardized testing, grounded in a foundational set of criteria, has proven instrumental in illuminating educational disparities and serving as a means to appraise schools and educators. The inherent drawback of this approach lies in society’s failure to consider the diverse array of objectives and aspirations held by parents. The utilization of uniform standards proves impractical since the identification of an ideal educational institution remains unattainable without well-defined and mutually agreed-upon objectives. The determination of an ideal school depends on the individual goals of the parents. As parents do not universally agree on the goals of public education, those of us in the education space are left with an unworkable system incapable of properly evaluating a school’s performance (Ackerman & Egalite, Citation2017). Some thinkers in the educational space have suggested that school choice programs that embrace the pluralistic nature of parental desires could help solve this issue (Egalite & Wolf, Citation2016; Hanushek et al., Citation2007; Kisida & Wolf, Citation2010). Others have argued that school choice would also yield the benefits of competition in education (Hanushek, Citation2006). For the past 30 years, the public charter school movement has presented parents with a plethora of schooling options and therefore serves as the perfect testing ground for these lines of reasoning.
While school choice sometimes elicits mixed emotions, charter schools and other forms of school choice continue to receive broad support (Shuls, Citation2018). Roughly two- thirds of charter schools are specialized in a wide array of foci including STEM, Arts, CTE, Language Immersion, etc (White & Huang, Citation2022). When a school chooses to focus on a particular mission, it gives researchers a valuable opportunity to assess whether that model is, in any way, superior to the baseline average school in some way. If that is the case, then there may be an opportunity for the education sector to derive successful policies, curricular choices, pedagogical approaches, and other key decisions around how to best support families in the community, staff, and most of all, students. They can accomplish this because charter schools are public schools.
When a private citizen wants to open their own public school, a state-appointed actor may approve them or a third party to independently “charter” or run a public school. Those charged with overseeing charter schools are called authorizers. Authorizers come from a variety of sources including state governments, local governments, municipal governments, state- approved independent chartering boards, and in rare cases, nonprofit organizations, or universities (NACSA, Citation2021). Each state creates its specific laws detailing who these authorizers can be. As of 2022, 45 states, D.C., Puerto Rico, and Guam all have charter laws (NAPCS, Citation2022). In exchange for the freedom and autonomy to innovate, charter schools are required to meet agreed-upon accountability standards. If a school fails to meet all of the standards, an authorizer may choose to revoke the charter, which effectively closes the public charter school.
Thus, the way authorizers evaluate the performance of a school is a critical policy decision. They typically look to state-determined standardized exams in ELA and Math for insight into how a school is performing. 22 states have some form of History or Civics Exam (NCES 1, Citation2018). All states test for some science at some point and in some form, but only 6 do so more than twice in a child’s 12 years of schooling (NCES 2, Citation2021). Both the irregularity of administration and the wide variance of tested material make comparing these data difficult. If charter schools offer countless specialized schools, then it may place those charter schools at a disadvantage as an aggregate when researchers evaluate them based on the same criteria as for other generic public schools. However, by recognizing the many forms of specialization, authorizers might, for example, more accurately assess charter schools based on their missions, models, and attributes (Maranto & Shakeel, Citation2021). To further investigate, we look to see if the top school models demonstrated performance disparities in the 2018–19 school year. While this does not necessarily indicate that the models themselves cause the disparities, determining which models performed the best descriptively should provide some direction for researchers interested in exploring innovation and what lessons can be gleaned from the charter school sector.
Comparing models presents a challenge due to the potential influence of families and communities that opt for specialized schools on student outcomes. In other words, there may exist notable distinctions between families attending classical schools and those selecting Art schools, for instance. Nevertheless, conducting comparisons within a given model can help mitigate selection bias and elucidate the effectiveness of specific innovations within that model. As researchers categorized charter schools based on self-identification rather than strict adherence to a predetermined set of model characteristics, variations in the adoption of innovations emerge even among schools classified under the same model. This diversity provides an opportunity to examine which innovative elements of a model correlate with improved student performance.
While there are many metrics that could be used for evaluating a given school’s performance, the most used metrics are ELA and Math proficiency. While we hope to one day expand the scope of inquiry to include measures of growth, civic engagement, long-term outcomes, and executive functioning, data limitations prevent us from doing so in this paper.
Data
In a previous paper, the researchers coded all public charter schools in the 2018–19 school year into 68 models. Each model needed to have five schools that identified with the same set of foci within their mission statements, charter applications, and promotional materials. Roughly a third of charter schools did not self-identify with a specialized focus, therefore researchers coded them as “general” (White & Huang, Citation2022). Adding to this dataset of charter schools and their models, researchers leveraged data collected and published by The National Center for Educational Statistics (NCES): EDfacts. This dataset provides the valuable Reading Language Arts (RLA aka. ELA) and math proficiency scores used in this paper. Edfacts does have some limitations which need to be mentioned. Proficiency data from Edfacts was merged with school model data using the NCESSCH ID.
Data limitations
The underlying model data were the best available, but not necessarily perfect. Although the effort to collect the data was certainly laborious in nature, it was not exhaustive, and information was surely missed. Additionally, because it required a school to explicitly state their model, it is possible that some schools were missed if the school chose not to publicly divulge their educational strategies. Additionally, there are some limitations when it comes to the performance data.
Testing data comes from schools’ grades 3-8 and one year of high school. This meant that of the 7,572 charter school records, 739, or roughly 10% did not have performance data for either RLA or Math. We would prefer to have performance data for every school at every grade level. However, the Edfacts data should nevertheless prove reasonably representative as evidenced by the countless other papers and government reports that leverage these same data (Ahearn, Citation2008) (Reardon et. al., Citation2016) (Ginsburg & Smith, Citation2019).
For student confidentiality reasons, Edfacts reports performance for some schools with low enrollment as bands such as 13%-17% proficient instead of the actual average. When the number of participants is low, Edfacts, often reports the proficiency data in a range such as “60-64%.” For these ranges, we averaged the numbers and coded the school as 62%. Because we account for the number of students in our model, the effects of these averages should be minimal. Some public schools had so few participants that Edfacts marks the range as Less than 50 or 20 or Greater than 50 or 20. This is particularly prevalent in sub-group data where small participant numbers are more common. These schools were removed from the analysis. They represented 3,043 2018-19 ELA records and 3,550 Math records or 3.4% and 3.9% of the total public school records respectively. Additionally, a further 1,336 records in the ELA file and 1,350 in the Math file were suppressed all together. Thus, the total useable ELA data was 95.1% of records and 94.6% of records for Math.
Across the datasets produced by NCES, multiple charter schools are sometimes reported as one charter school record when they represent several schools. Conversely, some charter schools are reported as multiple records when really those records all belong to the same school (White, Citation2019). We utilized the National Alliance for Public Charter School’s method of accounting for charter schools (White, Citation2019). This means the adoption of what they call the modified count system. This system is designed to adjust the ways in which NCES reports charter data in a way that more accurately reflects the on-the-ground situation.
Comparing schools nationally is not as straightforward as one might think. Each state government chooses which standardized test to adopt. Education reformers previously attempted to unify the nation around a consortium test such as PARCC or Smarter Balance (Jochim & McGuinn, Citation2016) (DeNisco, Citation2016). To make matters more complicated, some states administer customized versions of the PARCC exam (Gewertz, Citation2017). In 2018-19 only 16 states and D.C. use this test, 32 states use non-consortium tests, and three use a mixture of PARCC and Smarter Balance and their own questions. With so many different tests administered across the U.S. and its territories, it is very difficult for researchers to evaluate school performance nationally. We address this by evaluating a school’s performance in two ways. First, we compared models by the frequency in which they out-performed the school district and state averages. When combined with the model data previously collected and presented in this article (White & Huang, Citation2022), we were able to crudely compare the top ten most popular models. Second, we attempt to normalize the Edfacts data using Z scores weighted by NAEP performance. Previous researchers have used a similar strategy for district-level analyses (DeArmond et. al., 2015; Monarrez & Chingos, Citation2020; S. Reardon et al., Citation2016; S. F. Reardon et al., Citation2016). However, as we needed school-level data for our analysis of charter school models, our method differs somewhat.
Proficiency distributions vary across states. For example, the average proficiency score in math for Virginia was more than 81% whereas the average proficiency score for New Mexico was less than 22%. To standardize the data across states, we convert proficiency scores to Z-scores by using within-state averages and standard deviations.
The NAEP assessment data also suggests that some states outperform others on standardized assessments. We adjust the Z-scores to account for state differences identified by NAEP by applying a state multiplier, which is equal to the average percentage difference the state scored in 4th and 8th Grade. One limitation here is that we did not have NAEP high-school scores for 2018-19 and had to assume the average between 4th and 8th would nevertheless serve as a reasonable adjustment. To see the NAEP Weights for each state please see appendices 1 and 2.
NAEP-weighted Z-scores
To understand the process of generating NAEP weighted Z-scores researchers used the following formula:
With this completed, researchers aggregated NAEP Weighted Z-Scores at the model level while adjusting for participation to reduce the noise from the aforementioned Edfacts standardization limitation.
Research methods
Researchers began by calculating district and state averages in ELA and math. District and state averages were calculated using all available public schools across the nation and weighting performance by the number of students. Subsequently, the researchers compiled a comprehensive roster encompassing all charter schools that employed one of the top ten models in relation to student enrollment. Finally, they compared each school’s proficiency scores to their state and district averages to get binary variables that tell us whether the school is outperforming its state or district. This method allowed for the aggregation along model lines and across states.
The results show disparities across models. The highest performing model in 2018–19 was the Classical model. Nearly 70% of classical schools outperformed their districts and states in ELA. In math, more than 60% outperformed their districts and states. Classical schools were not the only successful model. STEM, Montessori, and Art schools did well, too. A slight majority of High-Expectations schools also outperformed their districts in math and reading. Please note the researchers are not claiming that the model itself causes the disparity. That question goes beyond what this paper explores.
depict national disparities descriptively and depict disparities across the four largest charter states.
Table 1. Percentage of Charter Schools Outperforming Local School District by Model.
Table 2. Percentage of Charter Schools Outperforming The Stateby Model.
Table 3. Arizona’s Participation, Proficiency, and Average Scores by Model.
Table 4. California’s Participation, Proficiency, and Average Scores by Model.
Table 5. Florida’s Participation, Proficiency, and Average Scores by Model.
Table 6. Texas’s Participation, Proficiency, and Average Scores by Model.
Figure 1. Top Ten Charter School Models by 2018-19 NAEP-Weighted Z Scores - RLA.
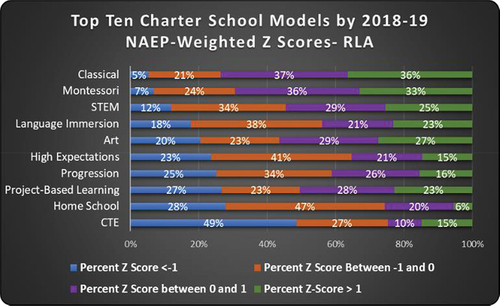
Based solely on the standardized ELA and Math exams, it appears there are large numbers of Classical and STEM charter schools outperforming their district and state peers in both ELA and math, while Montessori and Art School out-perform their local districts in ELA in most cases. However, a major limitation of this method of evaluation is that it does not show us the degree to which these schools are outperforming their peers. To get a better understanding of model performance, we next look at the distributions of schools within the model using NAEP-weighted Z-scores that allow the researchers to aggregate across states by model. show how well the top ten models perform in RLA and Math.
Figure 2. Top Ten Charter School Models by 2018-19 NAEP-Weighted Z Scores - Math.
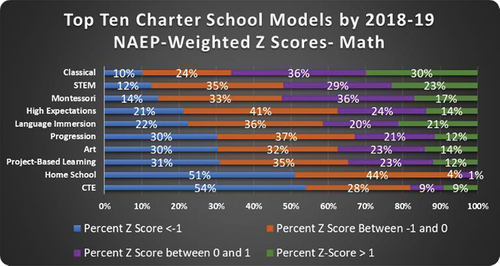
Looking at the percentage of schools performing at least a standard deviation higher than the mean, we see Classical schools once again emerge at the top in both ELA (36%) and math (30%) too. One interesting finding here is that all models show potential for further investigation. With so many schools performing more than a standard deviation higher than the average, the education sector might learn countless lessons with further exploration into what underlying mechanisms are at play.
In addition to overall performance, breaking the data out by subgroups reveals some additional interesting findings, too. show how well the top charter school models did serving Children with Disabilities (CWD), Economically Disadvantaged (ECD) students, students classified as having Low English Proficiency (LEP), and 4th and 8th grade. Please note that we used only the 4th and 8th grade NAEP weights instead of the average when adjusting the 4th and 8th grade Z Scores.
In RLA, CWD perform more than half a standard deviation (0.56 stdv) better in Montessori schools, the highest of any model. Students with LEP see the largest gains (0.12 stdv) in Art-focused charter schools, but also see gains in other models as well.
Classical charter schools demonstrate impressive gains with CWD and ECD students in RLA (0.36 and 0.45 stdv). In math, these populations performed 0.21 stdv higher in classical schools. High Expectations schools show gains for LEP and ECD populations in math (0.10 and 0.13 stdv) but notably do not show similar gains for students with disabilities.
Discussion
Given the myriad of data limitations, this work will require additional replication and verification, but the preliminary findings are still interesting. The authors were particularly surprised by the emergence of the Classical, STEM, Montessori, and Art models as some of the highest achieving on ELA and math exams. This paper does not reach a conclusion on why these models outperform others. They could be exceptionally effective, or there could be something unique about the families that choose these education environments. Alternatively, these models may uniquely align with math and reading exams in a way that other models like CTE, Language Immersion, and others may not. There are a variety of hypotheses that deserve testing, but this paper simply seeks to establish that these disparities exist. The fact that these disparities exist raises an important concern.
Until the charter sector can establish why these disparities exist the continued use of ELA and Math exams, alone, to evaluate the performance of specialized schools is problematic. It may be the case that authorizers are revoking charters using a framework that inequitably evaluates schools. One temporary solution to this would be a more wholistic approach to evaluation. Authorizers should work with schools to establish alternative metrics that are in line with their mission. These could include specialized exams, classroom inspections, or the inclusion of alternative outcome measures.
The authors hope that this first step will lead to new research that explores which educational components lead to success within models and what lessons might be shared and replicated across a wider array of schooling options. In this way, charter schools can leverage their autonomy to innovate for the betterment of all students regardless of their family’s choice in school.
Acknowledgments
We would like to thank James Shuls for the feedback he provided on a previous draft of this paper, as well as the attendees at the International School Choice and Reform Conference for their ideas and suggestions.
Disclosure statement
No potential conflict of interest was reported by the authors.
Correction Statement
This article has been corrected with minor changes. These changes do not impact the academic content of the article.
References
- Ackerman, M., & Egalite, A. J. (2017). A critical look at methodologies used to evaluate charter school effectiveness. Educational Assessment, Evaluation and Accountability, 29(4), 363–396. https://doi.org/10.1007/s11092-017-9266-0
- Ahearn, E. M. (2008). Special education in the new national educational data system. Communication Disorders Quarterly, 29(4), 236–238. https://doi.org/10.1177/1525740108321449
- DeNisco. (2016). Who’s still testing with PARCC and smarter balanced? (NEW LEARNING STANDARDS) (partnership for assessment of readiness for College and careers). District Administration, 52(8), 15.
- Egalite, A. J., & Wolf, P. J. (2016). A review of the empirical research on private school choice. Peabody Journal of Education, 91(4), 441–454. https://doi.org/10.1080/0161956X.2016.1207436
- Gewertz, C. (2017). What tests does each state require. Education Week, 36(21), 8. https://www.edweek.org/teaching-learning/what-tests-does-each-state-require/2017/02
- Ginsburg, A., & Smith, M. S. (2019). Maximizing the usefulness and use of large federal school-data collections. Journal of Research on Educational Effectiveness, 12(4), 594–615. https://doi.org/10.1080/19345747.2019.1654575
- Hanushek, E. A. (2006). Choice, charters, and public-school competition. Federal Reserve Bank of Cleveland, 1. https://files.eric.ed.gov/fulltext/ED505635.pdf
- Hanushek, E. A., Kain, J. F., Rivkin, S. G., & Branch, G. F. (2007). Charter school quality and parental decision making with school choice. Journal of Public Economics, 91(5–6), 823–848. https://doi.org/10.1016/j.jpubeco.2006.09.014
- Jochim, A., & McGuinn, P. (2016). The politics of the common core assessments: Why states are quitting the PARCC and smarter balanced testing consortia. Education Next, 16(4), 44–53. https://link.gale.com/apps/doc/A464163362/AONE?u=mlin_oweb&sid=googleScholar&xid=31f8d8d2
- Kisida, B., & Wolf, P. J. (2010). School governance and information: Does choice lead to better- informed parents? American Politics Research, 38(5), 783–805. https://doi.org/10.1177/1532673X09350981
- Maranto, R., & Shakeel, M. D. (2021). Covid, capitol insurrection, and (A Lack Of) education—time for E.D. Hirsch? Journal of School Choice, 15(1), 1–6. https://doi.org/10.1080/15582159.2021.1883904
- Monarrez, T., & Chingos, M. (2020). Can we measure school quality using publicly available data? Research Report. Urban Institute
- The National Alliance for Public Charter Schools (NAPCS). 2022. The data dashboard. https://data.publiccharters.org/
- National Association of Charter School Authorizers (NACSA). 2021. Authorizer types across the Country. https://www.qualitycharters.org/authorizer-types/
- National Center for Education Statistics (NCES) 1. State Education Practices (Sep). 2018. Retrieved December 5, 2021 from https://nces.ed.gov/programs/statereform/tab2_16.asp
- National Center for Education Statistics (NCES) 2. State Education Practices (Sep). Retrieved December 5, 2021, from https://nces.ed.gov/programs/statereform/tab2_4.asp2018
- Reardon, S., Kalogrides, D., & Ho, A. (2016). Mapping US school district test score distributions onto a common scale, 2008-2013. Society for Research on Educational Effectiveness, 1–4. https://files.eric.ed.gov/fulltext/ED567495.pdf
- Reardon, S. F., Kalogrides, D., & Shores, K. (2016). Stanford Education Data Archive (SEDA) Summary of data cleaning, estimation, and scaling procedures. Stanford Center for Education Policy Analysis, 1–6. https://webcache.googleusercontent.com/search?q=cache:dzqQJWM2vH4J:https://cepa.stanford.edu/sites/default/files/SEDA%2520data%2520construction%2520documentation%2520v01.docx+&cd=1&hl=en&ct=clnk&gl=in
- Shuls, J. V. (2018). School choice: The personal and the political. Journal of School Choice, 12(1), 80–97. https://doi.org/10.1080/15582159.2017.1374151
- White, J. 2019 Modified count report, National Alliance for Public Charter Schools. https://www.publiccharters.org/our-work/publications/2019-modified-count-report
- White, J., & Huang, L. (2022). A census of all specialized charter school foci and models. Journal of School Choice, 16(1), 11–42. https://doi.org/10.1080/15582159.2021.1995692
- Winters, M. A. (2017). New York charter schools outperform traditional selective public schools: More evidence that cream-skimming is not driving charters’ success. Report 33. Manhattan Institute for Policy Research.