
ABSTRACT
The COVID-19 pandemic disrupted the K-12 education system. We surveyed 4,162 parents across five districts in rural Jharkhand to examine which K-12 service provider parents perceived to be responsive during COVID-19. We rely on parental perception, satisfaction, and aspirations to evaluate and compare the COVID-19 responsiveness of public and private education providers in rural Jharkhand’s low-income neighborhoods. We also test children on a functional literacy and numeracy tool to corroborate parental perception. We find that a higher proportion of parents perceived that private education providers were responsive during the COVID-19-induced lockdown compared to public schools. We also observe that parental perception is aligned with the learning scores of children.
Introduction
The COVID-19 pandemic brought unprecedented challenges to the global education landscape, with schools worldwide shutting their doors to contain the outbreak (UNESCO, Citation2021a). This disruption in K-12 education led to significant learning losses, especially in middle- and low-income countries (World Bank, Citation2022). In South Asia, the 273-day school closure potentially escalated global learning poverty from approximately 57% to 70%, undoing the gains made since 2000 (Azevedo et al., Citation2022; World Bank, Citation2022).Footnote1
However, these learning poverty estimates are simulations based on assumptions about the impact of school closures and the effectiveness of remote instruction on learning levels. It is crucial to contextualize such projections with information on how K-12 education providers adapted to ensure the continuity of education during the pandemic. Such data would help to fortify the education system for future challenges.
Numerous studies have explored how schools worldwide adapted to the pandemic (United Nations, Citation2020). Some indicated positive developments, such as an increase in innovative home-schooling methods (Bubb & Jones, Citation2020), high satisfaction with online education modes (Garbe et al., Citation2020; Giovannella et al., Citation2020), and greater student engagement (Andrew et al., Citation2020). Other studies provided a grim view by raising concerns like perceived learning slowdown and unequal access to technology during COVID-19 (Horowitz & Igielnik, Citation2020; Londberg & Crutchfield, Citation2020; Meinck et al., Citation2022).
Parents, key stakeholders in the K-12 education ecosystem, were central to the transformations that occurred during COVID-19. It is well-documented that parental attitudes and perceptions play a critical role in influencing student attitudes, student performance, family-school engagement, and school choice (Bukhari & Randall, Citation2009; Cohen et al., Citation2009; Eccles, Citation2007; Harackiewicz et al., Citation2012; Roeser & Eccles, Citation1998; Schueler et al., Citation2014).
During school closures, several parents assumed the primary responsibility for their children’s education and were able to closely observe the education imparted by various service providers (Carpenter & Dunn, Citation2021). Their unique vantage point during this period offers invaluable insights into the adaptability of education providers. While some studies have captured parental perception during the pandemic’s early stages in India (ASER, Citation2021; Central Square Foundation [CSF], Citation2021a; UNICEF, Citation2021; Vegas et al., Citation2021; Vyas, Citation2020) and across the globe (Carpenter & Dunn, Citation2021; Haller & Novita, Citation2021; Jabbari et al., Citation2022), many suffer from selection bias due to their reliance on virtual data collection methods. Further, parental perception and school responsiveness evolved during the pandemic – an aspect that these studies do not capture (Huck & Zhang, Citation2021). Finally, most Indian studies have focused on the response of the government (Charania et al., Citation2021; Daimary, Citation2020; Dhaygude et al., Citation2022), with limited reflection on private education providers, including tutors, and parents’ experiences with them.
Our paper aims to bridge these gaps. We surveyed 4,162 parents across five rural districts in Jharkhand to evaluate the responsiveness (defined in the Methodology section) of education providers during the pandemic. We relied on parental perception, satisfaction, and aspirations to compare the performance of education providers. To corroborate parental perception, we tested their child on a functional literacy and numeracy tool developed by the ASER Centre (Citation2018).
The paper is structured as follows. Section “Background and literature review” reviews the literature on education delivery during COVID-19 and identifies gaps. Section “Methodology” elaborates on the research design, concepts measured, and data collection and analysis methods. Section “Results and discussion” presents the results of the survey and tests three hypotheses: (i) parents perceived private education providers as more responsive than public providers during the lockdown; (ii) parental perception and satisfaction are aligned with their child’s performance on test tools; and (iii) if money were not a barrier, most parents would opt for private providers. Section “Conclusion” concludes with key insights and potential areas for future research.
Background and literature review
Global responses to the pandemic in education
The global education landscape witnessed varied responses to the shifts in K-12 education during the pandemic. In Norway, innovative home-schooling methods, greater student independence, and more creative learning emerged during the lockdown (Bubb & Jones, Citation2020). In Italy, a study of 336 teachers showed that they found online education modes to be satisfactory and sustainable (Giovannella et al., Citation2020). In the United States, many parents were satisfied with the remote instruction offered by schools (Garbe et al., Citation2020) and found charter and private schools to be especially responsive (Carpenter & Dunn, Citation2021; Jabbari et al., Citation2022). Haller and Novita (Citation2021) reported that teacher- and school-related characteristics were key determinants of parental satisfaction during this period. Since several private schools were open for face-to-face learning in 2020–21, Scafidi et al. (Citation2021) documented an increase in their enrollment numbers. Other studies highlighted how e-learning exacerbated the digital divide in many countries (Andrew et al., Citation2020; Meinck et al., Citation2022).
Before reviewing similar studies conducted in India, we provide a brief context on K-12 education in India.
Background on K-12 education in India
India has the second largest schooling system after China, catering to ~250 million children (MHRD, Citation2018). It comprises public schools, private unaided schools, and government-aided schools that are funded by the government and managed privately (Mousumi & Kusakabe, Citation2020). Public or government schools constitute 68% (10,32,049) of all schools in the country. Private unaided schools constitute 23% (3,40,753) of the total schools, and government-aided schools make up 6% (84,295) of all schools (MoE, Citation2021b). Roughly 3% of the schools are either unrecognized private schools or Madrasas (Mathur & Narang, Citation2022).Footnote2
Among middle- and high-income countries, India has the lowest proportion of supporters (46%) for public provisioning of education (UNESCO, Citation2021b).Footnote3 Consequently, despite the provision of free education in government schools, nearly half the students attend private schools (Narang & Sudhakar, Citation2022). Private schools have seen a steady increase in enrollment since 2011 (Kingdon, Citation2017). Among low-income households, approximately 90 million children attend 400,000 budget private schools (Khandelwal, Citation2018). Although, historically, private school enrollments were high only in urban areas (Chudgar & Creed, Citation2016), rural areas have also registered a rise in the last five years (MoE, Citation2020, Citation2021b).
Parents often supplement their children’s school education with private tutoring. This refers to paid, post-school lessons designed to offer additional instruction to children in subjects they study at school (Dang & Rogers, Citation2008). Such classes are conducted either one-on-one or in groups. In India, while the incidence of private tutoring remained steady at 25% for years, it rose sharply to almost 40% in 2021. These classes may have mitigated the impact of school closures by keeping children involved in learning activities (ASER, Citation2023a).
The pandemic resulted in an 82-week-long school closure in India – the second longest after Uganda (UNESCO, Citation2022) – compelling government and private schools to adapt. This period witnessed a decline in private school revenue by 20%–50% (CSF, Citation2021a) and in private school enrollments, with many financially distressed parents shifting their children to government schools (Kalra, Citation2020).
Private schools declined by over 10,000 across 20 major Indian states during COVID-19 (Datta & Kingdon, Citationforthcoming). In Jharkhand, the number of recognized private schools fell by 8%, i.e., from 8,128 in 2019 to 7,484 in 2021 (Datta & Kingdon, Citationforthcoming).Footnote4
India’s education response to COVID-19
Most research in India focused on government schools’ responses to the pandemic. For instance, Daimary (Citation2020) found that government schools in rural Assam were underprepared to transition to e-learning. Dhaygude et al. (Citation2022) documented that students in poorly funded public schools could not access online education. Charania et al. (Citation2021), through interactions with government school teachers and students in Eastern India, highlighted that students benefited from using technology and project-based learning during COVID-19.
Other studies examined the financial challenges faced by low-fee schools (CSF, Citation2021a; Narang & Sudhakar, Citation2022) and the experiences of students and teachers with online learning (CSF, Citation2021a; Gupta, Citation2021; Jain et al., Citation2021; Meinck et al., Citation2022; Selvaraj et al., Citation2021; Verma & Priyamvada, Citation2020). Given the limited preparedness to adopt a virtual model, teachers and students expressed a preference for traditional education (Selvaraj et al., Citation2021).
While some researchers engaged with parents to understand school performance during the pandemic (ASER, Citation2021, Citation2023a; CSF, Citation2021a; UNICEF, Citation2021; Vegas et al., Citation2021; Vyas, Citation2020), they did not assess parental satisfaction or aspiration. For instance, Vyas (Citation2020) compared the performance of government and private schools based on what 1200 parents across five states reported—20% of parents said that education was delivered in government schools, compared to 40% in private schools. But, they do not document parental satisfaction with the education imparted. Similarly, ASER (Citation2021) enquired from parents whether schools provided learning materials such as textbooks during the lockdown (91% of parents across school types mentioned they did) but did not examine how parents perceived education delivery. Further, ASER (Citation2021) and Vyas (Citation2020) had to rely on phone surveys or virtual data collection methods that may have resulted in selection bias. Finally, these studies were conducted early in the pandemic and are inadequate for comparing parental perception before, during, and after the COVID-19 lockdowns.
We bridge these gaps by studying parents’ perceptions, satisfaction, and aspirations pertaining to education providers in rural Jharkhand. The next section provides an overview of our methodology.
Methodology
Selection of the survey site
Amidst the challenges posed by the pandemic, urban areas with robust digital infrastructures were better positioned to transition to virtual instruction. Rural India, which houses over 60% of India’s total population (World Bank, Citationn.d.), faced significant barriers due to limited resources. Our study focused on rural Jharkhand to examine the responsiveness of public and private educators in such resource-constrained settings.
We chose Jharkhand as our survey site for several reasons. First, it has a complex demographic, with nearly 25% of the population being tribal communities. Second, it has one of the lowest per capita incomes in India, i.e., INR 78,660 (~$942.66) as of 2021–22 (Ministry of Statistics & Programme Implementation, Citation2023). Third, despite low enrollment in private schools, Jharkhand has one of the highest proportions of students enrolled in private tutoring in rural India (45.3%, per ASER, Citation2021).
Sampling approach
Jharkhand comprises 24 districts.Footnote5 During the 2011 census, Jharkhand’s population was 33 million (Government of Jharkhand, Citationn.d.-a). Although the next round of census is yet to be conducted, the state’s estimated population for 2023 is 40.5 million. Due to resource constraints and Jharkhand’s challenging terrain, a comprehensive survey of all districts was impractical. We employed purposive sampling to concentrate on the districts most relevant to our research objectives. Although this approach may introduce bias – because all districts do not stand an equal chance of selection – the benefits of research relevance and feasibility outweigh this limitation.
In Jharkhand, roughly 4% of the schools are recognized private schools, and over 80% are government-run.Footnote6 Given the low per-capita income of the state, there are likely fewer opportunities for setting up private schools. However, Jharkhand also has one of the highest proportions of unrecognized private schools (Gurdatta & Narang, Citation2022).Footnote7 Once such schools are taken into account, the proportion of private schools in Jharkhand becomes comparable to that in several other low-income states.
To conduct a meaningful comparison, we targeted districts where both school types were operational, and the proportion of private schools was higher than the state average.Footnote8 Seven districts fit these criteria: Bokaro, Dhanbad, Hazaribag, Lohardaga, East Singhbhum, Ramgarh, and Ranchi. Lohardaga was excluded as the proportion of private schools (~5%) in the district is only marginally above the state average. We then analyzed student performance from grades 3 to 10 on the National Achievement Survey (MoE, Citation2021a).Footnote9 To ensure a mix of high- and low-performing districts, we chose Bokaro, Dhanbad, East Singhbhum, Ramgarh, and Ranchi as our samples. In three districts, students performed better than the state average; in two districts, the performance was worse than the state average in some or all subjects. The proportion of private schools in these districts ranges from 7–10%.
To select villages and households within a district, we adopted the methodology used by the ASER Centre. ASER is the sole organization that annually tests the functional literacy and numeracy of children across rural India. ASER determines its sample size based on population incidence and deems 600 households as representative of a district (ASER, Citationn.d.).
ASER follows a two-stage sampling strategy within a district. First, 30 villages are selected from the 2001 census village directory using the Probability Proportional to Size (PPS) method.Footnote10 Next, 20 households are randomly selected for the survey in each village. Instead of creating a list of households in a village, ASER uses a more efficient method to maintain randomness. Field researchers sketch a map of the village, divide it into four roughly equal sections, and, starting from the center of each section, select every 5th household until 20 households are surveyed (ASER, Citationn.d., pp. 2–3).
ASER evaluates all children aged 5–16 in 600 households per district. Since there is an average of two children per household, their total respondent count ranges between ~1000–1200 in a district. We surveyed one parent per household. For parents with multiple children, we gathered data on the eldest child (within the age group 9–16) available at home during the survey. This approach minimized respondent fatigue since each survey lasted 30–40 minutes. To match ASER’s respondent count per district (~1200), we chose 60 villages in each district based on the PPS method and 20 households in each village using ASER’s strategy.
Concepts measured
We examine the responsiveness of public and private education providers during the pandemic based on parental perception. We comprehensively reviewed the literature that studied schools’ responses to COVID-19 lockdowns. Based on the insights, we captured parents’ views on how education providers handled the following during the lockdown: (i) delivery of learning materials, (ii) engagement with children via online classes, (iii) evaluation of children to track their learning progress, and (iv) feedback to parents on their child’s performance.
We also gauged parents’ satisfaction with the service providers and the quality of education their child received before, during, and after the COVID-19 lockdowns.
Lastly, we documented the aspirations of parents by enquiring whether they would continue or begin using specific education services (such as private schools and tutoring) if there were no financial barriers.
Questionnaire design
To build the questionnaire, we conducted a qualitative study with 60 parents across six villages (Agru, Bajpur, Chankiyari, Lahna, Mayapuri, and Ramnitanar) in two rural districts of Jharkhand (Ranchi and Giridih) using convenience sampling. Feedback from this study informed our questionnaire. For example, while probing how parents perceive the quality of study materials shared by schools, we observed that most parents were not this closely involved in their children’s education. Consequently, we focused our questions on overall satisfaction with education, which parents felt comfortable answering. Notably, many parents expressed a preference for private schools and tutoring but felt limited by financial constraints. We adjusted our questionnaire to capture these sentiments.
Our final survey instrument comprised four segments (detailed in the Annexures).Footnote11 The first three segments gathered insights from parents on (i) how government and private schools adapted during the pandemic, (ii) whether their children relied on non-school service providers for their education and the way these providers operated, and (iii) their overall satisfaction with their child’s education. Under the fourth segment, surveyors tested the concerned child (oldest within the 9–16 age group) using ASER’s tools (Citation2018).
The questionnaire covered three timeframes: (i) pre-lockdown (before the March 2020 lockdown due to COVID-19), (ii) during lockdown (March 2020 to February 2022); and (iii) post-lockdown (after schools reopened until the survey in August-October 2022).
Sample characteristics
During the survey process 12,696 households were approached. Of these, some houses were shut, others did not have a child aged 9–16, and in yet others, the parent/guardian was unavailable or unwilling to speak. Consequently, we obtained complete survey responses from 6,086 households (47.9%). After data accuracy checks, we retained 4,162 valid responses (see Annexure for details). Since our study compares parents’ experiences with service providers before, during, and after the lockdown, selecting the 9–16 age group for children helped ensure that they were of school-going age before the pandemic.
51% of our respondents were females, and ~ 49% were males, with an average age of 39. Respondents, on average, had two children and resided in a household with five (median) members.Footnote12 The average education level of the respondents ranged from 5th to 8th grade. Over 65% of the respondents had internet access, and ~ 70% owned a working smartphone. Parents with children in private schools had better access to smartphones (86.7%), the internet (81%), and television (57%) than those with children in government schools (64.5%, 60%, and 35.4%, respectively). The average age of children who took the literacy and numeracy test was 12.5 years (in both school types).
Data collection
We contracted local survey agencies in Jharkhand (many of whom were familiar with ASER’s methods) to collect data. We conducted a three-day training for surveyors in each district, including a pilot study in neighboring villages. Two surveyors were assigned to each village for the survey. The surveys were conducted from August to October 2022.
Surveyors obtained consent from all respondents before proceeding with the survey. The responses were recorded on a mobile application. The survey was conducted in Hindi and lasted 30–40 minutes per respondent. While most respondents were familiar with Hindi, surveyors used local dialects in a few cases where the respondents struggled. ASER’s test tool was administered to the eligible child in Hindi (a language taught at schools in Jharkhand).
Data cleaning and analysis
Our data cleaning process included reviewing the integrity and completeness of the dataset (refer to Annexures). The cleaned dataset, prepared in MS Excel, was used for descriptive and inferential analyses. Our analysis focused on comparing the responsiveness of public and private (schools and tutors) education providers during COVID-19. Consequently, we disaggregate results based on school type and private tutoring enrollment for each period. We also conducted a multivariate regression analysis to assess factors influencing children’s test scores.
A small proportion of respondents reported sending children to government-aided schools and Madrasas. The number of respondents in these categories was too low to conduct any meaningful analysis and were, therefore, excluded.
Limitations
Our study has three limitations. First, since we did not rely on random sampling for district selection, our data has limited generalizability across Jharkhand and rural India. Second, our findings depend only on parents’ reports and may suffer from bias or recall challenges. There may be gaps in parental perception and reality. Third, we used ASER Centre’s two-stage cluster sampling method, which, while rigorous, might affect the statistical precision of district-level data (ASER, Citationn.d., pp. 2–3).
Results and discussion
Schools in Jharkhand were shut for over 1.5 years. Through parental perceptions, this section explores how K-12 service providers adapted their engagement with students during this period. We also capture parents’ satisfaction with education services pre-, during, and post-lockdown. Finally, we present literacy and numeracy test results and compare them with parents’ assessments.
Enrollment trends pre-, during, and post-lockdown
Enrollment in government and private schools
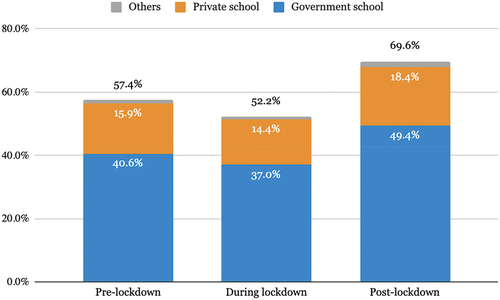
depicts the enrollment levels in government and private schools across three distinct periods: pre-, during, and post-COVID-19 lockdowns.Footnote13
Table 1. Enrollment in government and Private Schools.Footnote14
During the lockdown, roughly 15% of parents reported that their children dropped out of school, primarily due to affordability concerns (37%) and children’s waning interest in academics (23%). Once the lockdown was lifted, there was a 2.7% point decline in private school enrollment (25.3%) and a 3.3% point rise in government school enrollment (72.3%) from pre-lockdown levels.
Three trends are salient. First, most parents enrolled their children in government schools across all three periods, likely due to financial constraints and the limited availability of private schools in low-income neighborhoods. Second, while our findings align with the nationwide trend of rising government school enrollment since the pandemic, the percentage point increase in the surveyed districts (3.3%) is lower than the national average (7.3%, per ASER, Citation2023b). This is likely due to the already high government school enrollment in Jharkhand. Third, the spike in dropouts during COVID-19 was temporary and recovered to the pre-lockdown levels by September 2022.
Enrollment in Private tutoring
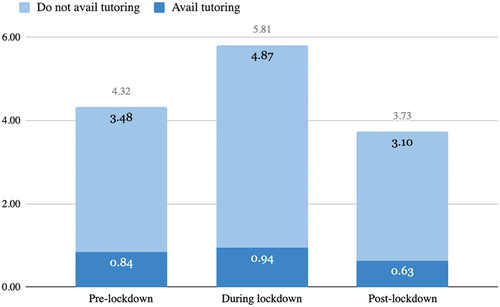
shows the proportion of parents who opted for private tutoring for their children, segmented by school type.
Figure 1. Enrollment in Private Tutoring.Footnote15
More than 50% of the surveyed parents, across all periods, availed of private tutoring, surpassing the state average of 45.3% (ASER, Citation2023a). Despite a slight dip during the lockdown (~5% points), nearly 70% of the parents had opted for tutoring by the time the lockdown lifted ().
Sixty-one per cent of government and 65% of private school parents sought tutoring. Parents revealed that they use the services of private tutors because of the close attention their child gets in such classes. Consequently, even amidst the financial strains of COVID-19, the demand for private tutoring remained robust. Notably, many parents who choose government schools due to their limited means still invest in fee-based tutoring and see it as a valuable supplement for school education. As we discuss later, the average fee for tutoring is lower than that of private schools, making it an accessible and affordable option for many.
Uptake of online non-school services
Only 3.5% of the surveyed parents reported that their children relied on online resources like YouTube for educational content, even though ~70% of them own smartphones, and such platforms tend to be low-cost.
Delivery of education during lockdown
Learning resources provided to children
We sought parents’ insights on how K-12 education providers engaged with children during the lockdown. For both government and private schools, ~64% of parents reported that schools either organized online classes or distributed learning materials.Footnote16 Private schools provided a greater diversity of materials – among those who received materials from private schools, 28% reported receiving two or more resources, compared to 17% from government schools.
Service providers differed in the learning resources they prioritized. Government schools predominantly focused on distributing textbooks. In contrast, private schools relied most on online classes to engage with children. For tutors, worksheets were the primary tools for engagement ().
Table 2. Learning materials shared during the lockdown.
Lavy (Citation2015) finds that instructional time has a weak but positive effect on children’s test scores in developing countries. While the effect likely varies across in-person and virtual instruction, online classes emerged as the closest alternative to traditional in-person classes for fostering student engagement during COVID-19. On this parameter, private providers were more responsive. 43% of private school parents reported their children attended online sessions, averaging four hours over three days a week. Government schools lagged slightly, with 31% of parents noting three-hour online sessions over two days a week, on average.Footnote17 Vyas (Citation2020) argues that government schools’ limited virtual engagement was guided by the intent to be more inclusive of students without internet or smartphone access. However, 64.5% of government school parents owned smartphones, and their children would have likely benefited from virtual interactions with teachers.
Only a minuscule proportion of parents indicated that tutors held online classes. However, during the survey, it became evident that enrollment in tutoring typically meant regular classes, either in-person or online. Thus, while only 8% of parents mentioned online tutoring classes, 92% had their children attend in-person classes, averaging 6.5 hours per week. By virtue of being informal and small-scale in their operation, tutors were not as constrained by lockdown measures. This is salient as tutors were likely the only in-person education service available to parents during the lockdown.
Medium of engagement
In line with other studies (ASER, Citation2021; CSF, Citation2021b), we found that WhatsApp was the most common medium for sharing learning materials (). While private schools primarily relied on WhatsApp, 42% of government school parents said they had to visit the school to collect the learning materials. This may have been a deterrent for other parents with limited motivation. Since most tutoring lessons were conducted face-to-face, 60% of parents mentioned receiving resources from tutors in person.
Table 3. Medium for delivery of learning materials.
Notably, while the Government of Jharkhand launched the “Digi School App” to share digital learning resources and 64% of government school parents owned smartphones, only 5% mentioned using online apps for accessing materials. Although we did not investigate this further in our survey, there may be several reasons for the low uptake. Since the application was introduced during the lockdown, it was likely difficult to publicize it among parents and students in rural Jharkhand. Further, students may have struggled to switch from offline to online learning via an application without any training on making this transition. Finally, it is possible that students/parents did not find the application useful.
Evaluation and feedback during lockdown
Lockdown necessitated some degree of self-study or training at home. Consequently, periodic assessment of the child and feedback to parents became essential for monitoring the child’s progress.
Evaluation frequency and method
We inquired if service providers assessed children’s learning progress during the lockdown. 69% of private school parents reported that their child was evaluated, compared to 58% of government school parents. Among parents who avail of tutoring, 79% said that tutors evaluated their children.Footnote18
A higher percentage of private school parents (62.5%) mentioned that schools evaluated their children at least once a quarter, compared to government school parents (55%). Tutors were the most proactive—92% of parents confirmed that tutors conducted assessments at least once a quarter.
Tutors and government schools primarily relied on homework assignments for evaluation (). In contrast, private schools also focused on employing on-the-spot online tests mirroring the traditional examination format.Footnote19
Table 4. Tools used for evaluating children during the Lockdown.Footnote20
Parent-teacher interaction
Regular feedback to parents is crucial for evaluations to influence a child’s future performance constructively. It can also boost parental motivation and involvement in the child’s education. More parents who send their children to private schools (51%) reported receiving regular feedback from teachers (i.e., at least once a quarter) compared to those who enroll children in government schools (34%).
Parental satisfaction with education providers
In this section, we examine parents’ perception of the quality of education their children received and their satisfaction with K-12 service providers pre-, during-, and post-lockdown. Instead of gauging satisfaction with a specific service provider, we asked whether parents are satisfied with their child’s education. For analysis, we grouped parents’ responses based on the type of school their child attended and whether they availed of tutoring.
Our analysis reveals higher satisfaction among parents who opt for private education providers (tutors and schools).
Parental satisfaction with overall education
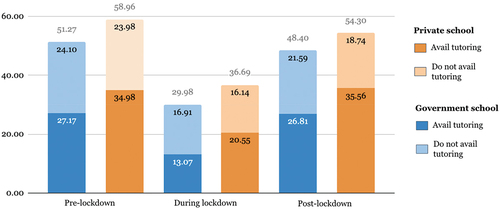
highlight the proportion of parents who believe their child received a good quality education and are happy with it.
Figure 2. Percentage of parents who reported that the overall education quality is Good.Footnote21
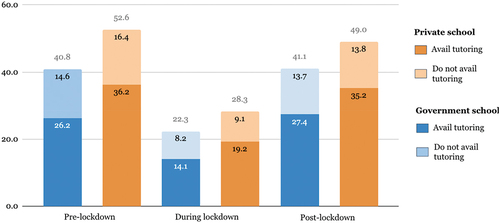
Figure 3. Percentage of parents who were very happy with their Child’s Education.Footnote22
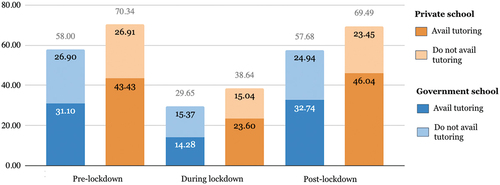
Four trends emerge. First, a higher proportion of private school parents perceived their child’s education as good and were satisfied with it, compared to government school parents. This is true across periods. Second, across schools, a higher proportion of parents who avail have a favorable view of their child’s education than those who do not.Footnote23 Third, more private school parents who avail tutoring are satisfied than government school parents who opt for tutoring. As discussed later, government school parents avail cheaper tutoring services, which may be of lower quality and explain their lower satisfaction. Fourth, the proportion of parents satisfied with their child’s education post-lockdown was similar to the pre-lockdown level across schools. This suggests that the disruptions in education during the pandemic were short-lived, and the system bounced back to normalcy.
Perceived role of different service providers
We asked parents to pick the top three services that played a crucial role in their child’s education. During the lockdown, 47% of parents felt private tutoring was crucial for their child’s education, while 35% believed school played an essential role. However, pre- (57%) and post-lockdown (60%), a greater proportion of parents thought that schools were valuable for their child’s education compared to those who picked private tutoring (47% pre-lockdown and 52% post-lockdown).
Parents cited test results, accessibility to learning materials, and student engagement as primary reasons for their satisfaction.
Parental perception of children’s academic performance
We inquired how parents viewed their child’s academic performance ().
Figure 4. Percentage of parents who thought their child was doing well Academically.Footnote24
These trends are similar to those in the previous section. A higher proportion of private school parents had a positive view of their child’s academic performance across periods than government school parents. Within each school type, a greater percentage of parents who opted for tutoring viewed the child’s performance favorably than those who did not.Footnote25 Finally, a higher proportion of private school parents who opted for tutoring thought their child was doing well than government school parents who avail of tutoring.
Awareness of children’s academic performance
A subset of parents stated that they were unaware of their child’s academic performance. The number of parents who picked this response across all time frames was higher in the case of government schools.
Most of these parents had not opted for private tutoring (). Private tutoring likely offers parents a clearer view of their child’s academic standing.
Figure 5. Percentage of government school parents unsure of their child’s performance.
In contrast, a negligible proportion of private school parents were unaware of their child’s performance (0.8%, 1.8%, 0.4% and pre-, during-, and post-lockdown, respectively).Footnote26 This could be because parents who send their children to private schools are either more involved in the child’s education or receive periodic feedback from the school. Since private schools charge a fee, it may be in the parents’ interest to remain aware and hold schools accountable.
Comparing parental perceptions with children’s learning levels
Some contend that parental choice and evaluations, particularly in low-income settings, are ill-informed (Azim Premji Foundation, Citation2018). We assessed children’s learning levels using the ASER tool for reading and math to validate parents’ opinions. The tool only gauges foundational literacy and numeracy (not advanced competencies). It allows students to be graded on five levels on Reading and Math in increasing order of proficiency.
We calculated an aggregate score for each child to compare performance. For instance, a child at level 5 in reading and math would score 10. If the child is at the “word” level in reading and the “subtraction” level in math, their score would be 7 ().
Table 5. Scores based on performance on the ASER Tool.
It is important to note two aspects. First, the total score out of 10 is not a percentage or grade point. It signifies a child’s competency level. The difference between scores 2 and 3 in reading is not just one point but represents the gap between a child who can only recognize letters and one who can read words. Thus, when comparing averages, the difference of a few decimal points may be significant. Second, this is an assessment of foundational skills. Since the average age of test-takers was ~12 years, the scores do not follow a normal distribution. Most scores fall between 8 and 10, and a score below 8 is concerning.
Perception of academic performance vs. actual performance
We categorized our data based on how parents perceived their child’s academic performance post-lockdown and calculated the average score for children in each category ().Footnote27 Our findings show a relationship between parents’ perceptions and children’s scores. The average score of children whose parents have a favorable view of their performance is higher than that of children whose parents thought they were struggling.Footnote28
Table 6. Parents’ assessment of academic performance vs. Children’s average scores out of 10.
Two caveats must be noted. First, these scores reflect foundational skills that are not necessarily linked to the child’s performance in school. Second, the analysis does not establish any causation.
The lowest scores correspond to parents who reported they were “unsure” of their child’s performance. Either such parents were aware but reluctant to admit their child was lagging, or parental awareness and involvement influenced children’s scores. These findings merit further exploration into the impact of parental involvement on learning outcomes.
Perception of education quality vs. actual performance
We also compared children’s average scores based on parental perception of education quality (). The average scores of children whose parents have a positive view of education quality are higher than that of children whose parents think the quality is poor – a difference of ~27%. As noted earlier, children’s average scores reflect their foundational skills instead of performance in school.
Table 7. Parental perception of education quality post-lockdown vs. Children’s average scores out of 10.
Satisfaction with education quality vs. service provider inputs
To test whether parents rely on “educationally unimportant” characteristics in assessing service providers (Azim Premji Foundation, Citation2018), we asked parents how they evaluate education quality. Over 65% reported relying on test scores. Another significant factor was positive feedback from teachers on children’s performance (22%).
We also examined whether a provider’s engagement with children and provision of learning materials during the lockdown influenced parental satisfaction. We calculated an average learning materials score based on the variety of materials parents reported receiving (online classes, prerecorded videos, textbooks, audio, and worksheets). Each resource is assigned a score of 1, so if a parent received three resources, the score would be 3. We also documented the average hours children spent on classes conducted by schools and tutors.
Our data reveals an alignment between the engagement level and how parents perceive education quality ().
Table 8. Parental perception of education quality vs. Engagement by service providers during the lockdown.
Average learning score by service-provider
Our analysis revealed that a higher proportion of parents were satisfied with private providers. To unpack this, we compared the average score of children based on their school type and enrollment in tutoring. The results are comparable since the average age of the students we tested from government and private schools was the same—12 years.
We find that students who attend private tutoring have better scores than those who do not (). Two trends are notable. First, the difference in scores is more pronounced for government school students who avail of tutoring (10%) than private school students who do so (3.4%). Second, the average score of private school students is higher than government school students, irrespective of tutoring.
Table 9. Learning scores based on school type and tutoring.
While the score variations may explain why parents are willing to incur the additional cost of enrolling children in tutoring, our results do not establish causation. Further, both tutoring and private schools may be subject to selection bias.Footnote29 Given financial constraints, it is plausible that primarily those parents who are invested in their child’s education or believe their child is bright opt for fee-based education services. However, Tabarrok (Citation2013) challenged the notion that the superior performance of private schools is solely due to “cream skimming.” He finds that the private schooling effect on scores persists even in districts where a significant majority (over 70%) of students attend private schools, making cream skimming unlikely.
These results may be influenced by other confounding variables such as parents’ education, economic status, and motivation. We test this by conducting a multivariate analysis later in the paper.
Parental aspirations
In the United States, enrollment in private schools increased during COVID-19 despite the economic recession. The primary factor that prompted parents to move from public to private schools was that, in several areas, only private schools offered in-person classes (Scafidi et al., Citation2021). While our analysis indicates that parents perceived private schools as more responsive than government schools during the lockdown, private school enrollment remained low. Affordability concerns likely explain this discrepancy.
We examined parental aspirations to gain insight into the services parents value but cannot access due to socio-economic constraints. Parents reported that private schools charge an average of INR 600 ($ 7.26) monthly or INR 7200 ($ 87.08) annually. For some, this is unaffordable.
However, many parents reported that they would prefer private schools and tutoring for their children if finances were not a barrier.
Among parents who send their children to government schools, 60% expressed a desire to switch to private schools if they could afford it. Conversely, 94% of those with children in private schools mentioned they would maintain their current choice. Of the government school parents who did not use tutoring services, 59% reported that they would opt for these if finances were not a barrier. The corresponding figure for private school parents was 70%.
Interestingly, post-lockdown, 61% of government school parents were availing of tutoring services for their children and spending an average of INR 132 ($ 1.60) monthly on them. Private school parents spend more than twice as much on tutoring – an average of INR 276 ($ 3.34) monthly. This suggests that tutors of varying quality and prices exist in the surveyed districts, and government school parents tend to rely on cheaper and potentially poorer quality services.
Factors influencing foundational learning scores
Research on learning outcomes has identified various factors that influence a child’s academic performance. These include socio-economic status, parental involvement and motivation, child’s motivation, school type, private tutoring, and engagement in extracurricular activities (Chevalier et al., Citation2013; Chudgar & Quin, Citation2012; Desai et al., Citation2009; Kingdon, Citation1996; Muralidharan & Sundararaman, Citation2015).
We collected data on some of these factors and conducted a multivariate analysis to discern the extent to which they influence a child’s learning score.
Our regression model tests the dependence of a child’s learning scores (out of 10) on the following five independent variables: (i) parental awareness of the child’s academic performance, (ii) enrollment in private schools, (iii) enrollment in private tutoring, (iv) household economic status, and (v) parent’s education level.Footnote30 A multivariate analysis allowed us to isolate the effect of each variable while holding other factors constant. Note that we tested the dataset for linearity and normality (details are in the Annexures).
The analysis reveals that all the examined factors positively affect the child’s academic performance (). Among these, the highest increase in a child’s score is associated with parental awareness, followed by enrollment in private schools and tutoring. To ensure clear attribution, we repeated this analysis for students who had remained in the same school (government or private) since before the lockdown and found the results to be the same.
Table 10. Multivariate analysis of the factors that influence foundational learning scores of children.
While the effect of economic status and parental education is less substantial, at their maximum values—i.e., for households that own all key assets and parents who have attained a Master’s or higher degree – their effect would surpass that of private schools and tutoring. In a hypothetical situation where all the favorable conditions mentioned in are met, a child’s predicted learning score would be 9.94 out of 10.
Conclusion
The pandemic upended K-12 education across countries and pushed all players to innovate. Evaluating how school and non-school services performed during COVID-19, especially in low-income settings, holds important lessons for reforming and making the K-12 system resilient. Our paper sought to study how different education providers adapted their teaching-learning methods during COVID-19, as perceived by parents in five districts of rural Jharkhand.
Parents perceived private education providers to be more responsive during the lockdown. This higher responsiveness could be due to the accountability framework that fee payment creates between the provider and parents. Private schools’ enrollment levels and sustenance, especially low-fee schools, depended on continued learning engagement with children during the lockdown. This likely incentivized schools to be more innovative and responsive (Carpenter & Dunn, Citation2021). In the case of government schools, limited reliance on online tools was probably driven by the need to be inclusive. This, however, is puzzling given that 64% of government school parents owned smartphones and 60% had access to the internet.
More parents were satisfied with private schools than government schools across the three periods (pre-, during-, and post-lockdown). During and post-lockdown, another private provider became indispensable in educating children – tutors. Our study shows how tutors are especially important providers for those who lack the paying capacity to send their children to private schools but deem additional education support necessary.
Post-lockdown, approximately 72% of surveyed parents sent their children to government schools and 25% to private schools (a fall of 3% points from pre-lockdown levels). Even though parents considered private schools more responsive and satisfying, income and livelihood losses during the pandemic likely pushed them to switch to government schools. School closures may have also prompted the migration between schools. In developed countries like the United States, school choice during the pandemic continued to be guided by considerations like providers’ responsiveness and the mode of education that the parents preferred. Economic factors played a limited role despite the recession (Scafidi et al., Citation2021). Our study shows that in low-income neighborhoods, financial constraints outweigh parents’ preferences. Yet, an examination of parental aspirations shows a clear preference for private providers if finances are taken care of.
Our analysis also hints at how parents in low-income settings do not necessarily rely on “educationally unimportant” characteristics for evaluating different service offerings (Azim Premji Foundation, Citation2018). We observed that parental assessment of academic performance is aligned with students’ actual performance on foundational literacy and numeracy tests. Similarly, parents who were satisfied with their children’s education also reported higher engagement on the part of schools and tutors, and their children’s average scores were high. Further, parents often base their satisfaction on objective factors such as a child’s test scores and feedback from teachers.
In line with what emerges from studying parental perception, the literacy and numeracy scores of children who avail of tutoring and attend private schools are higher than those who do not. Our multivariate analysis finds that while tutoring and private schools positively influence children’s learning scores, the most critical factor is parental awareness.
Finally, our temporal comparison shows how, in most cases, enrollment, satisfaction levels, and perception of academic performance post-lockdown returned to the pre-lockdown levels. This hints at the resilience of the K-12 education system to bounce back and recover from crises. Our analysis corroborates what Carpenter and Dunn (Citation2021) projected using their findings – COVID-19 will likely not result in a permanent change in K-12 schooling.
It is important to be cautious while generalizing the results of this study or using it to establish causation. Our analysis is based on parental perception. Further research is needed to triangulate what parents reported with the on-ground realities in private and government schools. Our analysis opens three key areas for further investigation: (i) test how parents perceive educational services in other parts of rural India, (ii) examine how and whether parental perception maps to reality, and (iii) analyze the role of private entrepreneurship in providing access to quality education in low-income communities.
Response to Feedback_R3.docx
Download MS Word (731.2 KB)Acknowledgments
We thank Ahmed Pathan for assisting in the data analysis process, and Geeta Gandhi Kingdon and Smita Mutt for their feedback on the paper.
Disclosure statement
This research is sponsored by the Templeton World Charity Foundation. The funding does not create any competing interests.
Data availability statement
The data that support the findings of this study are accessible on Harvard Dataverse: https://dataverse.harvard.edu/dataset.xhtml?persistentId=doi:10.7910/DVN/UBH9CS
Supplementary material
Supplemental data for this article can be accessed online at https://doi.org/10.1080/15582159.2024.2352994
Additional information
Funding
Notes
1. World Bank defines global learning poverty as the share of children who cannot read and understand a basic text by age 10.
2. Madrasas are schools run by private Muslim religious sects (Wani & Kidwai, Citation2021).
3. Per the survey cited in the report, 53.6% respondents prefer non-state actors such as private companies, non-profits/charities, religious organizations, and friends/relatives as education providers. This low support for public provisioning of education makes India one of the outliers among countries across the globe (Edlund & Lindh, Citation2021).
4. The Right to Education Act (RTE), 2009 mandates all private schools to obtain a recognition certificate (a kind of licensure). This certificate is contingent on schools meeting certain input norms.
5. These include, Deoghar, Madhupur, Dumka, Bokaro, Giridih, Koderma, Godda, Chatra, Dhanbad, Gharwha, East-Singhbhum, Jamtara, Saraikela-Kharsawan, Ranchi, Pakur, Latehar, Hazaribagh, Lohardaga, Palamu, Ramghar, Simdega, West-Singhbhum, Sahebganj, Gumla, and Khunti (Government of Jharkhand, Citationn.d.-b).
6. Other schools include government-aided and Madrasas.
7. These schools have not obtained a recognition certificate/license under the RTE Act, 2009.
8. We avoided districts and villages that were affected by insurgency.
9. National Achievement Survey evaluates students in grades 3 and 5 on Language, Math, and Environmental Studies. Students in grades 8 and 10 are evaluated on Language, Math, Science, and Social Science.
10. This method ensures that villages with a higher population are more likely to be selected in the sample.
11. Annexures can be accessed online at: ht tps://dataverse.harvard.edu/dataset.xhtml?persistentId=doi:1 0.7910/DVN/UBH9CS
12. As per the National Family Health Survey 2019–21, the average household size in rural Jharkhand is 4.5 members. The total fertility rate in rural Jharkhand is 2.48 (IIPS and ICF, Citation2021).
13. Per ASER (Citation2023a), which studied all rural districts in Jharkhand, 83.3% of children aged 6–14 are enrolled in government schools.
14. Students who attend Madrasas and government-aided schools were categorized as “others” and not added in the Table.
15. “Others” refers to children attending government-aided schools or Madrasas.
16. We conducted a chi-square test of independence and found that the materials provided and school type are not independent of one another. Learning materials provided are a function of the school type, and these proportions are thereby salient. Details are available in the Annexures.
17. We conducted a chi-square test of independence and found that the provision of online classes and school type are not independent. Online classes are a function of the school type, and these proportions are thereby salient. Details are available in the Annexures.
18. We conducted a chi-square test of independence and found that evaluation and school type are not independent of one another. Evaluation is a function of the school type, and these proportions are thereby salient. Details are available online in the Annexures.
19. The number of parents who reported that tutors conducted online tests was higher than those who stated that tutors conducted online classes. Either tutors relied on online tests despite in-person classes, or the respondents misunderstood “online test” to mean “test”.
20. This Table only includes those parents who reported that service providers evaluated their children. For instance, of the parents who sent their children to private schools during the lockdown and reported that evaluation was conducted, 50% mentioned this was done using an online test. This was a multi-select question.
21. Other parents thought that the quality of education was either “average” or “poor”.
22. Other parents were either “unhappy” or only “slightly happy” with their child’s education.
23. This trend is generally true, barring the period during the lockdown for government school parents. For them, a marginally higher proportion of those who do not avail of tutoring were satisfied than those who do.
24. Other parents thought that their child was struggling or were unaware of the child’s performance.
25. As in the previous section, an exception to this pattern are parents who sent their children to government schools during the lockdown.
26. Given the extremely low numbers, we could not conduct any meaningful analysis by further classifying this data based on tutoring.
27. Since we administered the learning tool to children post-lockdown, we consider parental assessment of the child’s performance during that period.
28. The trend toward the lower end is unclear, with the average score of children in the “slightly” struggling category being lower than those in the struggling “significantly” category. It is likely that parents were either unaware of the extent to which their child was struggling or reluctant to share.
29. We conducted a chi-square test of independence on the relationship between economic indicators and school type and found that the two variables are not independent.
30. There are several other factors such as a child’s motivation, that may have a bearing on the learning score. These are beyond the scope of this paper.
31. A p-value of < 0.05 suggests that the results are statistically significant.
32. We enquired how parents perceived their child’s academic performance. Some parents reported that they were unaware of the child’s performance. In instances where parents were aware of their child’s performance, we assigned a score of 1; 0 was assigned in case parents were unaware of the performance.
33. We assigned “1” to the children who attended private schools and “0” to those who attended government schools (post-lockdown).
34. We assigned “1” to the children who were enrolled in private tutoring and “0” to those who were not (post-lockdown).
35. We use ownership of television, smartphones, tablets, radio, and access to internet facilities as proxies for economic status. We assigned a score on a scale of 0–5 based on the number of assets owned. Note, however, that the ownership of these assets is not a perfect indicator of the economic status of a household.
36. We assigned a score to the respondent on a scale of 1–8 based on their education level, wherein 1 indicated that the parent had never been to school and 8 meant that they had a master’s or equivalent education degree.
37. After conducting quality checks and removing respondents with incomplete information on any of the relevant variables, we conducted this analysis for 3960 respondents.
38. A low R-square value suggests low variability of the dependent variable due to independent variables. Also, note that the Y-intercept, i.e., the learning score when all independent variables are taken to be 0 is 5.748. This could be because factors other than the ones we documented/tested have a bearing on the scores. These are beyond the scope of this paper.
References
- Andrew, A., Cattan, S., Costa-Dias, M., Farquharson, C., Kraftman, L., Krutikova, S., Phimister, A., & Sevilla, A. (2020). Learning during the lockdown: Real-time data on children’s experiences during home. The Institute for Fiscal Studies. https://ifs.org.uk/sites/default/files/output_url_files/Edited_Final-BN288%252520Learning%252520during%252520the%252520lockdown.pdf
- ASER. (2018). ASER assessment tasks. ASER Centre, Pratham. http://img.asercentre.org/docs/ASER%202018/Release%20Material/English%20files/aboutthesurveyaserassessmenttasks.pdf
- ASER. (2021). Annual status of education report (rural) 2021. ASER Centre, Pratham. https://img.asercentre.org/docs/aser2021finalreport_16.116.54pm1.pdf
- ASER. (2023a). Annual status of education report (rural) 2022. ASER Centre, Pratham. https://img.asercentre.org/docs/ASER%202022%20report%20pdfs/All%20India%20documents/aserreport2022.pdf
- ASER. (2023b). National findings, ASER Centre, Pratham. http://img.asercentre.org/docs/ASER%202022%20report%20pdfs/allindiaaser202217_01_2023final.pdf
- ASER. (n.d.). Sample design of rural ASER. ASER Centre, Pratham. https://img.asercentre.org/docs/Aser%20survey/Sampling/Sample_Design_of_Rural_ASER_1.pdf
- Azevedo, J. P., Montoya, S., Chakroun, B., Dewan, P., Bronwin, R., Cohen-Mitchell, J., & Dintilhac, C. C. S. (2022). The state of global learning poverty : 2022 update (English). World Bank Group. https://documents1.worldbank.org/curated/en/099040523114522270/pdf/P17920901523740ee09e0e00a3aaf59c447.pdf
- Azim Premji Foundation. (2018). School choice in low information environments: A study of perceptions and realities in four states. Azim Premji University. https://publications.azimpremjifoundation.org/1799/1/School%20choice%20in%20low-information%20environments_a%20study%20of%20perceptions%20and%20realities%20in%20four%20states.pdf
- Bubb, S., & Jones, M. (2020). Learning from the COVID-19 home-schooling experience: Listening to pupils, parents/carers and teachers. Improving Schools, 23(3), 209–222. https://doi.org/10.1177/1365480220958797
- Bukhari, P., & Randall, E. V. (2009). Exit and entry: Why parents in Utah left public schools and chose private schools. Journal of School Choice, 3(3), 242–270. https://doi.org/10.1080/15582150903304746
- Carpenter, D., & Dunn, J. (2021). We’re all teachers now: Remote learning during COVID-19. Journal of School Choice, 14(4), 567–594. https://doi.org/10.1080/15582159.2020.1822727
- Central Square Foundation. (2021a). Impact of covid 19 on private schools. https://www.centralsquarefoundation.org/CSF%20Report-Impact%20of%20COVID19%20on%20private%20schools_July%202021%20Final%20.pdf
- Central Square Foundation. (2021b). School education in India. https://www.centralsquarefoundation.org/reports/school-education-in-india-2021
- Charania, A., Bakshani, U., Paltiwale, S., Kaur, I., & Nasrin, N. (2021). Constructivist teaching and learning with technologies in the COVID-19 lockdown in Eastern India. British Journal of Educational Technology, 52(4), 1478–1493. https://doi.org/10.1111/bjet.13111
- Chevalier, A., Harmon, C., Sullivan, V. O., & Walker, I. (2013). The impact of parental income and education on the schooling of their children. IZA Journal of Labour Economics, 2(8). https://doi.org/10.1186/2193-8997-2-8
- Chudgar, A., & Creed, B. (2016). How are private school enrolment patterns changing across Indian districts with a growth in private school availability? Oxford Review of Education, 42(5), 543–560. https://doi.org/10.1080/03054985.2016.1217688
- Chudgar, A., & Quin, E. (2012). Relationship between private schooling and achievement: Results from rural and urban India. Economics of Education Review, 31(4), 376–390. https://doi.org/10.1016/j.econedurev.2011.12.003
- Cohen, J., Mccabe, E. M., Michelli, N. M., & Pickeral, T. (2009). School climate: Research, policy, practice, and teacher education. Teachers College Record, 111(1), 180–213. https://doi.org/10.1177/016146810911100108
- Daimary, P. (2020). E-Learning in schools during COVID-19 pandemic in rural areas. International Journal of Management, 11(10). https://papers.ssrn.com/sol3/papers.cfm?abstract_id=3738943
- Dang, H. A., & Rogers, F. H. (2008). The growing phenomenon of private tutoring: Does it deepen human capital, widen inequalities, or waste resources? The World Bank Research Observer, 23(2). http://www.jstor.org/stable/40282371
- Datta, S., & Kingdon, G. G. (forthcoming). The myth and reality of teacher shortages in India in 2021–22. [ mimeography]. University College London.
- Desai, S., Dubey, A., Vanneman, R., & Banerji, R. (2009). Private schooling in India: A new educational landscape. India policy forum. National Council of Applied Economic Research. https://www.ncaer.org/wp-content/uploads/2022/09/S-Desai_A-Dubey_R-Vanneman_R-Banerji.pdf
- Dhaygude, M. S., Lapsiya, N. D., & Chakraborty, D. (2022). There is no app for that: Manifestations of the digital divides during COVID-19 school closures in India. Proceedings of the ACM on Human-Computer Interactions, 6 (CSCW2). https://dl.acm.org/doi/abs/10.1145/3555140
- Eccles, J. S. (2007). Families, schools, and developing achievement-related motivations and engagement. In J. Grusec & P. Hastings (Eds.), Handbook of socialization: Theory and research (pp. 665–691). Guilford Press. https://psycnet.apa.org/record/2006-23344-026
- Edlund, J., & Lindh, A. (2021). Popular support for public education in global perspective. UNESCO Global Education Monitoring Report. https://www.diva-portal.org/smash/get/diva2:1619318/FULLTEXT01.pdf
- Garbe, A., Ogorlu, U., Logal, N., & Cook, P. (2020). Parents’ experiences with remote education during COVID-19 school closures. American Journal of Qualitative Economics, 4(3). https://www.ajqr.org/download/parents-experiences-with-remote-education-during-covid-19-school-closures-8471.pdf
- Giovannella, C., Passarelli, M., & Persico, D. (2020). The effects of the Covid-19 pandemic on Italian learning ecosystems: The school teachers’ perspective at the steady state. Interaction Design and Architecture(s) Journal. http://www.mifav.uniroma2.it/inevent/events/idea2010/doc/45_12.pdf
- Government of Jharkhand. (n.d.-a). Jharkhand at a glance. Government of Jharkhand, official website of the state. Retrieved December 28, 2023, from https://www.jharkhand.gov.in/home/AboutState
- Government of Jharkhand. (n.d.-b). State profile: Jharkhand. Government of Jharkhand, official website of the state. Retrieved December 28, 2023 from, https://www.jharkhand.gov.in/home/stateprofile#:~:text=There%20are%2024%20districts%20and%2045%20sub%2D%20divisions%20in%20Jharkhand
- Gupta, P. (2021). Use of EdTech in Indian education during COVID-19. Iconic Research and Engineering Journals. https://www.irejournals.com/formatedpaper/1702925.pdf
- Gurdatta, M., & Narang, P. (2022). National education policy compliance profile: Jharkhand. Centre for Civil Society. https://ccs.in/sites/default/files/2022-11/jharkhand-state-of-education-report_0_0_0.pdf
- Haller, T., & Novita, S. (2021). Parents’ perceptions of school support during COVID-19: What satisfies parents? Frontiers in Education, 6. https://doi.org/10.3389/feduc.2021.700441
- Harackiewicz, J. M., Rozek, C. S., Hulleman, C. S., & Hyde, J. S. (2012). Helping parents to motivate adolescents in mathematics and science: An experimental test of a utility-value intervention. Psychological Science, 23(8), 899–906. https://doi.org/10.1177/0956797611435530
- Horowitz, J. M., & Igielnik, R. (2020). Most parents of K-12 students learning online worry about them falling behind. Pew Research Center. https://www.pewresearch.org/social-trends/2020/10/29/most-parents-of-k-12-students-learning-online-worry-about-them-falling-behind/
- Huck, C., & Zhang, J. (2021). Effects of the COVID-19 pandemic on K-12 education: A systematic literature review. Educational Research and Development Journal, 24(1). https://eric.ed.gov/?id=EJ1308731
- International Institute for Population Sciences (IIPS) and ICF. (2021). National family health survey (NFHS-5). In India, 2019–21: Jharkhand. Ministry of Health and Family Welfare. IIPS. https://dhsprogram.com/pubs/pdf/FR374/FR374_Jharkhand.pdf
- Jabbari, J., Chun, Y., Johnson, O., Grinstein-Weiss, M., & McDermott, L. (2022). Perceptions of school quality and student learning during the pandemic: Exploring the role of students, families, schools, and neighborhoods. Socius: Sociological Research for a Dynamic World, 8. https://doi.org/10.1177/23780231221142955
- Jain, S., Lall, M., & Singh, A. (2021). Teachers’ voices on the impact of COVID-19 on school education: Are ed-tech companies really the panacea? Contemporary Education Dialogue, 18(1), 58–89. https://journals.sagepub.com/doi/pdf/10.1177/0973184920976433
- Kalra, S. (2020). Covid-19 impact: Unaided private schools fear closure as fees slashed, students switching to govt schools. Indian Express. https://indianexpress.com/article/education/thousands-of-private-schools-fear-closure-amid-pandemic-seek-support-from-government-6536169/
- Khandelwal, P. (2018). How budget private schools are changing education in rural India. Swarajya Magazine. https://swarajyamag.com/ideas/how-budget-private-schools-are-changing-education-in-rural-india
- Kingdon, G. G. (1996). The Quality and efficiency of private and public education: a case-study of urban India. Oxford Bulletin of Economics and Statistics, 58(1), 57–82. https://doi.org/10.1111/j.1468-0084.1996.mp58001004.x
- Kingdon, G. G. (2017). The private schooling phenomenon in India: A review. IZA Institute of Labour Economics. https://docs.iza.org/dp10612.pdf
- Lavy, V. (2015). Do differences in schools’ instruction time explain international achievement gaps? Evidence from developed and developing countries. The Economic Journal, 125(588), F397–F424. https://doi.org/10.1111/ecoj.12233
- Londberg, M., & Crutchfield, A. (2020). ‘I’m really struggling’: In 6 home classrooms, families keep learning alive in a pandemic. Cincinnati.com. https://www.cincinnati.com/in-depth/news/2020/04/07/coronavirus-covid-19-home-school-classrooms/2942522001/
- Mathur, A., & Narang, P. (2022). Mapping the education landscape of India. Centre for Civil Society. https://ccs.in/sites/default/files/2022-11/mapping_the_education_landscape_in_india.pdf
- Meinck, S., Fraillon, J., & Strietholt, R. (2022). The impact of the COVID-19 pandemic on education: International evidence from the Responses to Educational Disruption Survey (REDS). UNESCO. https://unesdoc.unesco.org/ark:/48223/pf0000380398
- Ministry of Education (MoE). (2020). Unified District Information System for Education plus (UDISE+) report 2019-20. Ministry of Education, Government of India. https://dsel.education.gov.in/sites/default/files/statistics/report_in_PDF/UDISE%2B2019_20_Report.pdf
- Ministry of Education (MoE). (2021a). National achievement Survey, 2021. Government of India. https://nas.gov.in/report-card/2021
- Ministry of Education (MoE). (2021b). Unified District Information System for Education Plus (UDISE+) report 2020–21. Ministry of Education, Government of India. https://dsel.education.gov.in/sites/default/files/statistics/report_in_PDF/UDISE%2B2020_21_Booklet.pdf
- Ministry of Human Resource Development (MHRD). (2018). Catalyzing transformational change in school education. UNICEF India. https://www.unicef.org/india/media/2596/file/Catalysing-transformational-change-in-school-education.pdf
- Ministry of Statistics & Programme Implementation. (2023). State-wise data on per capita income. Ministry of Statistics & Programme Implementation, Government of India. https://www.pib.gov.in/PressReleasePage.aspx?PRID=1942055
- Mousumi, M. A., & Kusakabe, T. (2020). Low-fee private schooling: Poor households’ struggle to support their children’s school attendance in unauthorized colonies in Delhi, India. Journal of School Choice, 14(2), 280–300. https://doi.org/10.1080/15582159.2019.1686594
- Muralidharan, K., & Sundararaman, V. (2015). The aggregate effect of school choice: Evidence from a two-stage experiment in India. The Quarterly Journal of Economics, 130(3), 1011–1066. https://doi.org/10.1093/qje/qjv013
- Narang, P., & Sudhakar, T. (2022). Ease of operations for budget private schools in India. In Global education monitoring report. UNESCO. https://unesdoc.unesco.org/ark:/48223/pf0000383514
- Roeser, R. W., & Eccles, J. S. (1998). Adolescents’ perceptions of middle school: Relation to longitudinal changes in academic and psychological adjustment. Journal of Research on Adolescence, 8, 123–158. https://doi.org/10.1207/sl5327795jra0801_6
- Scafidi, B., Tutterow, R., & Kavanagh, D. (2021). This time really is different: The effect of COVID-19 on independent K-12 school enrollments. Journal of School Choice, 15(3), 305–330. https://doi.org/10.1080/15582159.2021.1944722
- Schueler, B. E., Capotosto, L., Bahena, S., McIntyre, J., & Gehlbach, H. (2014). Measuring parent perceptions of school climate. Psychological Assessment, 26(1), 314–320. https://doi.org/10.1037/a0034830
- Selvaraj, A., Vishnu, R., KA, N., Benson, N., & Mathew, A. J. (2021). Effect of pandemic based online education on teaching and learning system. International Journal of Educational Development, 85, 102444. https://doi.org/10.1016/j.ijedudev.2021.102444
- Tabarrok, A. (2013). Private education in India: A novel test of cream skimming. Contemporary Economic Policy, 31(1), 1–12. https://doi.org/10.1111/j.1465-7287.2011.00286.x
- UNESCO. (2021a). Learning losses from COVID-19 could impoverish a whole generation. UNESCO. https://www.unesco.org/en/articles/learning-losses-covid-19-school-closures-could-impoverish-whole-generation
- UNESCO. (2021b). Non-state actors in education: Who chooses? Who loses? In Global education monitoring report. https://doi.org/10.54676/XJFS2343
- UNESCO. (2022). Education: From disruption to Recovery. Global Monitoring of School closures caused by the covid-19. UNESCO. https://webarchive.unesco.org/web/20220625033513/https://en.unesco.org/covid19/educationresponse#durationschoolclosures
- United Nations. (2020). Policy brief: Education during COVID-19 and beyond. https://doi.org/10.18356/21e7d903-en
- United Nations Children’s Fund (UNICEF). (2021). Rapid assessment of learning during school closures in the context of COVID. UNICEF India. https://www.unicef.org/india/media/6121/file/Report%20on%20rapid%20assessment%20of%20learning%20during%20school%20closures%20in%20context%20of%20COVID-19.pdf
- Vegas, E., Shah, S., & Fowler, B. (2021). Ed tech and educational opportunity during the COVID-19 school closures: A case study of Chennai. Tamil Nadu. Center for Universal Education at Brookings. https://www.brookings.edu/wp-content/uploads/2021/08/Ed-tech-and-educational-opportunity-during-COVID-19-school-closures-FINAL-1.pdf
- Verma, G., & Priyamvada. (2020). COVID-19 and teaching: Perception of school teachers on usage of online teaching tools. Mukt shabd journal, IX(VI). https://www.researchgate.net/profile/Gunjan-Verma-7/publication/342199970_COVID-19_and_Teaching_Perception_of_School_Teachers_on_Usage_of_Online_Teaching_Tools/links/5ee8b84292851ce9e7e7ec56/COVID-19-and-Teaching-Perception-of-School-Teachers-on-Usage-of-Online-Teaching-Tools.pdf
- Vyas, A. (2020). Status report- government and private schools during COVID-19. Oxfam India. https://www.oxfamindia.org/sites/default/files/2020-09/Status%20report%20Government%20and%20private%20schools%20during%20COVID%20-%2019.pdf
- Wani, A., & Kidwai, R. (2021). Locating the madrasa in 21st-century India. Observer Research Foundation. https://www.orfonline.org/research/locating-the-madrasa-in-21st-century-india
- World Bank. (2022). Ending learning poverty. World Bank Group. https://www.worldbank.org/en/topic/education/brief/ending-learning-poverty
- World Bank. (n.d.). Rural population (% of total population), India. World Bank Group. https://data.worldbank.org/indicator/SP.RUR.TOTL.ZS?locations=IN