
 ?Mathematical formulae have been encoded as MathML and are displayed in this HTML version using MathJax in order to improve their display. Uncheck the box to turn MathJax off. This feature requires Javascript. Click on a formula to zoom.
ABSTRACT
The number of historically-significant concrete structures which require conservation and repair is ever-increasing. The use of unsuitable proprietary materials has led to poor quality repairs of historically-significant structures in the United Kingdom, some of which have resulted in damage to the historic character of the structure and accelerated deterioration of the substrate. As a result, the approach to the repair of historic concrete structures has shifted from the use of mass-produced proprietary repair materials to purpose-made ‘like-for-like’ replacements which, theoretically, have similar mechanical and aesthetic properties. In order to create like-for-like repair materials, the original mix proportions and water/cement (w/c) ratio of the substrate have to be established. However, there are concerns regarding the accuracy of existing techniques and standards used for the analyses of hardened concrete. Furthermore, due to a lack of available material, analyses are often carried out on samples that are much smaller than the minimum requirement for a representative sample, or from areas which are not representative. This paper discusses these issues and hopes to provide information to conservators and analysts on the limitations of techniques, the variability of the material and the importance of representative samples.
1. Introduction
When selecting a repair material for concrete structures it is critical to match the characteristics of the original material as closely as possible. Failure to match the mechanical and chemical properties can not only lead to an unsuccessful repair but can also cause significant damage and accelerated deterioration to the original material. It is usually also important to match the aesthetic characteristics, as this will allow the two materials to blend well visually, retaining the historic character of the structure. The use of unsuitable proprietary materials which do not meet these criteria has led to poor quality repairs of historically-significant structures in the United Kingdom (English Heritage Citation2012) and, as a result, the approach to the repair of historic concrete structures has shifted from the use of mass-produced proprietary repair materials to purpose-made ‘like-for-like’ replacements which, theoretically, have similar mechanical and aesthetic properties.
Given the significant role the mix proportions and water/cement ratio (w/c) play in the properties of concrete, it is, understandably, desirable to replicate these in a repair material. Unfortunately, current standards for determining mix proportions and w/c ratio, such as BS 1881-124 (BSI Citation2015), BS 1881-211 (BSI Citation2016) and NT Build 361 (Nordtest Method Citation1999), are not suitable for use with historic concrete. However, despite this, they are applied in the assessment of historic structures as there are simply no better alternatives. This presents a problem, as the potential inaccuracy of the standard test methods is not included in test reports, and this may have a significant impact on the repair strategy applied to historic concrete structures.
1.1. Scope of the problem
BS 1881-124 determines w/c ratio indirectly, through separate determinations of cement content and water content. However, following a series of round-robin laboratory tests on contemporary concretes, the Concrete Society (Citation2014) determined that, in favourable circumstance (undamaged, uncarbonated concrete with cement content 200–500 kg/m3 and w/c 0.4–0.8, which contain aggregates that permit reliable estimates of the cement content) and with reliable analysts, the w/c ratio could only be calculated to within ± 0.1, and the reproducibility error was around ± 0.28 for a typical design range of 0.7–0.3. For determining cement content, the reproducibility of the BS 1881-124 method was found to be 55–85 kg/m3 for concretes with cement contents ranging from 240–425 kg/m3. With regards to BS 188-124 more generally, it was concluded that “there is significant doubt regarding the accuracy of the BS 188-124.” In order to even achieve this low level of accuracy, a petrographical examination of the concrete is first required to determine whether acid-soluble aggregate is present, as the standard utilises acid digestion of the cement matrix to determine the aggregate content.
The standard itself claims that ‘acceptable’ results are only possible when the concrete is less than five years old and without physical or chemical damage, as these result in changes to the microstructure and porosity values which are used for calculating w/c. Furthermore, the calculations used in these standards require certain assumptions to be made about the initial chemical composition of the cement and these are based on the soluble silica and calcium oxide contents of current Portland cements — not of the actual Portland cement being analysed. This is significant since the calcium content of the material increased considerably over the first half of the 20th century (Halstead Citation1961).
Nordic standard for conformity assessment, NT Build 361, describes a method of estimating w/c ratio in hardened concrete, using microscopic investigation of thin sections impregnated with a fluorescent agent. These thin sections are then compared to a series of laboratory-prepared reference samples and the w/c ratio determined by comparing the fluorescent intensity of the samples. However, the accuracy of this method has also been called into question by some authors (Neville Citation2003; St John Citation1994) claiming a realistic accuracy of ± 0.1 for w/c ratio within the range of 0.4 to 0.6. Moreover, the necessity for comparable reference samples and the reduction in pore volume due to carbonation make this method also unsuitable for historic concrete.
Additional methods of estimating the w/c ratio of hardened concrete are detailed in BS 188-211 (BSI Citation2016) and the Applied Petrography Group code of practice for the petrographic examination of concrete, APG SR2 (Eden Citation2010). Both of these documents state that the criteria for the assessment of w/c should include the amount, size and distribution of calcium hydroxide (CH) in the cement paste, as concretes with a low w/c tend to develop only limited proportions of coarsely crystalline calcium hydroxide. However, the ratio of alite (C3S) and belite (C2S) in Portland cements has varied significantly since the 19th century when it was first manufactured (Corish and Jackson Citation1982), and this affects the quantities of CH produced during hydration. For example, if the assumption is made that the final product of hydration is C3S2H3, then the approximate hydration reactions of alite and belite, and the corresponding masses involved, can be written as (Neville Citation2011):
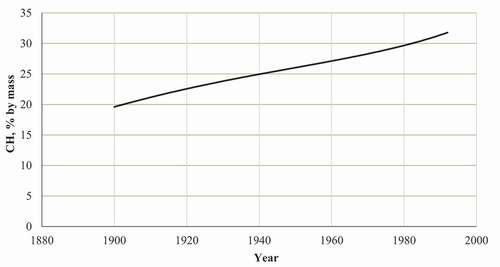
Therefore, for C3S and C2S of the same mass, although a similar mass of water is required for their hydration, C3S produces more than double the amount of CH than the hydration of C2S, and so any assumptions made about the w/c due to the CH content are likely to be incorrect. Changes in mean C2S and C3S contents over time (Corish and Jackson Citation1982) are shown in . Estimations of CH content for hydrated cement pastes by production year based on mean C2S and C3S levels, taking into account the mass of water incorporated in cement paste for full hydration of the calcium silicate and calcium aluminate phases, are shown in . Work has been undertaken in developing new methods of determining w/c ratio, such as that by Wong and Buenfeld (Citation2009) which utilises scanning electron microscopy and image analysis to estimate initial cement content, water content and free w/c ratio of hardened cement-based materials. However, there is, at present, no adequate or standardised method for accurately determining the w/c ratio of historic concrete.
Figure 1. Typical alite and belite contents of Portland cements.
Figure 2. Estimation of CH content for hydrated cement pastes by production year based on mean C2S and C3S levels.
While microscopical methods for estimating the composition of hardened concrete have been proposed by such authors as Polivka, Kelly, and Best (Citation1956) and Axon (Citation1962), these can only provide volumetric proportions. While they can be used to assess conformance of a hardened concrete of known mix proportions, they cannot be independently applied to determine an unknown original mix design. In order establish the original mix design, the specific gravities of the components would either need to be estimated or determined through physical testing undertaken in parallel — both of which provide complications, as will be discussed.
There are also two additional and significant challenges facing those tasked with performing analysis on historic concrete structures. Firstly, when dealing with historic structures, it often difficult to obtain the volume of sample required to carry out analysis, and, secondly, the samples that can be obtained may not necessarily be representative of the area requiring repair, or even of the concrete in general. This is particularly problematic when dealing with historic structures, as owners are, understandably, reluctant to allow further damage to occur to a structure in order for samples to be taken, and wish to retain as much of the original fabric as possible. In addition, in the United Kingdom, it is a criminal offence to remove material from a listed structure or scheduled monument without written consent from the Secretary of State (Department for Culture, Media and Sport Citation1979).
To put this issue in perspective, BS 188-124 (BSI Citation2015) requires a minimum of two representative samples to be taken for analysis of hardened concrete from a source of less than 6 m3 and a minimum of ten independent samples from larger volumes of concrete. Furthermore, the mass should not be less than 1 kg in any case, not less than 2 kg to determine original water content, and not less than 4 kg if aggregate grading is to be determined.
To carry out petrographic analysis of hardened concrete, BS 188-211 (BSI Citation2016) requires a minimum area of 100×100 mm to determine air void content and for volumetric estimation of mix proportions of concrete containing coarse aggregates, and a sample size of 70×50 mm for concrete and mortar containing fine aggregate and cement paste only. However, if this is to be removed by coring, it represents a significantly larger volume.
In their code of practice for the petrographic examination of concrete, the Applied Petrography Group (Eden Citation2010) states that:
Core samples need to represent not only the surface concrete but also the concrete at depth and should be ideally no less than 70 mm in diameter and 200 mm long. Where smaller diameters are unavoidable two or more cores may be needed to represent each sampling location.
ASTM C 856-18a requires a minimum sample size of at least one core, preferably 6 in. (152 mm) in diameter and 1 ft. (305 mm) long to conduct a petrographic analysis, though smaller diameter cores can be used if the aggregate is small enough — with cores three times the maximum aggregate sample size desirable (ASTM International Citation2018). To conduct a microscopical determination of air-void content, ASTM C 45-98 requires a minimum surface area which is dependent on the maximum aggregate size, as shown in (ASTM International Citation1998).
Figure 3. Minimum size requirement of finished surface for microscopical analyses.
It should be noted that, historically, aggregates were usually significantly larger than those used in modern construction, with some engineers specifying aggregate up to the size of ‘an egg’ (Pasley Citation1826 [1862]), with aggregates of 40–80 mm not uncommon. Given the associated required sample sizes, it is understandably difficult to obtain permission to remove the minimum mass of material that would be required for a thorough analysis of a historic concrete structure.
This lack of available material can often result in analysts being asked to carry out investigations on samples which are much smaller than a standard’s minimum requirement for a representative sample — whether that is a mass sample for physical/chemical analysis or a thin section for microscopical analysis. If these samples are also supplied with little information as to where exactly on the structure they were taken from, it prevents the analyst from being able to provide a context for their results — a necessity when dealing with material as heterogeneous as concrete.
2. Methodology
In order to assess the limitations of the current standards when used in the analysis of historic concrete samples, nine concrete mixes were produced using Portland cement (CEM I 42.5 N) as the sole cement constituent, and with mix proportions () based on typical mix designs from the early 20th century (Abrams Citation1922; Bussell Citation2001; Concrete Society Citation2009; Somerville Citation2001; Yeomans Citation1997). While concrete mixes in the early 20th century were proportioned by volume, the ones used in this study were proportioned by mass in order to ensure accuracy and eliminate errors which may arise due to the challenge of maintaining a consistent bulk density of the materials. The proportions were approximately 1:1:2, 1:2:4 and 1:1.5:3 by mass of cement, fine and coarse aggregate respectively, but with the fine aggregate content slightly adjusted for each mix in order to maintain a constant cement and coarse aggregate content per 1 m3 while varying the w/c ratio.
Table 1. Mix proportions used in control study and recorded 28-day strengths
The concrete was mixed in accordance with BS 188-125 (BSI Citation2013a), and cast in 100x100x500 mm moulds. However, due to the water demand of the 1:2:4 mix combined with the low w/c of 0.4, the workability of the T1 mix was so low that it was not possible to achieve adequate compaction, and therefore the T1 mix was not included for testing. After demoulding, the concrete samples were cured in potable water for 28 days.
A slice of approximately 100x100x15 mm was then sawn from the centre of each concrete sample. This size was selected to replicate a similar mass of sample (300–400 g) to those that have previously been sent to the author from historic structures for analyses. After sawing, the samples were allowed to air-dry for six months and were then placed in a carbonation tank at 4% CO2 for fourteen weeks in order to simulate the carbonation that would have occurred naturally in historic concrete. These slices were then split in half through the vertical plane and one-half used for aggregate grading and density tests, while the other half was used for all chemical testing.
The analyses were carried out following BS 188-124 (BSI Citation2015), with the exception of density tests which were carried out in accordance with BS EN 1239-7 (BSI Citation2009a), aggregate water absorption tests which were carried out in accordance with BS EN 109-6 (BSI Citation2013b), and chemically-bound water prior to carbonation, which was estimated using X-ray fluorescence (XRF) combined with an optimisation process which determined the percentage of chemically bound water by mass of anhydrous cement required to achieve full hydration. Additional porosity measurements were carried out using mercury intrusion porosimetry (MIP) on 8 mm diameter micro-cores that had been vacuum dried at 40°C for 24 hours.
2.1. Mix proportion calculations
2.1.1. Aggregate/matrix content
As the control samples were known to contain no acid-digestible aggregate, aggregate content by mass was assumed to be the insoluble residue content determined in accordance with Clause 7 of BS 188-124 (BS1 Citation2015). The cement matrix content as a % of the mass of total concrete was then calculated to the nearest 0.1% as follows:
The aggregate and matrix content as a mass in kg per m3 concrete mix could then be determined from the previously calculated oven-dry (OD) density, ρc.OD:
where:
ρc.OD is the density of the OD concrete in kg/m3;
MA.OD is the mass of OD aggregate (total) per m3 mix in kg;
MM.OD is the mass of OD matrix per m3 mix in kg.
It should be noted that the matrix content is different from the anhydrous cement content, as the matrix content includes chemically bound water and CO2 as the cement has hydrated and then carbonated.
2.1.2. Anhydrous cement content
LOI was carried out on powdered sub-samples of each specimen. During the LOI test, all chemically bound water and carbon dioxide that are part of the cement matrix are driven off, and so the remaining mass is attributed to the anhydrous cement and aggregate. As the overall matrix content has been previously calculated, it was then possible to calculate the anhydrous cement content of the concrete:
The anhydrous cement content as a mass in kg per 1 m3 concrete mix could then be determined from the previously calculated OD density, ρc.OD:
where:
Mcem is the mass of anhydrous cement per m3 mix in kg.
2.1.3. Combined water content
The amount of chemically bound water in the cement matrix, also known as the ‘combined water’, is typically calculated using the procedure detailed in BS 188-124. However, this test is particularly unsuitable for use with historic concrete as it calculates bound water content from the mass of gas that is driven off at 1000°C and subsequently recaptured in an absorption tube, and, in the case of carbonated concrete, the conversion of calcium hydroxide to calcium carbonate results in the loss of measurable combined water. As such, the combined water of hydration was, as specified in BS 188-124, assumed to be:
where:
Mcw is the mass of combined water per m3 mix in kg;
It should be noted that the value of 0.23 is only an estimation, and BS 188-124 states that the combined water of BS EN 197-1 (BSI Citation2011) CEM I and CEM III cements is between 0.20 and 0.25, for full hydration.
2.1.4. Aggregate voids ratio
The aggregate voids ratio was calculated from the results obtained from the aggregate water absorption and particle density tests, carried out in accordance with BS EN 109-6 (BSI Citation2013b), using the following expression:
where:
ea is the voids ratio of the aggregate;
Va.w is the volume of aggregate voids filled by water in m3;
Va.s is the volume of aggregate solids in m3;
Ma.SSD is the mass of the saturated-surface-dried (SSD) aggregate in kg;
Ma.OD is the mass of the OD aggregate in kg;
Ma.IM is the mass of the saturated sample immersed in water in kg;
ρw is the density of water in kg/m3.
Voids ratios were calculated for both fine and coarse aggregate separately. Obtaining reliable results was challenging as the sample size obtained from the hardened concrete was small. In the case of the coarse aggregate, an average value was determined from all the samples tested and the same value used for all mix design calculations. In the case of the fine aggregate, the quantity of aggregate obtained was too small to perform the water absorption and particle density tests, so the test was carried out on a reference sample of fine aggregate and the same values used for the calculations of every mix design.
2.1.5. Aggregate and matrix volume
The SSD aggregate mass in kg per m3 of concrete mix could then also be determined using the previously calculated dry aggregate mass per m3 of concrete mix and the voids ratio of the aggregate:
This, as well as the saturated-surface-dry aggregate density, previously determined from the procedure in BS EN 109-6, was then used to calculate the volume of saturated-surface-dry aggregate per m3 of concrete mix
where:
Va.SSD is the volume of SSD aggregate per m3 mix in m3;
MA.SSD is the mass of SSD aggregate per m3 mix in kg;
ρa.SSD is the density of SSD aggregate per kg/m3.
Assuming that the remainder of the volume is attributed to the saturated-surface-dry matrix, the volume of saturated-surface-dry matrix per m3 of concrete mix was then calculated from the expression:
where:
Vm.SSD is the volume of SSD matrix per m3 mix in m3.
2.1.6. Fine and coarse aggregate content
It was possible to determine the fine and aggregate content by measuring the grading of the aggregate following the dry sieving procedure described in BS EN 93-1 (BSI Citation2012b). The fine aggregate was considered to be that which passed through the 4 mm aperture sieve, and the coarse aggregate that which was retained, and the content of each per 1 m3 mix was determined using the following expressions:
where:
MAf is the mass of OD fine aggregate per m3 mix in kg;
MAc is the mass of OD coarse aggregate per m3 mix in kg;
MA.OD is the mass of OD aggregate per m3 mix in kg;
Mf is the mass of fine aggregate passing through the 4 mm sieve, in kg;
Mc is the mass of coarse aggregate retained on the 4 mm sieve, in kg;
Mt is the total mass of aggregate used in the dry sieving procedure, in kg.
It should be noted that each of these masses represents the mass of aggregate only, and does not consider the additional mass of water required to bring the aggregate to a saturated-surface-dry state.
2.1.7. Concrete voids ratio
The voids ratio of each hardened concrete samples was calculated from the saturated-surface-dried and oven-dried densities calculated in accordance with BS EN 1239-7 (BSI Citation2009a), using the following expression:
where:
ec is the voids ratio of the concrete;
ρc.SSD is the density of the saturated-surface-dried concrete in kg/m3;
2.1.8. Proportional share of concrete voids
The voids ratio of the cement matrix could be calculated from the proportional share of concrete voids attributed to the matrix. However, in order to do this, it was first necessary to calculate the proportion of concrete voids attributed to the aggregate.
Aggregate proportion of voids. The aggregate proportion of voids was calculated from the voids ratio of the aggregate and the calculated volume of SSD aggregate in per m3 mix, using Equationequation (12)(12)
(12) . It was calculated for the fine and coarse aggregates separately. As the volume of the SSD aggregate is calculated per m3 mix, this term can be expressed as a ratio (unitless) as well as a volume (m3).
where:
ec.a is the proportion of the concrete voids ratio attributed to the aggregate;
VA.SSD is the volume ratio of saturated-surface-dry aggregate per m3 mix.
Cement matrix proportion of voids. Assuming that the remainder of the concrete voids are found in the cement matrix, the proportion of total concrete voids attributed to it could be calculated from the expression:
where:
ec.m is the proportion of the concrete voids ratio attributed to the cement matrix;
ec.af is the proportion of the concrete voids ratio attributed to the fine aggregate;
ec.ac is the proportion of the concrete voids ratio attributed to the coarse aggregate.
2.1.9. Cement matrix voids ratio
As with the SSD aggregate, the volume of the SSD cement matrix was calculated per m3 mix and can, therefore, be expressed as a ratio (unitless) as well as a volume (m3). The voids ratio of the cement matrix can be calculated from the expression:
where:
em is the voids ratio of the cement matrix;
VM.ssd is the volume ratio of SSD matrix per m3 mix.
It should be noted that, as with other tests methods that have been discussed, carbonation of the cement matrix leads to a reduction in pore volume which will provide a source of error in determining the volume of voids.
2.1.10. Free water content
The volume of free water was considered to be that which filled the voids of the hardened cement matrix, and was therefore calculated using the expression:
where:
Vfw is the volume of free water per m3 mix in m3;
This can then be converted to a mass:
where:
Mfw is the mass of free water per m3 mix in kg;
2.1.11. Total water content
If considered to be the sum of combined water and free water, the total water content of each sample could be calculated from the expression:
where:
Mtw is the total mass of water per m3 mix in kg;
2.1.12. Mix proportion summary
Once the mix proportions had been calculated, the results could be compared against the designed mix proportions (), and the standard and mean deviations determined (). The relevant terms used to represent the specific constituents in the previous mix proportion calculations can be found in .
Table 2. Summary of deviations of experimental results from actual control mix design
Table 3. Comparison of designed and calculated mix proportions
Table 4. Summary of terms used in calculations and to specify mix proportions
3. Results and discussion
3.1. Mix proportions
The deviations of the mix proportions determined from the analysis of the concrete samples from the designed values were significant (). Furthermore, there does not appear to be any correlation between the mix proportions and the observed deviations — that is to say that no general correlation could be found between the degree of variation in results and specific mix characteristics such as w/c ratio or cement content, suggesting that the errors are due to experimental or sampling errors.
3.1.1. Sensitivity analysis
In order to determine how each variable affected the mix proportion calculations, the mix proportions for T7 — the most accurately estimated — were re-calculated 10 times, with one of the ten input variables obtained from experimental testing increased by 10% (factor of 1.1) each time, as shown in . It is clear from these results that the calculated mix proportions were extremely sensitive to small changes in measured results. In particular, small variations in the concrete density measurements have a significant impact on the accuracy of the results due to the scaling effect when normalising the proportions for a 1 m3 mix. For example, if a 10 kg/m3 increase in OD density was applied to each mix design, it resulted in a decrease of 0.02–0.03 in the calculated w/c ratio of each sample (). This is of particular concern as deviations in calculated density by this margin are common, as the calculations involved are themselves particularly sensitive to scaling errors inherent to the use of relatively small test samples.
Table 5. Calculated mix proportions for T7 if there is a 10% increase to a particular variable
Figure 4. Effect of OD density on the estimated w/c.
One particular reason for these errors is the need to weigh the sample in a SSD state, which means that, theoretically, all the pores and voids of the sample are completely saturated with water, but no additional moisture is present on the outer surface. In reality, this is highly unlikely to be exact, as the determination that the sample has reached the SSD state is based purely on the perception and judgement of the individual carrying out the test. This issue is particularly relevant when dealing with small specimens which have a relatively high ratio of surface area to total volume, and introduces the possibility that small variations in the saturation state of the surface layer will result in calculated density errors which compound as they are used throughout multiple calculations.
The prevalence of this issue can be put into perspective by examining the differences in the results of the density tests. The OD and SSD densities were determined twice for each of the hardened concrete samples and the results compared. The mean deviation between tests was 10.9 and 20.4 kg/m3 for OD density and SSD density, respectively, with standard deviations of 4.8 and 4.0 kg/m3. As adjusting the mix proportion calculations with a 10 kg/m3 increase in OD density resulted in a decrease of up to 0.02–0.03 in the calculated w/c ratio of each sample, this presents a significant issue given that the mean deviation between any two OD density test results for one sample was 10.9 kg/m3. Examples of how changes in measured density can affect the calculation of w/c are shown in .
Figure 5. Effect of SSD density on the estimated w/c.
Another significant variation that occurred was in the fine, coarse and total aggregate contents. In all cases except sample T9, the total aggregate content was calculated as being lower than the designed mix. While the total aggregate content errors can be attributed to the previously discussed issues inherent to the density calculations, the ratio of both fine and coarse aggregate to total aggregate should not be affected by this.
The fine and coarse aggregate contents as a percentage of total aggregate mass were calculated from the mass of aggregate passing and retained on a 4 mm aperture sieve, respectively. As the sieving procedure required the aggregates to be in an OD state, and the same sample could be retested an unlimited number of times, there is very little error introduced from the actual experimental procedure. As such, it is likely that the errors can be attributed to variations in the physical composition of the concrete sample.
As shown in , in all cases except sample T3 the percentage of aggregate passing was significantly greater than expected, and there are several potential reasons this could have occurred. Firstly, once mixing was complete, the fresh concrete was hand trowelled into moulds in layers and it is possible that some segregation occurred in the horizontal plane at this stage — causing the fine and coarse aggregate to be inconsistently positioned throughout the mould. As the sawn specimens were relatively thin in one orientation (dimensions approximately 100x100x15mm), this compositional variation in the horizontal plane would not be accounted for by an individual specimen.
Table 6. Comparison of errors from aggregate grading and mix proportion calculations
Secondly, as the sawn specimen was relatively thin, it is possible that a portion of the coarse aggregate that was positioned in the plane of each cut was sawn such that it now passed through the 4 mm aperture sieve and was counted as fine aggregate. In practice, this issue should be minimised by taking cores with a diameter of at least three and a half times that of the maximum aggregate size (BSI Citation2012a). However, as previously discussed, it is not always possible to take concrete samples of such size — particularly from historic structures.
Thirdly, the concrete samples were heated in a furnace to 400 ± 5°C, as per BS 1881-124 (BSI Citation2015), in order to aid in the break-down of the cement matrix, and this may have resulted in some fragmentation of the aggregate and an increase of finer particles.
The impact of the density equation errors is again highlighted when comparing the errors obtained during aggregate sieving and aggregate mix proportion calculations, as shown in . One such example is sample T3 which, despite having a negligible error (0.4%) from the aggregate grading, had errors of −8.3% (−52 kg/m3) and −6.9% (−82 kg/m3) for fine and coarse aggregate respectively. Another example of particular note is sample T9 where an error of 22.4% in the aggregate passing the 4 mm aperture sieve resulted in a fine aggregate error of 87.3%. These errors occur as a result of the error in total aggregate content which is distributed into fine and coarse aggregate contents using the results from the sieve grading, which in turn increases the error in terms of mass per 1 m3 mix proportionally, and when this mass error is converted into a percentage error of original mix proportions it has the potential to become particularly high.
Another source of error comes from the assumption that the insoluble residue obtained from acid-digestion of the concrete is an accurate representation of the aggregate content. There are two conditions that need to be met for to this assumption to be correct; firstly, that none of the aggregates are acid-soluble, and, secondly, that all of the cement matrix is acid-soluble.
The former is an issue which relatively well understood, and can be taken into consideration by performing microscopical analyses to determine the presence of acid-soluble aggregates, and quantified to allow an approximate correction to the insoluble residue results. However, the previously discussed limitations of such techniques need to be considered.
The latter issue is more complex. The insoluble residue obtained from historic concrete samples can contain significant amounts of amorphous ‘glassy’ material which is not acid-soluble, and most likely originates from the cement and not the aggregate. The presence of this glass in Portland cement clinker is inevitable, and research carried out by Lerch (Citation1938) approximated the glass contents of Portland cement clinker from 21 plants in the USA and found that they varied from 2 to 21 per cent. Furthermore, it was concluded that, for any given clinker composition, the glass content was dependent on the cooling conditions that the clinker was subjected to — with relatively high glass contents caused by cooling the clinker rapidly, and relatively low glass contents by cooling slowly. This presents a problem when dealing with early Portland cements, since the cement manufacturing process was, at that time, very much a process of trial and error and this makes it difficult to predict reasonable results for the insoluble amorphous content of cements from historic concrete samples.
While the amount of amorphous material can be estimated with some accuracy through quantitative X-ray diffraction (XRD) analysis, it is also possible that some aggregates also contain amorphous material and it is not possible to distinguish the amount that should be attributed to each. As such, this presents a source of error in the calculation of aggregate and cement matrix contents and subsequently results in errors in the determination of both aggregate and cement matrix chemical composition.
Taking these various factors into account, it can be concluded that an accumulation of experimental errors recycled through multiple calculations — particularly those related to density tests — contributed to the significant variation of the estimated mix proportions from the designed mix proportions. Furthermore, the tests used are increasingly inaccurate as the sample size is decreased and this is problematic when dealing with historic concrete structures where limited amounts of material are available for testing.
3.2. Porosity
The porosity of concrete is an important factor which affects not only the physical properties of the hardened material, such as surface texture and subsequently the manner and extent to which it will weather, but influences the mechanical properties, such as strength, shrinkage and creep. Porosity is determined predominantly by the w/c ratio and curing conditions of the concrete (Basheer and Barbhuiya Citation2010), and, as it has been shown to be difficult to accurately analyse the w/c ratio of historic concrete, it may be necessary to determine the porosity of samples taken from the in-situ concrete source if a repair material is to be designed for it. However, it is unclear how suitable current techniques which directly measure porosity are for use with historic concrete and so an investigation was carried out on the control samples T2 — T9, the results of which are shown in .
Figure 6. MIP results comparing total porosity and its distribution in pore sizes.
Figure 7. Comparison of total porosity results calculated from MIP and density measurements.
Porosity was determined by two different methods: firstly, using MIP and, secondly, from the comparison of the results from OD and SSD density tests. Strictly speaking, the results from density measurements are not a measure of porosity as they inevitably include larger air voids that were not present in the samples used in the MIP analyses. However, as the tests were carried out on laboratory-made samples, which were compacted following the standard procedure, the proportion of air voids should be minimal.
There are several factors which influence the porosity of hardened concrete, which need to be considered in the comparison of results. While the w/c ratio is the key parameter to control the formation of the cement paste microstructure, it is also important to consider that when measuring the porosity of hardened concrete samples, the aggregate type and quantity can also have a significant impact on the porosity results, as can the curing conditions that the concrete was subjected to.
In this study, the same aggregate type was used in each sample and the mix proportions were known, which allowed a more accurate interpretation of the results. Furthermore, as the cement type used and curing conditions were the same for each sample, this eliminated two potential sources of variation between the different designed mixes. However, it is still necessary to compare the results of samples which share one equal parameter; in this case, comparison is made between the results of samples with the same mix proportions but different w/c ratio (T2/T3, T4/T5/T6, T7/T8/T9), and also between the results of samples with the same w/c ratio but different proportions of cement and sand (T4/T7, T2/T5/T8, T3/T6/T9).
In both the density and MIP porosity results, it was clear that for similar cement: sand: aggregate proportions, an increase in w/c ratio resulted in an increase in porosity. There was, however, a discrepancy in the porosity results of the MIP and density tests when comparing samples with the same w/c ratio but different mix proportions. The expectation was that, at constant w/c ratio, an increase in cement content would result in a higher porosity as the cement matrix is more porous than the aggregate, i.e. in this study, at constant w/c, the 1:1:2 mix would have the greatest porosity and the 1:2:4 mix would have the lowest porosity. While the results of the density tests support this, the MIP results do not, as the 1:1.5:3 mixes T5 and T6 have a lower MIP porosity than the corresponding 1:2:4 mixes — T2 and T3 respectively.
This discrepancy could possibly be attributed to two factors: firstly, that a significant amount of the coarsest pores in the 1:1.5:3 mix may fall outside of the range of measurement of MIP — an issue which is associated with this technique (Taylor Citation1997). Secondly, the discrepancy may have arisen as a result of experimental and sampling errors associated with this technique — an issue which will be discussed subsequently.
In any case, due to the limited number of tests specimens available from each sample on which these tests were carried out, it is difficult to draw any firm conclusions on this discrepancy. This presents an issue which hinders the usefulness of MIP when trying to ascertain the correlation between particular variables, such as cement content and w/c, on the porosity of historic concrete samples. Given that this could not be achieved in a controlled study where the original mix proportions and w/c ratios were known and the variation between samples limited, it is unlikely that, in a wide-scale study where all the samples have varying mix proportions, unknown curing conditions, different cement and aggregate types, and where the number of samples available for destructive testing is limited, the use of MIP will provide any meaningful data.
3.2.1. Experimental error
While porosity tests can provide useful information on the pore structure of laboratory-made cement pastes and mortars, there are two important factors which need to be taken into consideration when analysing the data from tests carried out on hardened concrete — particularly that which is carbonated.
Firstly, when the test is carried out on concrete, each sample will inevitably contain varying quantities of cement and aggregate. In order to give a context to results obtained, it is important to have first determined not only the cement matrix and total aggregate contents but also the proportion of fine and coarse aggregates as these will each have different porosities which will affect the results. In the case of the results discussed in this chapter, this issue is of less concern than with concrete taken from an in-situ source as the original mix proportions of these samples were known.
However, there will inevitably be a degree of variation from the designed mix proportions due to the heterogeneity of concrete, and this is particularly true when carrying out MIP, as the test is carried out on very small specimens (8 mm diameter cores, approximately 15 mm in length) — making it very difficult to ensure that any individual test specimen is, in fact, an accurate representation of the bulk mass with known aggregate and cement matrix contents. Again this issue is of even greater concern when dealing with samples of unknown mix proportions due to the inaccuracies in methods to determine these as discussed earlier in this study.
Secondly, MIP estimates pore-entry sizes, not the distribution of pore sizes, and so if large pores can only be accessed through narrow entrances they will be incorrectly registered as smaller pores (Taylor Citation1997). This is problematic when dealing with carbonated concrete, as the conversion of calcium hydroxide to calcium carbonate results in an increase in the crystal volume by approximately 11.7% (Ishida and Maekawa Citation2001) which in turn causes a decrease in the size of pores in the concrete — causing a finer porosity to be registered during MIP tests. There are additional errors inherent to this technique, such as its mathematical assumption that the pores are perfectly cylindrical, which is unlikely to be the case, and the sample preparation and testing procedures which can both alter the delicate pore structure (Taylor Citation1997).
This creates difficulty when trying to determine the relationship between various historic cement compositions and the pore structure of cement paste, as even samples with the same cement type and w/c that are carbonated to a different degree may be analysed by MIP as being quite different, due to the effects of carbonation on the pore entry sizes. However, MIP tests may still provide valuable information when analysing an individual concrete sample from a proposed repair area.
While the actual quantification of the range of pore sizes, and indeed the quantification of total porosity, may not be a particularly accurate reflection of the bulk material and therefore unsuitable for assessing how a certain cement type will influence the formation of pores in the hardened paste — and subsequent mechanical properties such as shrinkage — it may be that even this analysis of pore entry sizes can provide insight into the physical characteristics of the surface layer of concrete. For example, the results provided by the MIP tests on the pore entry sizes of carbonated concrete may be used to better understand how that material has degraded or will degrade in response to its environment and also for comparison with potential repair materials to ensure they will have a similar surface texture and will weather and stain in a similar fashion.
3.3. Variations in the composition of in-situ concrete
While there are experimental errors that are inherent to concrete testing, it is also important to consider that the heterogeneity of concrete is generally such that, when working with small samples, the bulk material is not being taken into consideration and any test, no matter how accurate, can only give a localised quantitative assessment of composition.
With this in mind, there are several issues related to the in-situ casting of fresh concrete which need to be considered when relating the properties of relatively small analytical samples to the much larger substrate — particularly when these samples are derived from one particular area and are unlikely to be representative of bulk material.
Segregation in fresh concrete is a significant factor which contributes to an increase in the variation in the composition of the hardened concrete. It can be attributed to several factors including over-compaction, poor placement and inadequate mix design — the latter is particularly relevant to historic concrete as the first standards for concrete in the UK were not introduced until the first half of the 20th century.
A lack of suitable grading is conducive to segregation, which in turn can result in the dense coarse aggregate particles settling to the bottom of the mix and fluid cement paste rising to the top (Neville and Brooks Citation2010). The effects of segregation on concrete heterogeneity should not be underestimated, particularly when selecting samples for analysis, as it has been found to result in a difference in cement content of as much as 100 kg/m3 between the top and bottom of concrete walls and columns (Skinner Citation1980).
Bleeding, another form of segregation which occurs in fresh concrete, is usually a result of over-compaction and can have a detrimental effect on concrete as it causes water to rise to the top surface, creating a weak and porous layer in the hardened concrete which varies from the underlying material. It can also result in areas of high permeability below large aggregate or reinforcement as the rising water becomes trapped; leaving voids in the hardened concrete (Neville and Brooks Citation2010).
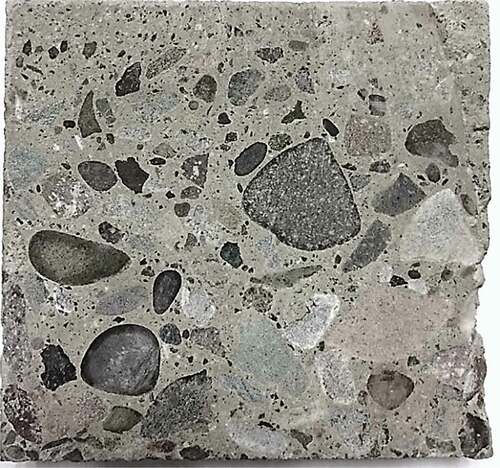
Segregation is of far more concern when dealing with concrete cast in-situ than with concrete cast in a laboratory environment or even cubes taken on a construction site for quality assurance tests. There are two reasons for this: Firstly, when making concrete cubes for laboratory testing, the samples are compacted following a standard procedure — such as BS EN 12390-2 (BSI Citation2009b) — while concrete cast in-situ is compacted to the satisfaction of the concrete finisher, foreman or engineer, and this can result in varying degrees of under or over-compaction, which subsequently affects the heterogeneity of the mix. Secondly, while the control samples used in this study did suffer from some degree of segregation, as shown in , this predominantly results in variations through the vertical plane of the sample and, as the samples were sawn parallel to the vertical plane, these variations are contained within the dimensions of the sample which is being tested. When dealing with in-situ concrete, it is unlikely that the effects of segregation in the bulk of the concrete will be accurately reflected in samples taken for testing, unless they are vertical cores of the full depth of the concrete.
Figure 8. T9 cross-section (100 x 100 mm) showing aggregate segregation.
Another influencing factor is the ‘wall effect’; a physical phenomenon which occurs at the interface of concrete and formwork, where the surface of the formwork affects particle packing by preventing the uniform distribution of coarse aggregate, which in turn causes an increase in the mortar content required to fill the surrounding space (Neville Citation2011). This results in the formation of three skin layers: the cement skin, mortar skin and concrete skin — approximately 0.1 mm, 5 mm and 30 mm respectively (Kreijger Citation1984) — and while the w/c ratio in these layers remains unchanged, both the cement and water content increase (Neville Citation2011). Furthermore, some tests have shown that the wall effect can result in an increase in sand content at the concrete surface equal to 10% of the total mass of aggregate (Shacklock Citation1959). As such, it is important that any material analysed from the surface skins is not considered to be representative of the bulk of the concrete and vice versa.
4. Conclusions
The number of historically-significant concrete structures which require conservation and repair is ever-increasing. As the use of proprietary repair materials has previously resulted in repairs of variable quality, the approach to the repair of historic concrete structures in the United Kingdom has shifted from the use of mass-produced proprietary repair materials to purpose-made ‘like-for-like’ replacements. However, there are four key issues with this approach that have been discussed which need to be considered:
Doubts regarding the accuracy of existing test procedures in general;
The unsuitability of existing procedures for use with historic concrete due to the physical and chemical alteration which has occurred;
Limited availability of substrate to allow accurate characterisation;
The variability of the substrate and ensuring that samples are adequately representative.
Notations
ea is the voids ratio of the aggregate; ec is the voids ratio of the concrete; ec.a is the proportion of the concrete voids ratio attributed to the aggregate; ec.ac is the proportion of the concrete voids ratio attributed to the coarse aggregate; ec.af is the proportion of the concrete voids ratio attributed to the fine aggregate; ec.m is the proportion of the concrete voids ratio attributed to the cement matrix; em is the voids ratio of the cement matrix; Ma.IM is the mass of the saturated sample immersed in water in kg; Ma.OD is the mass of the OD aggregate (total) in kg; MA.OD is the mass of OD aggregate (total) per m3 mix in kg; Ma.SSD is the mass of the SSD aggregate (total) in kg; MA.SSD is the mass of SSD aggregate (total) per m3 mix in kg; MAc is the mass of OD coarse aggregate per m3 mix in kg; MAf is the mass of OD fine aggregate per m3 mix in kg; Mc is the mass of coarse aggregate retained on the 4 mm sieve, in kg; Mcem is the mass of anhydrous cement per m3 mix in kg; Mcw is the mass of combined water per m3 mix in kg; Mf is the mass of fine aggregate passing through the 4 mm sieve, in kg; Mfw is the mass of free water per m3 mix in kg; MM.OD is the mass of OD matrix per m3 mix in kg; Mt is the total mass of aggregate used in the dry sieving procedure, in kg; Mtw is the total mass of water per m3 mix in kg; Va.s is the volume of aggregate solids in m3; Va.SSD is the volume of SSD aggregate per m3 mix in m3; VA.SSD is the volume ratio of saturated-surface-dry aggregate per m3 mix; Va.w is the volume of aggregate voids filled by water in m3; Vm.SSD is the volume of SSD matrix per m3 mix in m3; VM.SSD is the volume ratio of SSD matrix per m3 mix; ρa.SSD is the density of SSD aggregate per kg/m3; ρc.OD is the density of the OD concrete in kg/m3; ρc.SSD is the density of the saturated-surface-dried concrete in kg/m3; ρw is the density of water in kg/m3.
Additional information
Funding
References
- Abrams, D. A. 1922. Proportioning concrete mixtures. ACI Journal Proceedings 18 (2):174–81.
- ASTM International. 1998. C 457-98: Standard test method for microscopical determination of parameters of the air-void system in hardened concrete. West Conshohocken: ASTM International.
- ASTM International. 2018. C 856-18a: Standard practice for petrographic examination of hardened concrete. West Conshohocken: ASTM International.
- Axon, E. O. 1962. A method of estimating the original mix composition of hardened concrete using physical tests. Proceedings, ASTM International 62:1068–80.
- Basheer, P. A. M., and S. Barbhuiya. 2010. Pore structure and transport processes. In Concrete durability: A practical guide to the design of durable concrete structures, ed. M. Soutsos, 14–34. London: Thomas Telford.
- BSI (British Standards Institution). 2009a. BS EN 12390-7:2009, testing hardened concrete, Part 7: Density of hardened concrete. London: BSI.
- BSI (British Standards Institution). 2009b. BS EN 12390-2:2009, testing hardened concrete, Part 2: Making and curing specimens for strength tests. London: BSI.
- BSI (British Standards Institution). 2011. BS EN 197-1:2011, cement, Part 1: Composition specification and conformity criteria for common cements. London: BSI.
- BSI (British Standards Institution). 2012a. BS EN 12390-1:2012, testing hardened concrete, Part 1: Shape, dimensions and other requirements for specimens and moulds. London: BSI.
- BSI (British Standards Institution). 2012b. BS EN 933-1:2012, tests for geometrical properties of aggregates, Part 1: Determination of particle size distribution - sieving method. London: BSI.
- BSI (British Standards Institution). 2013a. BS 1881-125:2013, testing concrete, Part 125: Methods for mixing and sampling fresh concrete in the laboratory. London: BSI.
- BSI (British Standards Institution). 2013b. BS EN 1097-6:2013, tests for mechanical and physical properties of aggregates, Part 6: Determination of particle density and water absorption. London: BSI.
- BSI (British Standards Institution). 2015. BS 1881-124:2015, testing concrete, Part 124: Methods for analysis of hardened concrete. London: BSI.
- BSI (British Standards Institution). 2016. BS 1881-211:2016, testing concrete, Part 211: Procedure and terminology for the petrographic examination of hardened concrete. London: BSI.
- Bussell, M. 2001. The development of reinforced concrete design and practice. In Historic concrete: Background to appraisal, ed. J. Sutherland, D. Humm, and M. Chrimes, 83–103. London: Thomas Telford.
- Concrete Society. 2009. Historical approaches to the design of concrete buildings and structures. Technical Report No. 70, Concrete Society, Camberley, Surrey.
- Concrete Society. 2014. Analysis of hardened concrete. Technical Report No. 32, Concrete Society, Camberley, Surrey.
- Corish, A. T., and P. J. Jackson. 1982. Portland cement properties - past and present. Concrete 16 (7):16–18.
- Department for Culture, Media and Sport. 1979. Ancient monuments and archaeological areas act. London: Her Majesty’s Stationary Office.
- Eden, M. A. 2010. SR2, A code of practice for the petrographic examination of concrete. London, United Kingdom: Applied Petrography Group.
- English Heritage. 2012. Practical building conservation: Concrete. 1st ed. London: Ashgate.
- Halstead, P. E. 1961. The early history of Portland cement. Transactions of the Newcomen Society 34 (1):37–54. doi:https://doi.org/10.1179/tns.1961.003.
- Ishida, T., and K. Maekawa. 2001. Modelling of pH profile in pore water based on mass transport and chemical equilibrium theory. Concrete Library of JSCE 37:131–46.
- Kreijger, P. C. 1984. The skin of concrete composition and properties. Matériaux et Construction 17:275–83. doi:https://doi.org/10.1007/BF02479083.
- Lerch, W. 1938. Approximate glass content of commercial Portland cement clinker. Journal of Research of the National Bureau of Standards 20 (January):77–81. doi:https://doi.org/10.6028/jres.020.045.
- Neville, A. M. 2003. How closely can we determine the water-cement ratio of hardened concrete? Materials and Structures 36 (June):311–18. doi:https://doi.org/10.1007/BF02480870.
- Neville, A. M. 2011. Properties of concrete. 5th ed. Harlow: Pearson Education Limited.
- Neville, A. M., and J. J. Brooks. 2010. Concrete technology. 2nd ed. Harlow: Pearson Education Limited.
- Nordtest Method. 1999. NT BUILD 361 - Concrete, hardened: Water-cement ratio, 2nd ed.Espoo: Nordic Council of Ministers.
- Pasley, C. W. 1826 [1862]. Practical architecture: Brickwork, mortars and limes. Chatham: Royal Engineer Establishment.
- Polivka, M., J. W. Kelly, and C. H. Best. 1956. A physical method for determining the composition of hardened concrete. Cement and Concrete, ASTM Special Technical Publication No. 205, September, 135–51, Philadelphia.
- Shacklock, B. W. 1959. Comparison of gap and continuously graded concrete mixes. Technical Report TRA/240. Cement and Concrete Association, London.
- Skinner, M. G. 1980. Chemical analysis of hardened concrete – An investigation of within batch variation and its effects on unit cement content. Crowthorne: Institute of Concrete Technology.
- Somerville, G. 2001. Cement and concrete as materials: Changes in properties, production and performance. In Historic concrete: Background to appraisal, ed. J. Sutherland, D. Humm, and M. Chrimes, 105–16. London: Thomas Telford.
- St John, D. A. 1994. The use of fluorescent dyes and stains in the petrographic examination of concrete. Industrial research limited report, Vol. 243. Lower Hutt: Industrial Research Limited.
- Taylor, H. F. 1997. Cement chemistry. 2nd ed. London: Thomas Telford.
- Wong, H. S., and N. R. Buenfeld. 2009. Determining the water-cement ratio, cement content, water content and degree of hydration of hardened cement paste: Method development and validation on paste samples. Cement and Concrete Research 39:957–65. doi:https://doi.org/10.1016/j.cemconres.2009.06.013.
- Yeomans, D. 1997. Construction since 1900: Materials. 1st ed. London: B.T. Batsford.