
 ?Mathematical formulae have been encoded as MathML and are displayed in this HTML version using MathJax in order to improve their display. Uncheck the box to turn MathJax off. This feature requires Javascript. Click on a formula to zoom.
ABSTRACT
Historic masonry buildings often require structural repair or retrofit to attain a satisfactory level of seismic resistance. This paper analyses the effect of externally bonded fibre-reinforced polymer (FRP) retrofitting systems on the global seismic response of such buildings in order to achieve the fundamental code-based requirements that refer to the structure’s state of damage for a specified limit state. As a case study, a three-storey historic unreinforced masonry (URM) building was selected. The first part of the paper presents an FRP design procedure for determining which vertical structural elements should be retrofitted and to what extent. As a result, six different FRP retrofitting layouts have been selected and analysed with the aid of non-linear static analyses in the second part of the paper. The paper concludes with a cost-feasibility study by introducing a cost-effectiveness index for FRP reinforcement that identifies the effectiveness of an FRP layout by accounting for the amount of retrofitting material used and comparing it with its effectiveness in improving the global seismic resistance.
1. Introduction
Historic masonry buildings often require structural repair or retrofit to attain a satisfactory level of seismic resistance. Such buildings have not been designed to withstand seismic loading, and many also suffer from accumulated deterioration effects, such as material decay, foundation settlements, construction errors, ambient vibrations, previous seismic events, etc. Furthermore, recent seismic activities in earthquake-prone regions with a high percentage of historic masonry structures, for example in Southern and Central Europe (), have shown that the vulnerability of these buildings represents an extreme risk that can eventually lead to their loss as well as the loss of lives.
Figure 1. Examples of typical URM buildings located in historic city centres of Central and Southern Europe

Many new and improved reinforcing techniques for the structural strengthening and retrofit of unreinforced masonry (URM) buildings have been developed and studied in recent decades. One of the first attempts of strengthening a historic masonry wall by external reinforcement with externally bonded fibre-reinforced polymers (FRP) was done more than 30 years ago (Croci et al. Citation1987). These materials are typically made of various types of fibres, including carbon (CFRP), glass (GFRP), or aramid (AFRP). The fibres are bonded together with a polymeric matrix (e.g., epoxy, polyester, vinyl ester). This combination offers the designer a broad combination of properties, including high strength and stiffness in the direction of the fibres (Triantafillou Citation1998). Therefore, the key advantages in their application are in the high strength-to-weight ratios and in the almost negligible influence on the global mass. Moreover, advanced composites have high durability, good corrosion resistance, are easy to handle, enable quick on-site installation and can also be very effective in post-earthquake repair (Marcari et al. Citation2007). Even though many advantages are associated with the use of FRP reinforcement, some of its drawbacks should also be noted, such as the poor behaviour of epoxy resins at high temperatures, the relatively high cost of epoxy, and the non-applicability of FRPs on wet surfaces. Another disadvantage associated with the use of FRP reinforcement on historic masonry walls, is the low water-vapour permeability of this material. As reported by Cascardi et al. (Citation2019a) if for some reason the FRP intervention has to be removed, the polymeric adhesives bonds the fibers to the masonry substrate, eliminating the possibility of preserving the underlying material during a replacement operation. Therefore, new techniques are being developed, like the use of textile reinforced mortar (TRM), which can overcome these problems by replacing organic binders with inorganic ones such as cement based mortars (Ismail and Ingham Citation2016).
In recent years, numerous studies regarding the modelling and application of FRP laminates for the retrofitting of historic masonry structures have been conducted, the majority of which focus in researching the increase in the load-bearing capacity of individual members. In the scope of the present paper, some previously conducted research is indicated.
Within the framework of Eurocode 6, Triantafillou (Citation1998) conducted a systematic analysis of the short-term strength of masonry walls strengthened with FRP laminates under monotonic out-of-plane bending, in-plane bending, and in-plane shear. Borri, Corradi, and Vignoli (Citation2001) investigated the shear strength of masonry specimens reinforced using CFRP and GFRP on vaults or arches as well as wrapping FRP sheets around the external perimeters of buildings to avoid out-of-plane mechanisms. Micelli, Cascardi, and Marsano (Citation2016) presented a new technique in which pre-tensioned FRP wires were designed and applied as external strengthening ties to a historical masonry building used as public theatre. In-plane resistance of FRP strengthened walls was further investigated by Valluzzi, Tinazzi, and Modena (Citation2002), Marcari et al. (Citation2007), and Prota, Manfredi, and Nardone (Citation2008), based on different configurations of FRP strips, i.e., diagonal and grid layouts, incorporating CFRP and GFRP. Jarc Simonič et al. (Citation2015) performed in-situ experiments on 12 one-hundred-year-old URM walls with different reinforcement configurations of CFRP and GFRP. Martinelli et al. (Citation2016) performed cyclic shear-compression laboratory tests on masonry walls strengthened with alternative configurations of CFRP strips, while Rahman and Ueda (Citation2016) performed an extensive experimental study, investigating the in-plane shear performance CFRP and polyethylene terephthalate-FRP (PET-FRP) strengthened masonry walls. Saleem et al. (Citation2016) conducted scale model tests on buildings with openings retrofitted with various levels of FRP reinforcement, while Emami, Eftekhar, and Karimizadeh (Citation2020) presented refined FRP installation methods that delay the debonding of composites from the masonry wall surface.
Another important aspect of retrofitting of historic masonry structures is the use of FRP for the confinement of masonry columns. The basic behaviour of solid brick masonry columns confined by CFRP was studied by Corradi, Grazini, and Borri (Citation2007), where compression tests were carried out on 24 clay solid brick columns. Since full-wrapping insulates the column from the environment, Di Ludovico et al. (Citation2010) carried out an experimental program with three different confinement solutions on scaled masonry columns subjected to uniaxial compression load. Similarly, Cascardi et al. (Citation2019b) have conducted an experimental and theoretical study with different schemes of discontinuous FRP-wrapping by means of uniaxial compression tests.
In terms of numerical modelling relevant to the present study, the study by Grande, Imbimbo, and Sacco (Citation2011) is notable. In that study, a simple beam finite element for the nonlinear analysis of masonry structures strengthened with FRP was developed, while Gattulli et al. (Citation2014) proposed and assessed a simplified FE modelling strategy to simulate the global behaviour of masonry structures externally reinforced with FRP composite strips applied with a grid configuration. The latter study was later expanded by adopting the Monte Carlo simulation method to account for the uncertainty of the mechanical parameters characterizing the analytical model for FRP reinforcement (Gattulli et al. Citation2017).
Regarding practical applications of the seismic retrofitting of existing masonry buildings with FRP systems, much research was conducted following the recent devastating seismic events in Italy. In this context, it is worth mentioning the research work by Valluzzi, Modena, and de Felice (Citation2014), in which recent scientifically documented practical applications were investigated. Moreover, an extensive study regarding the reconstruction process of damaged residential buildings after the L’Aquila earthquake was conducted by Di Ludovico et al. (Citation2017).
The recent research and applications of FRP systems also lead to the development of more refined technical guides for their design and installation, such as the Italian CNR-DT 200/2013 (CNR Citation2013) or the American ACI 440.7R-10 (ACI Committee Citation2010). Nonetheless, as pointed out by Valluzzi, Modena, and de Felice (Citation2014), practical application of FRP systems is still very often carried out without design or assessment guidelines, mostly resulting in the excessive use of fibres (multiple layers, extensive covering), meaning that the overall effect of the FRP reinforcement on the building is usually not specifically assessed. Moreover, as can be seen from the provided literature review, in many cases, the existing research and design guides focus on designing and analysing FRP systems applied to a single masonry panel and do not consider in detail the effect of the applied FRP reinforcement to the building as a whole. This means that FRP design professionals must rely on their engineering judgement and experience to determine the optimal FRP layout for the structure.
Therefore, the purpose of this study is to more thoroughly analyse the effect the applied FRP systems on the global seismic response of the building in order to achieve the fundamental code-based requirements that refer to the structure’s state of damage for a selected seismic return period. A numerical case study comparison is presented in which a historic neo-Renaissance unreinforced masonry (URM) structure is retrofitted with various layouts of CFRP and one layout using GFRP laminates, considering different reinforcement ratios and positions of FRP strips on selected walls. In one case, the whole outer façade is retrofitted with FRP, while in others the application of FRP is limited to the outer or just to the inner piers of the selected wall assemblage. For this purpose, an equivalent frame URM model was created in the structural analysis program SAP2000 (CSI Citation2019) and was modified to include the FRP-strengthened variants. Nonlinear static (pushover) analyses were conducted, and the results in the form of pushover curves and inter-storey drift ratios were compared. Additionally, the progression of damage in individual structural members was analysed and compared. In the final part of the paper, a simple cost-feasibility study of analysed FRP layouts was conducted by introducing a cost-effectiveness index, which identifies the effectiveness of an FRP layout based on the amount of retrofitting material used and the difference between the seismic return periods of the initial and of the retrofitted structure.
2. FRP design considerations
Heritage masonry structures may, to some extent, possess some earthquake-resistant geometrical features (Jorquera et al. Citation2017). Therefore, as discussed by Valluzzi, Modena, and de Felice (Citation2014) the structural strengthening procedures with FRP laminates can usually be divided into the following groups based on mechanical and geometrical characteristics: (a) increase in the load-bearing capacity of structural members; (b) improvement of seismic capacity of the whole building (ties, connections among components, strengthening); (c) mitigation of previously developed damage; (d) limiting the opening of cracks and repairing of local weaknesses. The design approach for improving the global seismic response of a historic masonry structure in the context of FRP retrofitting is, therefore, in the strengthening of the weak links in the existing structural system without drastically changing the building or its collapse mechanisms.
For the design of the FRP strengthening of URM, the Italian guidelines CNR-DT 200 R1/2013 (CNR Citation2013) were considered in this study since they are commonly used by practising engineers in Southern and Central Europe. The guidelines state that the primary goal of FRP strengthening of historical structures is to increase the capacity of each structural member as well as the overall capacity of the masonry structure. When considering the strengthening of historical structures, a critical evaluation of the strengthening technique is required with respect to the local standards for preservation and restoration.
2.1. Design for seismic actions
The design of FRP for seismic retrofitting of existing buildings is usually a challenging process, since each building presents a specific and unique problem, derived from its geometry, structural details, the quality of its materials, and the amount and quality of the information usable for its assessment. The compliance criteria set out in Part 3 of Eurocode 8 (CEN Citation2005c) define that for each predefined structural limit state (state of damage) the seismic demand does not exceed its corresponding limit state capacities. Therefore, the design of FRP for seismic actions is feasible when an unstrengthened masonry member does not satisfy one or more of the code-based limit states.
According to the CNR guidelines, the design of FRP reinforcement for seismic applications is aimed at the total or partial strengthening, replacing, or rebuilding of structural members (i.e., local behaviour) and modifying the overall structural behaviour by means of the connection of different structural members (i.e. global behaviour). This is achieved by identifying and considering the following cases (CNR Citation2013):
when masonry structures are unable to withstand vertical and horizontal loads they should be strengthened or replaced;
walls ending on masonry T-junctions or masonry edges should be appropriately connected;
unsatisfactory connections between floors/roof and vertical walls should be rectified;
horizontal forces generated from roofs, arches, and vaults should be taken by appropriate structural members.
2.2. In-plane shear capacity
The strengthening of masonry elements to withstand vertical and horizontal seismic loads is done by increasing their in-plane shear capacity. The shear capacity of a masonry pier strengthened with FRP applied on both sides of the panel can be seen as the combination of two resisting mechanisms (CNR Citation2013): (a) shear forces due to friction in the presence of compression loads; (b) for elements capable of resisting tensile stress, a truss mechanism becomes active, and shear forces are carried out by equilibrium.
The CNR guidelines define the design in-plane shear capacity of the FRP strengthened masonry panel VFRP as the sum of the shear load carried by an equivalent unreinforced masonry specimen VRd,m and the shear load contribution of the FRP strengthening VRd,f up to the maximum value VRd,max corresponding to the failure of the compressed strut of an equivalent truss mechanism:
The masonry contribution to the shear strength of the panel VRd,m is given by
where d = 0.8∙D is the effective width of a masonry panel with width D and thickness t. According to the CNR guidelines, the design shear strength of masonry fvd is calculated in accordance with Eurocode 6 (CEN Citation2005a), while the partial factor for shear equals to γRd = 1.20. It should be noted that researchers have also suggested modified versions of Formula (2). For example, Triantafillou (Citation1998) suggested omitting the γRd factor, while Marcari et al. (Citation2007) suggested that the VRd,m should correspond to the diagonal tension shear strength that was originally proposed by Turnšek and Čačovič (Citation1971), neglecting the shear sliding mechanism, since it was not detected in their experimental analyses.
The FRP strips are generally applied to a URM panel in a grid configuration consisting of at least two horizontal FRP strips and two vertical FRP strips (), although a diagonal layout, with FRP strips placed along the diagonals of the panel, can also be adopted. It is preferable that the FRP reinforcement be placed on both sides of the panel in order to prevent asymmetric shear stiffness distribution. Experimental investigations carried out by Valluzzi, Tinazzi, and Modena (Citation2002) have shown that FRP reinforcement applied only at one side of the panels did not significantly modify the shear collapse mechanisms of the URM panel.
Figure 2. Typical FRP grid layout on an URM panel
In the present research, only the grid configuration has been considered; therefore, the calculation of shear strength for diagonal layout is not presented in greater detail. The grid configuration was selected due to installation considerations, since it offers more control for ensuring proper anchoring of the FRP strips in the case of FRP application on both sides of the panel (Gattulli et al. Citation2014). Furthermore, some researchers (e.g. Jarc Simonič et al. Citation2015) have concluded that the primary mode of failure of the diagonally strengthened wall was attributed to the exceeding of the compressive strength at the wall toes due to rocking, which resulted in a localized compression failure of masonry.
When placing FRP strips parallel to the shear direction (horizontal FRP strips) the FRP contribution (VRd,f) is given by:
where Af is the area of FRP shear strengthening in the direction parallel to the shear force, pf is the centre-to-centre spacing of FRP reinforcement measured orthogonally to the direction of the shear force.
The ffd denotes the design strength of FRP reinforcement, defined as the lesser between FRP tensile failure strength and debonding strength:
where Ef is Young’s modulus of elasticity of FRP, εfk represents the FRP characteristic strain at failure, and εfdd is the maximum FRP strain after FRP debonding takes place. A detailed procedure for its calculation is given in the CNR guidelines; it is not presented in the paper for the sake of brevity. The environmental conversion factor ηa is an empirically determined value depending upon fibre/resin type and exposure conditions. For instance, ηa = 0.65 for externally applied FRP made of glass fibres and epoxy resin and ηa = 0.85 for externally applied FRP made of carbon fibres and epoxy resin. γf is the partial factor of FRP equal to 1.10.
The vertical FRP strips ensure the formation of the truss mechanism by carrying tensile loads. Due to the flexibility and possibility of the local detachment of FRP near shear cracks, the efficiency of the vertical reinforcement is low (Jarc Simonič et al. Citation2015). Therefore, only two vertical strips are usually placed on one side of the panel. It is also important to note that sufficient anchorage of the vertical strips is needed. If the anchorage of vertical strips is ensured, the shear strength contribution of masonry can be calculated as indicated by Eurocode 6 (CEN Citation2005a).
Since strengthened panels are vulnerable also when compression stresses are exceeded (toe-crushing failure), the upper limit of EquationEquation (1)(1)
(1) is defined by the failure of the compressed strut of the equivalent truss mechanism. The limit value given by Triantafillou (Citation1998) was considered in this study:
where fcd is the design compressive strength of masonry.
3. Preliminary analysis
A preliminary case study comparison was conducted on single-FRP-strengthened masonry panels by considering various horizontal FRP reinforcement ratios. The geometry and material properties of the panels correspond to a historic masonry building that has also been analysed in the second phase of the research; its global seismic behaviour was examined in its initial (unstrengthened) state and compared with various FRP strengthened variants.
3.1. Analysed case-study building
The selected masonry panels are part of a three-storey neo-renaissance URM building, typical of Central and Southern Europe. Detailed information regarding its geometry and modelling are presented in two previous papers by the authors (Petrovčič and Kilar Citation2013, Citation2017), while the initial building geometry and material parameters were adopted from the “Catania Project” (Liberatore et al. Citation1999; Liberatore, Spera, and Palermo Citation2000). The floor plan dimensions of the building are 24.6 m × 12.9 m (directions X and Y, respectively) and the total height is 15.8 m. The thickness of the walls on the ground floor is 86 cm, while in the 1st and 2nd floors the wall thickness is 57 cm. The building is divided into four different types of planar wall assemblies, i.e., Wx-1, Wx-2 in the X-direction and Wy-1, Wy-2 in the Y-direction. The schematic representation of the structure is presented in , while the mechanical properties of masonry are given in . Each wall assemblage is made of individual masonry piers that are interconnected at storey levels with spandrel elements above the window and door openings. It has been assumed that the storey slabs of the building have been retrofitted by substituting the initial timber slabs with unidirectional timber beams (as suggested, for example, by Unuk, Premrov, and Žegarac Leskovar Citation2019) or by installing monolithic RC slabs. The retrofitted slabs act as stiff diaphragms. Furthermore, to prevent the out-of-plane failure of walls, it has been assumed that horizontal steel ties or FRP strips have been installed around the perimeter of the building on each floor.
Table 1. Mechanical properties of masonry
Figure 3. Geometry of the examined masonry building with indicated macro-elements (piers, spandrels and rigid zones)
The storey masses amount to mground = 878 tons, m1 = 748 tons and m2 = 499 tons, whereas the fundamental periods of the structure are TX = 0.39 s (in the X-direction) and TY = 0.29 s (in the Y-direction). The building is located on a moderately active seismic area with a peak ground acceleration (PGA) equal to 0.25 g and a soft soil site that corresponds to sub-soil of class C in accordance with Eurocode 8 — Part 1 (CEN Citation2005b).
3.2. Numerical modelling
An inelastic mathematical model of the initial unreinforced masonry (URM) structure was created in the structural analysis program SAP2000 (CSI Citation2019). An equivalent frame modelling methodology has been adopted in the study, where individual masonry walls are further divided into piers and rigid zones (see for example Belmouden and Lestuzzi Citation2009; Calderini, Cattari, and Lagomarsino Citation2009; Castori et al. Citation2019; Magenes and Fontana Citation1998; Magenes and Calvi, Citation1997). The rigid zones account for connection zones between piers and spandrels and nominally much stiffer than their connecting elements.
In the adopted model, the in-plane lateral resistance of URM buildings is provided by the piers and spandrels. In each pier, three failure mechanisms can be observed (Cattari et al. Citation2015; Kappos and Papanikolaou Citation2016; Parisi and Augenti Citation2013): (a) the rocking failure mode, in which tensile flexural cracking at pier corners takes place and/or vertical cracks appear in the more compressed corner (toe-crushing); (b) the diagonal cracking failure mode, in which diagonal cracks develop in the masonry panel, typically involving both mortar joints and masonry units; (c) the shear sliding failure mode, in which in-plane sliding along a single mortar bed-joint or along bed-joints and head-joints in a stepwise fashion occurs.
The ultimate lateral strength of an URM pier (VURM) is expressed as the minimum shear strength of each of the failure modes at certain value of the vertical force in the pier (e.g., Bosiljkov et al. Citation2010; Calderini, Cattari, and Lagomarsino Citation2009; Elnashai and Di Sarno Citation2008; Turnšek and Čačovič Citation1971). To simultaneously account for different failure modes in an as simple as possible and computationally effective way, a modelling technique that was proposed by the authors in their previous research (Petrovčič and Kilar Citation2013) was used. This technique is based on the equivalent frame approach and incorporates linear beam elements and the plastic hinge concept. The complex seismic failure mechanism of masonry piers is expressed by a single failure mode interaction surface (an “FMI surface”), taking into account the influence of variation in the pier’s vertical loading, and its bending moment distribution.
A simple out-of-plane mechanism has also been included in the model, based on the article by Doherty et al. (Citation2002), in which a trilinear relationship is used to characterize the nonlinear force-displacement relationship for unreinforced masonry walls. The description of the considered mechanism is also given in the previous article by the authors (Petrovčič and Kilar Citation2013).
The inelastic behaviour of URM spandrels was modelled based on the provisions given by Beyer (Citation2012) which, in general, predict two failure modes, i.e. shear cracking failure and rocking failure. In the case of shear cracking failure, it is considered that, due to openings above and below the spandrel element, the bed-joints are subject to a normal stress that is almost equal to zero, and that shear strength is therefore provided by cohesion only. The flexural failure of a spandrel is based on the assumption that a tension member (e.g. a tie rod, a timber lintel, a masonry arch, etc.) is included at the spandrel’s bottom edge.
3.3. Seismic performance assessment
In this study, the provisions of Eurocode 8 — Part 3, i.e. EC8-3 (CEN Citation2005c), which deals with the assessment and retrofitting of existing buildings, were considered. To achieve an appropriate level of seismic protection, the EC8-3 takes into account a different seismic return period (TR) for each of the limit states. In general, the considered limit states and their corresponding return periods vary from country to country and are given in the corresponding National Annexes to EC8-3. For the present study, TR and PGA values have been considered for the following limit states:
Damage limitation (DL), where TR = 95 years and PGA = 0.15 g;
Significant damage (SD), where TR = 475 years and PGA = 0.25 g.
The seismic performance was examined by conducting a nonlinear static (pushover) analysis, which is often employed for evaluating the performance levels that are associated with large inelastic deformations of URM buildings (Petrovčič and Kilar Citation2013; Gattulli et al. Citation2017; Marino, Cattari, and Lagomarsino Citation2019; Micelli and Cascardi Citation2020). In , the pushover curves with unidirectional lateral loading applied in both governing directions are presented, namely Pushover-X and Pushover-Y. The selected lateral force distribution pattern was proportional to the first mode of vibration. The lateral loads were weighted with nodal masses and applied to the nodes corresponding to the individual storey levels.
Figure 4. Results of nonlinear static analyses of the URM building
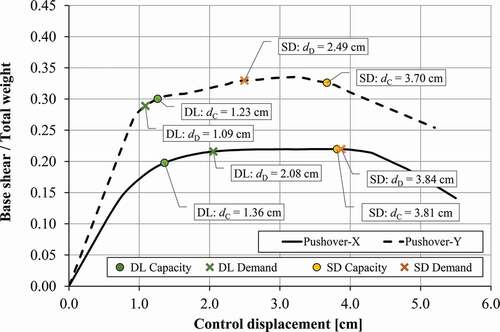
The demand parameter that was compared to the capacity was the horizontal displacement of the roof (control displacement). The N2 method (Fajfar Citation2000) was used to determine the demand control displacement (dD) by comparing the intersection between the capacity obtained by pushover analysis and by an inelastic response spectrum. The seismic demand control displacements of each considered limit state are also presented in .
The protection levels, which are defined in EC8-3 as the limit states DL and SD, are also indicated in the figure. For a structure to meet the code-based compliance criteria, the calculated demand control displacements must not exceed their corresponding limit state capacities (dC), i.e., dD ≤ dC.
It can be seen from that for the X-direction of seismic loading for all two observed limit states, the corresponding demand exceeds the capacity requirements, indicating that the building’s seismic performance is inadequate. The response of the structure for the Y-direction of seismic loading seems to be less critical. In the case of the DL and SD limit states, the dC does not exceed the capacity limits. Therefore, in this study, only the seismic performance for the loading in X-direction of the building was analysed in the continuation of this research.
4. Seismic retrofitting with various FRP layouts
4.1. Horizontal FRP reinforcement ratio and the global seismic response
The application of seismic retrofitting techniques can lead to various levels of seismic protection, which are characterised by performance levels that indicate the structure’s ability for its immediate reusability, recovery time, economic impacts due to downtime, etc. Many different protection levels can be considered when retrofitting structures classified as architectural heritage, for instance, the artistic assets limit state (Lignola et al. Citation2016) or other possible criteria, e.g. criteria based on a multiscale approach as proposed by Lagomarsino and Cattari (Citation2015).
Since the limit states set out EC8-3 have been considered in this study, it is the requirement of the DL limit state that the retrofitted structure not need any extensive repair measures when subjected to a seismic event with a 95-year return period. The DL limit state requires that the structure be only lightly damaged, with structural elements prevented from significant yielding and retaining their strength and stiffness properties, i.e., the structural behaviour has to remain nominally elastic.
Therefore, by incorporating the N2 method on an elastic model of the URM structure, the required target displacement for the DL limit state was calculated, as indicated in . The figure indicates that the dD of the equivalent single-degree-of-freedom (SDOF) system equals to 1.60 cm. To obtain the target control displacement of the multi-degree-of-freedom (MDOF) system, the calculated displacement value has to be multiplied with Γ = 1.30, where Γ is the participation factor computed with reference to the given deformed shape and accounts for the transformation of the pushover curve (representative of the MDOF system) into a capacity curve (representative of an equivalent SDOF system) (Fajfar Citation2000). For the analysed case, the dD of the elastic MDOF system equals to 2.08 cm for the DL limit state.
Figure 5. (a) Calculation of the target top displacement for the DL limit state based on the N2 method and (b) piers with exceeded seismic demand for the DL limit state (shaded elements)
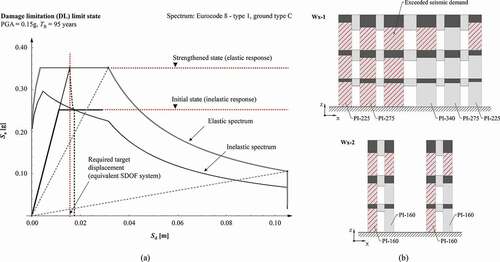
For each pier element in the building, the (NEd,DL, VEd,DL) pair was registered, indicating its vertical force and the shear force, respectively, when the elastic MDOF system reached dD (DL limit state demand). The registered elastic shear force VEd,DL in the pier was then compared to the piers initial lateral strength VURM, calculated by considering the value of the vertical force equal to NEd,DL. In the piers for which VEd,DL/VURM > 1.0 seismic strengthening is required. Specific pier members that need to be strengthened are indicated in (shaded elements).
indicates the general geometric characteristics of each pier. The symbols D and H denote the pier’s width and height, respectively, while t denotes the thickness of the pier. The symbol λ indicates the pier’s height-to-width ratio. The naming of each pier element (PI) refers to a number indicating the width of the pier D and its floor number. The ratio NEd,DL/NRd,max indicates the normalised compressive force in the pier, for which NRd,max is the ultimate compressive strength of the pier.
Table 2. Geometry and shear capacity of URM piers and the DL limit state demand
The registered (NEd,DL, VEd,DL) pairs are also given in . It should be noted that pushover forces were applied in +X-direction, meaning that global overturning moment around Y-axis will produce additional compressive forces on the right side and decompressive forces on the left side of wall assemblages Wx-1 and Wx-2. Since in URM panels lower values of compressive forces lead to a lower shear resistance (see e.g., Petrovčič and Kilar Citation2013), the (NEd,DL, VEd,DL) pairs for the decompression side of the wall assemblage were considered in the study and are indicated in .
To calculate the optimum amount of FRP reinforcement for each pier, a preliminary analysis, considering various levels of horizontal reinforcement, was conducted. Each pier was strengthened with FRP strips positioned in a grid layout on each side, consisting of two vertical FRP strips on the edges of the panel and a varying number of horizontal FRP strips (ns) as presented in . The same amount and layout of FRP strips on each face of every panel were considered in order to prevent eccentric stiffness and strength distribution.
CFRP laminates from a commercial manufacturer were selected; strengthening with GFRP laminates was also considered. The material characteristics of the FRP material are presented in . Horizontal FRP strips with a thickness of one ply were used. It was assumed that anchoring devices could allow the FRP to attain at least 30% of its ultimate tensile capacity before intermediate debonding could occur. For each case, the VFRP given by EquationEquation (1)(1)
(1) was calculated.
Table 3. Mechanical properties of FRP reinforcement
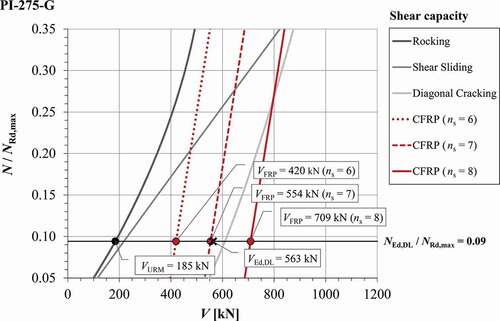
displays the shear capacity of pier PI-275-G (pier in the ground floor) as a function of the normalized compressive force in the pier. Individual URM failure modes (rocking, shear sliding and diagonal cracking) are indicated, while the pier´s ultimate lateral strength (VURM) is equal to their minimum value at a certain level of the vertical force. also indicates the effect of CFRP reinforcement on the lateral strength VFRP of the pier for three different values of ns. It can be seen from the figure that VFRP increases with respect to the vertical force in a linear manner and that at least 8 horizontal CFRP strips would be needed to fulfil the DL limit state demand for the selected pier.
Figure 6. Shear capacity of pier PI-275-G in terms of the vertical force for its initial (URM) state and for three CFRP distributions
In , the ratio VEd,DL/VFRP is presented in terms of ns for all four considered piers in the ground floor of the analysed building for CFRP ( a) and GFRP ( b). The ns was varied from 4 to 13 for the case of CFRP and from 4 to 16 in the case of GFRP. To account for the DL strength demand with CFRP, six horizontal strips for PI-160 and seven horizontal strips for PI-225 would be needed, while for PI-275 and PI-340 eight strips would be needed. In the case of GFRP, a larger number of horizontal strips is required to fulfil the design condition, since the modulus of elasticity and the tensile strength of GFRP is smaller.
Figure 7. Parametric analysis of the FRP efficiency ratio (VEd,DL/VFRP) expressed in terms of the number of horizontal FRP strips
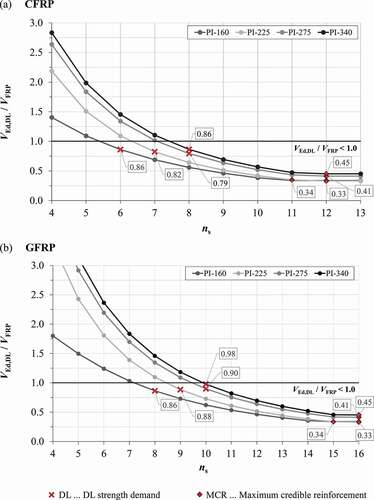
The abbreviation “MCR” in stands for “Maximum Credible Reinforcement” and indicates the lower bound of the VEd,DL/VFRP ratio, where the failure of the compressed strut of masonry (VRd,max) is reached. Further increasing the ns beyond MCR would not result in any additional increase in the lateral strength, since the failure of the compressive strut would present the governing criterion.
It can be seen that for CFRP the MCR is either 11 or 12 horizontal strips, while for GFRP the MCR is either 15 or 16 horizontal strips. All values of ns between DL and MCR, therefore, present plausible reinforcement options.
In , detailed results for the CFRP and GFRP shear capacities of each considered pier of the model are presented. The results present minimum ns for achieving the DL limit state and the MCR. In the table, the horizontal FRP reinforcement ratio (ρh) is also given. The ρh is defined as the geometrical reinforcement ratio in the horizontal direction, which is expressed as a percentage of the total cross-sectional area of FRP in the horizontal direction over the corresponding gross sectional area of the panel. Therefore, ρh is equal to Af/H∙t.
Table 4. Shear capacities of CFRP and GFRP strengthened piers for the DL limit state demand and the MCR
4.2. Selection of FRP layouts for the analysed building
When a wall assemblage under horizontal seismic loading experiences local inelastic behaviour, a redistribution of internal forces usually takes place. Technical guidelines for FRP systems focus primarily on the layout of the FRP reinforcement on specific panels and not on the wall assemblage as a whole. Furthermore, as discussed by Borri and Corradi (Citation2019), criteria addressing the problem of the conservation and protection of architectural heritage due to heavily structurally-oriented interventions should also be accounted for when designing seismic retrofitting measures.
Therefore, to improve the global seismic response of the structure, a reasonable and rational distribution of FRP laminates on specific load-bearing elements of the building needs to be determined by the retrofit design engineer. The implemented FRP layout should be effective in terms of seismic strengthening, financially feasible, and compliant with conservation guidelines.
In this study, six cases, indicating different FRP layouts of the analysed case-study building, were considered and analysed. They are grouped into three categories:
In the first category, ns is determined for each pier element based on the condition that the global seismic response of the retrofitted structure for the DL limit state remains elastic, as discussed in Section 4.1 and presented in . FRP reinforcement is applied to all elements where VEd,DL/VURM > 1.0 by taking into account horizontal seismic loading in the +X and -X direction (DL design condition). By considering two types of FRP fibres, two cases with different layouts were defined: the “CFRP-ALL-DL” case for CFRP laminates and “GFRP-ALL-DL” case for GFRP laminates.
In the second category, the horizontal CFRP strips were only placed on the outermost piers (OP) of the external wall assemblage Wx-1, i.e., PI-225 in the considered case-study. This is a common type of layout considered in practice, since global rocking of the building induces a larger variation in the vertical force N in the outermost piers, resulting in variation in the shear capacity of the piers (see ). Two specific types of layouts were considered in this set. In the first layout, the ns on piers PI-225 was determined by considering the DL design condition for each storey. This case was named “CFRP-OP-DL”. In the second layout, the MCR on piers PI-225 was considered, indicating the maximum plausible lateral strength provided by FRP reinforcement. The second case from this set was therefore named “CFRP-OP-MCR”.
In the third category, the horizontal CFRP strips were placed only on the innermost piers (IP) of wall assemblage Wx-1, i.e., PI-340. Since PI-340 is a stocky pier with a height-to-width ratio equal to λ = 1.20 in the ground storey, its initial shear capacity (VURM) is much larger than in the case of more slender piers (). Therefore, increasing its shear capacity with FRP will also noticeably increase the overall shear capacity of the building. As in previous cases, ns on pier PI-340 was firstly determined by considering the DL design condition and secondly by considering the MCR. The two models were named “CFRP-IP-DL” and “CFRP-IP-MCR”, respectively.
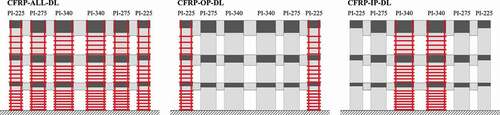
The number of horizontal strips of each pier (DL or MCR) can be found in . In , the CFRP layouts for the DL on Wx-1 are schematically presented.
Figure 8. Schematic representation of CFRP layouts based on the DL design condition on wall assemblage Wx-1
4.3. Numerical modelling of FRP retrofit layouts
The inelastic numerical modelling for the examined retrofitted cases was based on the same principle of an equivalent frame modelling with lumped plasticity as in the case of URM. The proposed plastic hinge definitions of Petrovčič and Kilar (Citation2013) were modified to accommodate the failure criteria of FRP-strengthened panels from the CNR-DT 200 (CNR Citation2013) guidelines.
Regarding the elastic stiffness and ductility of the panels, the findings of Marcari et al. (Citation2007) have been taken into account, since similar material characteristics of masonry and FRP have been considered for the present study. Therefore, the following considerations have been adopted:
A bilinear force-displacement idealization was assumed for retrofitted panels, by which the actual behaviour is idealized with a bilinear curve in such a way that the deformation energy remains unchanged (equal areas below the actual and bilinear idealized curve).
The FRP retrofitting has negligible influence the initial stiffness of the masonry panel, which means that the distribution of seismic forces on load-bearing masonry panels in a multi-storey building is not significantly modified.
Significant strength increases do not determine significant changes to the inelastic deformation capacity of strengthened panels whose ductility is substantially very similar to that of the as-built panels.
It should be noted that inelastic properties of strengthened piers depend greatly on the type of masonry and the type of FRP fibres. Usually, the post-peak behaviour of strengthened elements is less brittle than that of URM, thus dissipating a larger amount of energy and producing a larger pseudo-ductility, but, as pointed out by Marcari et al. (Citation2007), this is not always the case. For modelling purposes, it is therefore suggested, that the inelastic properties of strengthened panels are be based on experimental test data for the type of masonry and type FRP in question.
4.4. Comparative study
A comparative study based on the pushover analysis has been conducted for all examined FRP cases, representing a global criterion for evaluation. presents pushover curves together with corresponding capacity control displacements (dC) and demand control displacements (dD) for the DL and SD limit states. The values of dC and dD are also given in and were determined in the same manner as for the URM cases (Section 3.3). It can be seen from that the maximum base shear increases progressively with the amount of FRP reinforcement. As expected, the CFRP-ALL-DL and GFRP-ALL-DL cases result in the largest base shear force, which is about 80% larger than that of the URM, while for the models with FRP reinforcement only on the inner or outer piers this increase in the base shear is less profound. It is interesting to note that for the models with MCR, the maximum base shear equals to about 90% of the CFRP-ALL-DL case.
Table 5. Control displacements
Figure 9. Pushover curve comparison of analysed FRP layouts and of the URM case
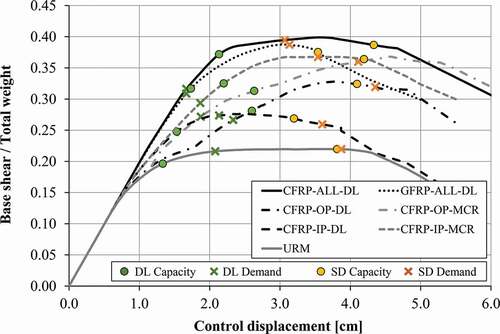
When comparing the capacity and demand control displacements, it can be observed that for the DL limit state only the CFRP-IP-DL case does not meet the code-based compliance criteria (dD ≤ dC), for which the dD is approximately 20% larger than the dC. For the SD limit state, the compliance criteria are not met for the CFRP-OP-DL and CFRP-IP-DL cases, for which the dD exceeds the dC for around 10% in both examples. For these two cases, FRP strengthening was considered only for specific sets of piers (i.e., outermost piers or innermost piers), with the horizontal FRP reinforcement ratio determined by the DL design condition. It is therefore not surprising that their seismic performance does not fully satisfy the code-based criteria, since it has been established in Section 4.1 that, for the building at hand, the DL design condition would require strengthening of all piers in the X-direction of the building. Event hough, these two cases might still present a plausible retrofitting option in situations in which the amount and layout of installed FRP are limited, for instance, due to architectural features of the façade. In contrast, by considering the MCR level of horizontal FRP reinforcement on the outermost and innermost piers (CFRP-OP-MCR and CFRP-IP-MCR cases), the global seismic response was found out to be adequate.
In , the inter-storey drift ratios are given. They have been computed as the relative lateral displacement between floors expressed as a percentage of the storey height at that floor and present an evaluation criterion on the macroelement scale. It can be observed that the inter-storey drifts of all analysed FRP cases are considerably lower than in the URM case, especially in the 1st and 2nd floor. For the DL limit demand, the inter-storey drifts do not exceed 0.20%, which is also the proposed threshold in new versions of some building codes, e.g., as reported by Marino, Cattari, and Lagomarsino (Citation2019) in the updated version of the Italian building code. For the SD limit state, the spread is larger, due to accumulation of damage. Nevertheless, for the FRP cases, the inter-storey drifts do not exceed 0.45% on the ground floor and 0.35% on the upper two floors.
Figure 10. Inter-storey drifts of analysed cases for the DL demand (PGA = 0.15 g) and SD demand (PGA = 0.25 g)
Moreover, it can be seen from that the most significant reduction in inter-storey drifts takes place on the 2nd floor. In the URM case, a greater degree of damage is expected on this floor due to the smaller levels of the vertical force in the piers and due to a reduced pier thickness in that storey. The introduction of FRP in the top floor greatly increases the piers’ lateral strength and, therefore, reduces the level of structural damage in that storey.
As a final assessment step in the comparative study, the progression of damage in individual structural members was observed. In , damage patterns for the DL and SD limit state are presented for wall assemblage Wx-1 for three selected cases: the CFRP-ALL-DL case, as well as for the two considered MCR cases. All of these cases also fulfil the code-based compliance criteria (dD ≤ dC) for both observed limit states.
Figure 11. Damage patterns of analysed FRP layouts on wall assemblage Wx-1
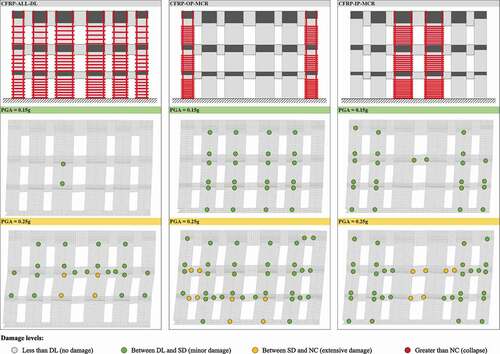
The damage patterns are represented by the formation of plastic hinges in structural elements (piers and spandrels). The thresholds in terms of element chord rotations are reported in and are associated with the achievement of reference levels of damage based on EC8-3. For unstrengthened piers and spandrels, the provisions given by Petrovčič and Kilar (Citation2013) were considered, while for FRP strengthened piers the limit values were taken based on experimental results carried out by Marcari et al. (Citation2007).
Table 6. Adopted limit values of chord rotations for piers and spandrels in terms of their failure modes
indicates that, for the DL limit state demand, the damage mostly takes place on unstrengthened piers, although some initial cracking may also take place in the strengthened piers PI-340. In the case of the SD limit state, the strengthened panels may also sustain a certain degree of damage. It is interesting to note that for the CFRP-ALL-DL case, the most significant amount of damage takes place on the 1st floor, where a storey mechanism is developing. This can also be seen in , where the inter-storey drift is largest for that case. For the MCR cases, the damage is evenly distributed through all three floors. Minor damage was recorded mostly on unstrengthened piers, while in the CFRP-OP-MCR case piers PI-340 exhibited some more extensive damage in the ground floor.
5. Cost-feasibility
When deciding for a particular retrofitting technique, the implementation of cost-effective strengthening measures is an important factor. In the case of CFRP and GFRP (which is about 50% cheaper and for this reason presented in the paper), the cost of the retrofitting intervention depends on the price of material, the cost of implementation and additional costs (façade refurbishments, etc.). In a recent risk assessment and loss estimation study conducted by Snoj and Dolšek (Citation2020), it was determined that for existing solid brick masonry buildings, the expected annual loss was estimated to 191 EUR per 100 m2 of gross floor area. Effective and economically feasible seismic retrofit measures should, therefore, be adopted in order to accommodate the inherent risks, associated with this type of building typology.
In the course of the conducted investigation, the intention was to compare the implementation price of analysed FRP layouts with the increase in earthquake resistance in order to determine which of the proposed layouts is economically more feasible. The idea was to define a comparative index that identifies the effectiveness of an FRP layout by accounting for the amount of retrofitting material used and comparing it with the difference between the corresponding seismic return periods of the initial and of the retrofitted variants. Therefore, the cost-effectiveness index for FRP reinforcement (CI) was defined as:
where κFRP denotes the FRP material factor, and cP denotes the price correction coefficient of the selected type of FRP strips, while the ER is the effectiveness ratio.
The κFRP indicates the amount of FRP material of the retrofit system that has been used per unit of the total gross floor area of the building (Atot). For the present case, FRP strips with a constant ply thickness and width have been used. Consequently, the κFRP can be expressed in terms of the total length of the FRP strips (LFRP) and equals to κFRP = LFRP/Atot, where Atot = 952 m2.
The cP, in contrast, is used to account for the price differentiation when comparing multiple types of FRP. It has been assumed that CFRP has a cP equal to 1.00, while other FRP materials have a cP proportional their cost compared to CFRP. Based on the retrofit cost comparison for various materials presented by Burgoyne and Balafas (Citation2007), the cP equal to 0.52 has been considered for GFRP.
It should be noted that that long-term effects also present an important factor when designing FRP systems and that their mechanical properties are prone to degrading based on ageing conditions. In recent years many studies have been conducted in order to better evaluate the durability of the applied system based on based on ageing conditions (e.g. Frigione and Lettieri Citation2018; Maljaee et al. Citation2016; Zhou, Büyüköztürk, and Lau Citation2017). In order to account for these effects the environmental conversion factor ηa for external exposure conditions and epoxy resin (ηa = 0.85 for CFRP and ηa = 0.65 for GFRP) has been considered when calculating the maximum tensile strain εfd as proposed by the CNR guidelines (CNR Citation2013).
The ER presents a measure of the effectiveness of a selected FRP layout in terms of the increase in the global seismic resistance of the studied building for a selected limit state. For each limit state, the ER is expressed as the ratio between the increase in the seismic return period corresponding the retrofitted variant of the building (ΔTR), divided by the seismic return period of the initial (unstrengthened) building (TR,init):
The ΔTR equals to TR,retro — TR,init, where TR,retro is the seismic return period in which the retrofitted building would reach the selected limit state (in the present case, DL or SD).
The values for the TR (TR,init and TR,retro) can be obtained by considering the site hazard curve in terms of the PGA expressed as a function of TR, involving a two-stepped process. In the first step, an incremental static analysis (ISA) needs to be performed on the model of the initial and on the model of the retrofitted structure in order to evaluate the nonlinear displacement demand that would cause the attainment of the observed limit state. The PGA needs to be selected as the intensity measure for the ISA and increased incrementally until the target limit state is reached. In the second step, the corresponding TR is then determined from the site hazard curve by considering the observed PGA.
In , the results of the ISA for each of the analysed cases are reported based on the hazard curve of the site of the building. For each model the PGA and corresponding TR is given for when the DL or SD limit state of a model was reached. The calculated CI-s and their calculation parameters are indicated in .
Table 7. PGA and TR of analysed variants
Table 8. Calculation of the CI for two considered limit states
A low CI indicates that a small amount of applied FRP material is required to increase the seismic resistance of the building, which is reflected in the TR. A large value of the CI, in contrast, implies that a large amount of FRP material was applied, but its effect on the overall seismic resistance of the building was very small. Such FRP layouts are, therefore, uneconomical, while the ones with a lower CI present a more viable option for further consideration.
In terms of the present cases, it can be seen from that the MCR cases are the most effective, since they result in a low CI for both limit states. The CFRP-OP-MCR has the lowest value of CI of all analysed cases for both limit states and equals to 0.19 for DL and 0.30 for SD. The largest CI was observed for the CFRP-IP-DL, where it equals to 1.49 for DL and 1.29 for SD.
Even though the largest amount of material is needed for the CFRP- and GFRP-ALL-DL cases, the CI index for the CFRP case is quite low and equals 0.41 for DL and 0.48 for DL. This means that the CFRP-ALL-DL case is also a good retrofit option, since a higher retrofit price also leads to significant improvements in the seismic resistance. This can also be seen from , in which the TR is largest for the CFRP-ALL-DL case for both limit states. It can also be seen that the CFRP-IP-DL and CFRP-OP-DL do not meet the code-based requirements, as was already concluded by observing the results in .
Figure 12. Retrofit cost vs. the property value ratio and CI of analysed variants
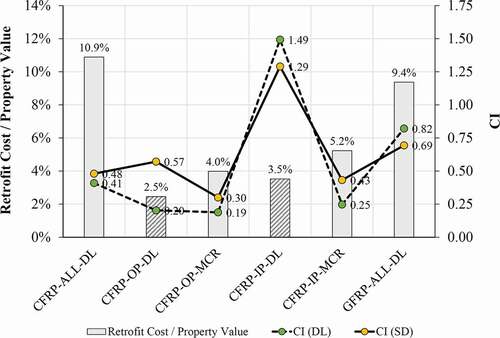
Based on available real-estate market records (GURS Citation2020) for similar buildings in the historic city centre of Ljubljana, Slovenia (assumed location of the building), a total property value equal to 2,750,000 EUR was considered, which is roughly 2900 EUR/m2. Furthermore, it has been assumed that the gross cost of FRP strengthening including installation costs equals to 240 EUR/m for CFRP and 170 EUR/m for GFRP. On the basis of these data, the ratio between the FRP retrofit cost and the property value was calculated and is presented in . It can be seen from the figure that the FRP retrofit cost amounts to roughly 11% of the property value in the cases where the largest amount of FRP is used (cases CFRP- and GFRP-ALL-DL). When applying FRP only to selected piers, this ratio is halved and more and equals to around 4%-5% for the MCR cases.
also includes the CI of each analysed FRP case. In this manner, the economic feasibility of a certain case can be directly established. Cases with the smallest retrofit cost and CI are the most appropriate. It should be noted that the cases CFRP-OP-DL and CFRP-IP-DL do not result in an appropriate level of seismic protection (code requirements are not met) and are therefore not relevant. It can, therefore, be concluded that the MCR cases are economically most viable.
6. Conclusions
This paper analyses the effectiveness of externally bonded fibre-reinforced polymer (FRP) retrofitting systems on the global seismic response of multi storey historic unreinforced masonry (URM) pier-type buildings. A numerical case study comparison was presented in which a three storey neo-renaissance building structure is retrofitted with various layouts of FRP laminates, considering different reinforcement ratios and positions of FRP strips on selected piers. One of the aims of the study was to identify the most appropriate distribution of FRP laminates that is not only effective in terms of seismic strengthening, but also financially feasible and compliant with historic conservation guidelines.
The first part of the paper introduces a new FRP design procedure that eases the decision which structural elements should be retrofitted and what amount (reinforcement ratio) of FRP strips should be used. The procedure is based on the condition set out in EC8-3, stating that the global seismic response of the retrofitted structure remains nominally elastic for the Damage Limitation (DL) limit state. By conducting a pushover analysis on an elastic model of the URM structure, the required target control displacement (dD) for the DL limit state is calculated using the N2 method. When the elastic system reaches dD shear forces (VEd,DL) in masonry, the piers are compared with their initial lateral strength (VURM). In the cases in which VEd,DL is larger than VURM seismic strengthening is required (DL design condition).
The second part of the paper analyses six different FRP retrofitting layouts for the analysed building. Alongside two initial cases (one for CFRP and one for GFRP), where FRP reinforcement was applied to all the piers that require strengthening (ALL-DL), we have also followed the idea to be more economical and to strengthen only two inner piers (IP) or only two outer piers (OP). In the latter cases we used the maximum credible reinforcement (MCR) which gave us two additional examined cases. A comparative study was conducted for all examined FRP cases based on the pushover analysis, representing a global criterion for evaluation. On the macroelement scale, inter-storey drift ratios were compared. Additionally, the progression of damage in individual structural members was also observed, by investigating the formation of damage patterns in the form of plastic hinges. The following general conclusions can be drawn:
The ALL-DL cases provided sufficient seismic safety that fulfilled the code-based requirements. Additionally, it has been shown that the use of GFRP is to a certain extent less effective, but economically still competitive.
It is financially and practically much more effective when FRP strengthening is limited only to outer piers or only to inner piers of a wall assemblage. For the examined building, the study concluded that these layouts meet the code-based requirements when the MCR level of reinforcement is applied.
From an earthquake engineering standpoint, the retrofitting should first be implemented to wider (stiffer) piers so that their increase in strength and ductility could accommodate larger seismic shear forces. The study has shown that this case actually gives good results in terms of damage limitation and inter-storey drift ratios and is also economically feasible.
In the conducted cost feasibility study, the calculated retrofit cost of analysed cases amounted to a maximum of 10.9% of the property value (CFRP-ALL-DL case). This is a relatively reasonable cost, considering the structure’s seismic resistance would drastically improve. Nevertheless, in order to further reduce the cost of retrofitting with FRP and to gain greater compliance with conservational guidelines, a combination with other strengthening measures should also be considered.
Acknowledgments
The research presented in this paper was conducted in the scope of the research programme “Sustainable planning for the quality living space” (programme head V. Kilar) and is funded by the Slovenian Research Agency (ARRS) under grant P5-0068. This support is gratefully acknowledged.
Disclosure statement
No potential conflict of interest was reported by the authors.
Additional information
Funding
References
- ACI Committee. 2010. 440. ACI 440.7 R-10 guide for the design and construction of externally bonded fiber-reinforced polymer systems for strengthening unreinforced masonry structures.
- Belmouden, Y., and P. Lestuzzi. 2009. An equivalent frame model for seismic analysis of masonry and reinforced concrete buildings. Construction and Building Materials 23 (1):40–53. doi:https://doi.org/10.1016/j.conbuildmat.2007.10.023.
- Beyer, K. 2012. Peak and residual strengths of brick masonry spandrels. Engineering Structures 41:533–47. doi:https://doi.org/10.1016/j.engstruct.2012.03.015.
- Borri, A., and M. Corradi. 2019. Architectural heritage: A discussion on conservation and safety. Heritage 2 (1):631–47. doi:https://doi.org/10.3390/heritage2010041.
- Borri, A., M. Corradi, and A. Vignoli. 2001. Seismic upgrading of masonry structures with FRP. 7th International Conference on inspection appraisal repairs and maintenance of buildings and structures, Notthingam Trent University, Nottingham, United Kingdom, 43–54.
- Bosiljkov, V., A. W. Page, V. Bokan‐Bosiljkov, and R. Žarnić. 2010. Evaluation of the seismic performance of brick masonry walls. Structural Control and Health Monitoring 17 (1):100–18. doi:https://doi.org/10.1002/stc.299.
- Burgoyne, C., and I. Balafas. 2007. Why is FRP not a financial success. Proc. 8th Intl. Conf. on FRP Reinforcement for Reinforced Concrete Structures, FRPRCS-8, Univ. of Patras, Patras, Greece.
- Calderini, C., S. Cattari, and S. Lagomarsino. 2009. In‐plane strength of unreinforced masonry piers. Earthquake Engineering & Structural Dynamics 38 (2):243–67. doi:https://doi.org/10.1002/eqe.860.
- Cascardi, A., R. Dell’Anna, F. Micelli, F. Lionetto, M. A. Aiello, and A. Maffezzoli. 2019a. Reversible techniques for FRP-confinement of masonry columns. Construction and Building Materials 225:415–28. doi:https://doi.org/10.1016/j.conbuildmat.2019.07.124.
- Cascardi, A., M. Lerna, F. Micelli, and M. A. Aiello. 2019b. Discontinuous FRP-confinement of masonry columns. Frontiers in Built Environment 5:147. doi:https://doi.org/10.3389/fbuil.2019.00147.
- Castori, G., M. Corradi, A. Borri, R. Sisti, and A. De Maria. 2019. Macro element and dynamic seismic analysis of the medieval government building of Perugia, Italy. International Journal of Masonry Research and Innovation 4 (4):297–311.
- Cattari, S., S. Lagomarsino, A. Karatzetzou, and D. Pitilakis. 2015. Vulnerability assessment of Hassan Bey’s mansion in Rhodes. Bulletin of Earthquake Engineering 13 (1):347–68. doi:https://doi.org/10.1007/s10518-014-9613-1.
- CEN. 2005a. Eurocode 6: Design of masonry structures - Part 1-1: General rules for reinforced and unreinforced masonry structures. Brussels, Belgium: European Committee for Standardisation.
- CEN. 2005b. Eurocode 8: Design of structures for earthquake resistance - part 1: General rules, seismic actions and rules for buildings, design code EN 1998-1. Brussels, Belgium: European Committee for Standardisation.
- CEN. 2005c. Eurocode 8: Design of structures for earthquake resistance – part 3: General rules, seismic actions and rules for buildings, design code EN 1998-3. Brussels, Belgium: European Committee for Standardisation.
- CNR-DT 200 R1/2013. 2013. Guide for the design and construction of externally bonded FRP systems for strengthening existing structures. Advisory Committee on Technical Recommendations for Construction (CNR), Rome.
- Corradi, M., A. Grazini, and A. Borri. 2007. Confinement of brick masonry columns with CFRP materials. Composites Science and Technology 67 (9):1772–83. doi:https://doi.org/10.1016/j.compscitech.2006.11.002.
- Croci, G., D. D’Ayala, P. D’Asdia, and F. Palombini. 1987. Analysis on shear walls reinforced with fibers. IABSE Symp. On safety and quality assurance of Civ. Engrg. Struct., Int. Assoc. For Bridge and Struct., Lisbon, Portugal.
- CSI. 2019. SAP2000 Ultimate 64-bit (v21.0.1) – Structural analysis program. Berkeley: Computer & Structures, Inc.
- Di Ludovico, M., C. D’Ambra, A. Prota, and G. Manfredi. 2010. FRP confinement of tuff and clay brick columns: Experimental study and assessment of analytical models. Journal of Composites for Construction 14 (5):583–96. doi:https://doi.org/10.1061/(ASCE)CC.1943-5614.0000113.
- Di Ludovico, M., A. Prota, C. Moroni, G. Manfredi, and M. Dolce. 2017. Reconstruction process of damaged residential buildings outside historical centres after the L’Aquila earthquake: Part I—”light damage” reconstruction. Bulletin of Earthquake Engineering 15 (2):667–92. doi:https://doi.org/10.1007/s10518-016-9877-8.
- Doherty, K., M. C. Griffith, N. Lam, and J. Wilson. 2002. Displacement‐based seismic analysis for out‐of‐plane bending of unreinforced masonry walls. Earthquake Engineering & Structural Dynamics 31 (4):833–50. doi:https://doi.org/10.1002/eqe.126.
- Elnashai, A. S., and L. Di Sarno. 2008. Fundamentals of earthquake engineering. New York: Wiley.
- Emami, M., M. R. Eftekhar, and H. Karimizadeh. 2020. Experimental study on postponing the deboning of FRP sheets in masonry walls. International Journal of Architectural Heritage 14 (2):314–27. doi:https://doi.org/10.1080/15583058.2018.1542465.
- Fajfar, P. 2000. A nonlinear analysis method for performance-based seismic design. Earthquake Spectra 16 (3):573–92. doi:https://doi.org/10.1193/1.1586128.
- Frigione, M., and M. Lettieri. 2018. Durability issues and challenges for material advancements in FRP employed in the construction industry. Polymers 10 (3):247. doi:https://doi.org/10.3390/polym10030247.
- Gattulli, V., G. Lampis, G. Marcari, and A. Paolone. 2014. Simulations of FRP reinforcement in masonry panels and application to a historic facade. Engineering Structures 75:604–18. doi:https://doi.org/10.1016/j.engstruct.2014.06.023.
- Gattulli, V., E. Lofrano, A. Paolone, and G. Pirolli. 2017. Performances of FRP reinforcements on masonry buildings evaluated by fragility curves. Computers & Structures 190:150–61. doi:https://doi.org/10.1016/j.compstruc.2017.05.012.
- Grande, E., M. Imbimbo, and E. Sacco. 2011. A beam finite element for nonlinear analysis of masonry elements with or without Fiber-Reinforced Plastic (FRP) reinforcements. International Journal of Architectural Heritage 5 (6):693–716. doi:https://doi.org/10.1080/15583058.2010.490616.
- GURS. Surveying and mapping authority of the Republic of Slovenia, portal E-prostor. Accessed January 8, 2020. https://www.e-prostor.gov.si/access-to-geodetic-data.
- Ismail, N., and J. M. Ingham. 2016. In-plane and out-of-plane testing of unreinforced masonry walls strengthened using polymer textile reinforced mortar. Engineering Structures 118:167–77. doi:https://doi.org/10.1016/j.engstruct.2016.03.041.
- Jarc Simonič, M., S. Gostič, V. Bosiljkov, and R. Žarnić. 2015. In-situ and laboratory tests of old brick masonry strengthened with FRP in innovative configurations and design considerations. Bulletin of Earthquake Engineering 13 (1):257–78. doi:https://doi.org/10.1007/s10518-014-9644-7.
- Jorquera, N., J. Vargas, M. D. L. L. Lobos Martínez, and D. Cortez. 2017. Revealing earthquake-resistant geometrical features in heritage masonry architecture in Santiago, Chile. International Journal of Architectural Heritage 11 (4):519–38. doi:https://doi.org/10.1080/15583058.2016.1266414.
- Kappos, A. J., and V. K. Papanikolaou. 2016. Nonlinear dynamic analysis of masonry buildings and definition of seismic damage states. The Open Construction & Building Technology Journal 10 (1):192–209. doi:https://doi.org/10.2174/1874836801610010192.
- Lagomarsino, S., and S. Cattari. 2015. PERPETUATE guidelines for seismic performance-based assessment of cultural heritage masonry structures. Bulletin of Earthquake Engineering 13 (1):13–47.
- Liberatore, D., G. Beolchini, L. Binda, L. Gambarotta, and G. Magenes. 1999. Valutazione della risposta sismica del costruito in muratura del Comune di Catania. L’Ingegneria Sismica in Italia; proc. of the 9 th national ANIDIS conference, Turin, Italy.
- Liberatore, D., G. Spera, and D. Palermo. 2000. Seismic response of typical masonry buildings in the Comune of Catania. Proc. of the twelfth world conference on earthquake engineering, Auckland, New Zealand.
- Lignola, G. P., L. Di Sarno, M. Di Ludovico, and A. Prota. 2016. The protection of artistic assets through the base isolation of historical buildings: A novel uplifting technology. Materials and Structures 49 (10):4247–63. doi:https://doi.org/10.1617/s11527-015-0785-1.
- Magenes, G., and G. M. Calvi. 1997. In‐plane seismic response of brick masonry walls. Earthquake Engineering & Structural Dynamics 26 (11):1091–112. doi:https://doi.org/10.1002/(SICI)1096-9845(199711)26:11<1091::AID-EQE693>3.0.CO;2-6.
- Magenes, G., and A. D. Fontana. 1998. Simplified non-linear seismic analysis of masonry buildings. Proc. Br. Masonry Soc. No. 8, London, UK, October, 190–95.
- Maljaee, H., B. Ghiassi, P. B. Lourenço, and D. V. Oliveira. 2016. FRP–brick masonry bond degradation under hygrothermal conditions. Composite Structures 147:143–54. doi:https://doi.org/10.1016/j.compstruct.2016.03.037.
- Marcari, G., G. Manfredi, A. Prota, and M. Pecce. 2007. In-plane shear performance of masonry panels strengthened with FRP. Composites Part B: Engineering 38 (7–8):887–901. doi:https://doi.org/10.1016/j.compositesb.2006.11.004.
- Marino, S., S. Cattari, and S. Lagomarsino. 2019. Are the nonlinear static procedures feasible for the seismic assessment of irregular existing masonry buildings? Engineering Structures 200:109700. doi:https://doi.org/10.1016/j.engstruct.2019.109700.
- Martinelli, E., F. Perri, C. Sguazzo, and C. Faella. 2016. Cyclic shear-compression tests on masonry walls strengthened with alternative configurations of CFRP strips. Bulletin of Earthquake Engineering 14 (6):1695–720. doi:https://doi.org/10.1007/s10518-016-9895-6.
- Micelli, F., and A. Cascardi. 2020. Structural assessment and seismic analysis of a 14th century masonry tower. Engineering Failure Analysis 107:104198. doi:https://doi.org/10.1016/j.engfailanal.2019.104198.
- Micelli, F., A. Cascardi, and M. Marsano. 2016. Seismic strengthening of a theatre masonry building by using active FRP wires. Brick and Block Masonry: Proceedings of the 16th International Brick and Block Masonry Conference, Padova, Italy, June, 753–61.
- Parisi, F., and N. Augenti. 2013. Seismic capacity of irregular unreinforced masonry walls with openings. Earthquake Engineering & Structural Dynamics 42 (1):101–21. doi:https://doi.org/10.1002/eqe.2195.
- Petrovčič, S., and V. Kilar. 2013. Seismic failure mode interaction for the equivalent frame modeling of unreinforced masonry structures. Engineering Structures 54:9–22. doi:https://doi.org/10.1016/j.engstruct.2013.03.050.
- Petrovčič, S., and V. Kilar. 2017. Seismic retrofitting of historic masonry structures with the use of base isolation—modeling and analysis aspects. International Journal of Architectural Heritage 11 (2):229–46. doi:https://doi.org/10.1080/15583058.2016.1190881.
- Prota, A., G. Manfredi, and F. Nardone. 2008. Assessment of design formulas for in-plane FRP strengthening of masonry walls. Journal of Composites for Construction 12 (6):643–49. doi:https://doi.org/10.1061/(ASCE)1090-0268(2008)12:6(643).
- Rahman, A., and T. Ueda. 2016. In-plane shear performance of masonry walls after strengthening by two different FRPs. Journal of Composites for Construction 20 (5):04016019. doi:https://doi.org/10.1061/(ASCE)CC.1943-5614.0000661.
- Saleem, M. U., M. Numada, M. N. Amin, and K. Meguro. 2016. Shake table tests on FRP retrofitted masonry building models. Journal of Composites for Construction 20 (5):04016031. doi:https://doi.org/10.1061/(ASCE)CC.1943-5614.0000684.
- Snoj, J., and M. Dolšek. 2020. Pushover‐based seismic risk assessment and loss estimation of masonry buildings. Earthquake Engineering & Structural Dynamics 49:567–88. doi:https://doi.org/10.1002/eqe.3254.
- Triantafillou, T. C. 1998. Strengthening of masonry structures using epoxy-bonded FRP laminates. Journal of Composites for Construction 2 (2):96–104. doi:https://doi.org/10.1061/(ASCE)1090-0268(1998)2:2(96).
- Turnšek, V., and F. Čačovič. 1971. Some experimental results on the strength of brick masonry walls. Proc. of the 2nd International Brick Masonry Conference, Stoke-on-Trent, UK, 149–56.
- Unuk, Ž., M. Premrov, and V. Žegarac Leskovar. 2019. Development of an innovative approach for the renovation of timber floors with the application of CLT panels and structural glass strips. International Journal of Architectural Heritage 1–17. doi:https://doi.org/10.1080/15583058.2019.1637479.
- Valluzzi, M. R., C. Modena, and G. de Felice. 2014. Current practice and open issues in strengthening historical buildings with composites. Materials and Structures 47 (12):1971–85. doi:https://doi.org/10.1617/s11527-014-0359-7.
- Valluzzi, M. R., D. Tinazzi, and C. Modena. 2002. Shear behavior of masonry panels strengthened by FRP laminates. Construction and Building Materials 16 (7):409–16. doi:https://doi.org/10.1016/S0950-0618(02)00043-0.
- Zhou, A., O. Büyüköztürk, and D. Lau. 2017. Debonding of concrete-epoxy interface under the coupled effect of moisture and sustained load. Cement and Concrete Composites 80:287–97. doi:https://doi.org/10.1016/j.cemconcomp.2017.03.019.