
ABSTRACT
The development of Portland cement and concrete in the 19th and 20th centuries revolutionised the construction industry, and provided a means of achieving architectural and structural feats that were previously impossible. While reinforced concrete bridges provided a means of simultaneously spanning vast distances and carrying significant loads, the material was little understood and designs reflected this. As a result, many early reinforced concrete structures suffer from significant durability issues and there is a growing requirement for their maintenance and repair, but the extent of the issue is unclear. As such, this review of historic test data intends to provide insight into previous reinforced concrete bridge design in Scotland, compare their design to current engineering codes, and discuss the implications for maintaining and preserving these unique examples of architectural heritage.
1. Introduction
Reinforced concrete bridges are a critical and essential part of civil infrastructure throughout the world. However, many of these structures were designed and built in the late 19th and early 20th centuries, when the material was relatively new and little understood, and there were little or no standard design criteria. As a result, many of these bridges are also at risk to a variety of durability issues. While the maintenance and repair of reinforced concrete structures have been an ever-growing source of concern to the engineering community, the devastating collapse of the Morandi Bridge, Italy in 2018 highlighted the issue on a global scale and reinforced the need for routine monitoring.
In Scotland, many early concrete bridges are considered to be unique examples of architectural heritage and, therefore, should be preserved where possible. Urquhart (Citation2020) has identified 69 concrete bridges in Scotland built between 1880 and 1950, of which, 48% have been designated as listed buildings by Historic Environment Scotland. Of these 69 bridges, 51 are road bridges, 73% of which are in mainland Scotland north of the Highland fault line. While none of these bridges are prestressed concrete, many do contain precast elements, such as beams, parapet walls, copes and facings (Urquhart Citation2020).
While the durability of modern reinforced concrete structures is well understood and considered at the design stage, with national standards specifying design requirements which concrete structures must satisfy to ensure the durability of the concrete in specific environments and for an intended service life, this has not always been the case. As such, the design and materials used in historic reinforced concrete bridges varies from structure to structure, and it is not clear how they are likely to have deteriorated and what risks they face as a result.
In order to better understand the historic changes that have occurred in the design and construction of concrete bridges, and to assist in making future predictions regarding the deterioration of early reinforced concrete bridges, a review of pre-existing test data was carried out. It should be stressed that the data deriving from these reports do not represent a ‘snapshot’ of the current status of infrastructure, since the test data is itself historical, and it is likely that, where performance was found wanting, remedial action has been taken. However, it does provide insight into the sort of issues that have required addressing in the maintenance of such structures.
2. Methodology
Pre-existing reports for 36 bridges in Scotland, built prior to 1950 were reviewed — accounting for 70% of the recorded reinforced concrete road bridges built in Scotland during this period. These reports, originally written in the 1980s and 1990s, included both laboratory and in-situ data. A summary of the information and test data relating to the bridges can be found in .
Table 1. Summary of data for each bridge.
Tests data for 119 concrete cores included visual analyses, the degree of carbonation, chloride contents at different depths, chemical analyses, compressive strength and density at various saturation states. Additional data included the results from covermeter surveys, carbonation depth and half-cell potential measurements. The results of all of these tests, which were previously carried out by independent contractors, were collated and analysed in order to establish a greater understanding of early reinforced concrete structures, and the scale of durability issues they face. These results were also compared with modern design codes, in order to present them in context with the current understanding of concrete durability and the related design criteria.
Compressive strength, hardened density and chemical analyses were determined in laboratories in accordance with BS 1881–120 (BSI Citation1983a), BS 1181–114 (BSI Citation1983b) & BS 1181–124 (BSI Citation1988a), and BS 4551 (BSI Citation1980) respectively. Cover to reinforcement, carbonation depth from powdered drillings, chloride content and half-cell potential were carried out in accordance with BS 1884–204 (BSI Citation1988b), BRE IP 6/81 (BRE Citation1981), BS 1881–124 (BSI Citation1988a), and ASTM C876 (ASTM International Citation1980, Citation1987), respectively.
Where the possibility of a correlation between a measured characteristic and the year of construction or another characteristic, the significance of the correlation was evaluated using the P-value from a statistical F-test conducted on the data. A cut-off criteria of 0.10 was selected as an indicator of significance, on the basis that the data derived from several laboratories and involved measurements with the potential for statistical irregularity.
3. Results and discussion
3.1. Format of test reports
The general format of the test reports was inconsistent between the different testing houses, with each one carrying out slightly different tests and sometimes working to different standards for the same tests. For example, in some cases, chemical analysis was carried out following BS 1181–124 (BSI Citation1988a) ‘Testing concrete. Methods for analysis of hardened concrete’ and in others BS 4551 (BSI Citation1980) ‘Methods of testing mortars, screeds and plasters’ was used. In either case, neither of these standards are appropriate as they cannot be used to accurately assess concrete which is physically damaged or chemically altered by exposure to the environment. Furthermore, the calculations used in these standards require certain assumptions to be made about the initial chemical composition of the cement and these are based on the typical soluble silica and calcium oxide contents of Portland cement contemporary to the time of publication — not of the actual Portland cement being analysed. This is significant since the calcium content of Portland cement increased considerably over the first half of the 20th century (Halstead Citation1961).
Another inconsistency in the test reports was the reporting of density, which was usually measured in the ‘saturated’ state (109 recorded), but with some ‘as-received’ (63) and ‘oven-dried’ (10) densities also recorded. Ideally, the reports would contain a measurement of both oven-dried and saturated density. However, it is understandable that oven-dried density was the least recorded, particularly when dealing with limited sample size, as oven-drying should not be undertaken on samples which need to be tested to determine their compressive strength or chemical composition. The use of as-received density is itself, not a particularly useful metric for assessing hardened concrete as it is a value which varies with the saturation level of the concrete and inevitably changes depending on the original moisture conditions of the concrete, the method of sample removal, storage conditions after removal and the time between removal and testing. This is particularly true of concrete cores, as removing these requires a coring rig which applies a steady flow of up to ten litres of water per 100 mm diameter core to prevent the barrel from jamming due to overheating and to remove debris (Baker Citation1992).
While aggregate is an essential constituent of concrete and has a significant impact on its physical properties, there is very little in terms of aggregate data. Of the 119 samples tested, only 37 had even a recorded maximum aggregate size. Even fewer (18) had cement-to-aggregate proportions and, of these, only six had proportions of cement to fine and coarse aggregate — the other 12 reports contained only a cement to total aggregate ratio.
With regards to the in-situ testing, there was often not enough information to establish the locations of each test and make direct correlations between the results. In order to account for this and to accommodate the vast number of readings for each bridge, the results were viewed from a more general point of view. Instead of focussing on the results for a specific element of the bridge, the results recorded were either an average of all the results (half-cell potential), a maximum ‘worst case’ observed (carbonation depth and chloride content), or a range of maximum and minimum results (cover to reinforcement).
3.2. Assessment of concrete cores
3.2.1. Cement content
Cement content was reported for a total of 37 samples which originated from 15 of the bridges on which there were test reports. Across all samples, maximum cement content (% by mass) was 18.1% and the minimum 9.5%. The largest range between samples from a single structure was 9.5–16.3%.
plots the cement contents versus construction year, indicating no relationship. Whilst the cement contents were reported as a percentage of volume, an estimate of the cement contents in kg/m3 was calculated for the 32 of the 37 samples which also had saturated densities recorded, in order to compare them to modern (BS 1992-1-1) design requirements (). However, it should be noted that the cement contents reported, both as a percentage and mass per unit volume, are really cement matrix contents as the cement has hydrated and carbonated, causing a change in both mass and volume from the original specified anhydrous cement content.
Figure 1. Summary of cement contents of concrete samples by construction year.
Figure 2. Estimated cement contents of concrete samples by construction year and standard limit based on BS 8500–1 (BSI Citation2016a) requirements.
3.2.2. Estimated cube strength
Estimated cube strengths were reported for 113 samples taken from 34 of the 36 structures, having been calculated from compressive strength tests on concrete cores removed from the structures. In some reports, both core strength and estimated cube strength were reported, but in many cases, only the estimated cube strength was reported. When all results were converted to estimated cube strength, the results ranged from a minimum of 16 N/mm2, which is notably low for structural concrete, to a maximum of 81 N/mm2, which would be considered very high strength. The mean result was 41.1 N/mm2 and the median 38.0 N/mm2.
The location from which samples were taken varied from bridge to bridge. Of the 113 samples, 62 were taken from soffits, 32 from the top or edge of decks, 15 from beams, 2 from abutments and 2 from parapets. The average strengths for soffits, decks and beams were 40.3 N/mm2, 47.5 N/mm2 and 30.6 N/mm2, respectively. However, the lack of standardised methodology with regards to sample location and quantity, and the subsequent distribution of test results across these structures (), make it difficult to identify any significant relationships between specific types of elements and compressive strength. Based on the result shown in , it seems that the compressive strength varies more on a structure-to-structure basis than by element type.
Figure 3. Estimated cube strengths based on compressive strength tests on cores from each bridge and current standard limits based on BS 8500–1 (BSI Citation2016a) requirements for bridges.
Even within a structure, there is significant variation between results from tests on different areas of the same structure — for example, bridge no. 8 has results from the deck ranging from 35.5–67.0 N/mm2, and no. 26 has results from the soffit which, while all above the minimum requirements, have a significant range from 53.5–81 N/mm2. While the reasons for this variation in strength is unclear, it is possibly a result of issues relating to onsite batching and poor workmanship. For example, a lack of quality control in batch preparation, the addition of excess water to ease workability, or a lack of adequate compaction.
While the maximum aggregate size was not reported for every core it was for 37 of the 113 cores on which compressive strength was tested. When the relationship between maximum aggregate size and compressive strength was examined (), it became clear that as the maximum aggregate size increased (for results above 20 mm), the compressive strength also increased. This increase in strength is contrary to the relationship between the maximum aggregate size and compressive strength established by other authors (Higginson, Wallace, and Ore Citation1963; Walker and Bloem Citation1960; Walker, Bloem, and Gaynor Citation1959).
Figure 4. Relationship between maximum aggregate and estimated cube strength.
While the lack of original mix design and w/c data make it difficult to determine exactly why this trend is shown (), it most likely related to the size of cores taken for compressive strength tests. While BS EN 12504–1 ‘Testing concrete in structures. Part 1: Cored Specimens’ (BSI Citation2009) does not specify the diameter of cores in relation to maximum aggregate size, it does state that:
The ratio of the maximum aggregate size in the concrete to the diameter of the core has a significant influence on the measured strength when it approaches values greater than about 1:3.
Furthermore, the ASTM standard for obtaining and testing drilled concrete cores (ASTM Citation2018) requires the core to be at least two times the maximum aggregate size for compressive strength tests, and current recommendations for cast concrete cylinders are that they should have a diameter of at least three and a half times that of the maximum aggregate size (BSI Citation2012) to accurately asses them. In all reported cases, the size of the cores taken were 100 mm in diameter. As such, the actual compressive strength of the concrete is possibly being over-estimated for cores with an aggregate size greater than ≈ 30 mm, however, due to the lack of original mix design and w/c data, it is not possible to determine this for certain.
While there is an increase in the maximum estimated cube strength with production year (), it is not statistically significant. This, coupled with the uneven distribution of the samples with respect to the year of completion and the variations in original requirements makes it difficult to draw any conclusions on changes to the average strength of concrete with respect to time.
Figure 5. Summary of estimated cube strengths of concrete samples by construction year and current standard limits based on BS 8500–1 (BSI Citation2016a) requirements for bridges.
This is not entirely unexpected: whilst the strength attainable with Portland cement at a given water/cement (w/c) ratio increased over the 20th century (Nixon Citation1988), the ability to control the strength of a concrete mix is fundamental to its flexibility as a construction material. Thus, a wide spread of strengths regardless of construction year is a reasonable expectation. Since control of strength is achieved through the modification of the w/c, and since this, in turn, is normally achieved by altering the cement content rather than the water content, a correlation between strength and cement content could be expected. Whilst there does seem to be a general trend of increasing compressive strength with increasing cement content (), the relationship is not statistically significant.
Figure 6. Estimated cube strengths of concrete samples versus cement content.
3.2.3. Saturated density
Saturated density was reported for 109 samples from 32 bridges. The maximum was 2530 kg/m3 and the minimum 2210 kg/m3, with a mean of 2374 kg/m3 and a median of 2380 kg/m3. The saturated density versus construction year is shown in , with no correlation evident. Generally, the lowest strength samples also had a relatively low density () — the relationship is statistically significant. However, this was not always the case. For example, one of the most dense samples (2550 kg/m3) also had one of the lowest strengths (22 N/mm2), and the description of the core states its condition as ‘good’, with only 0.5% voids and even distribution of the aggregate.
Figure 7. Summary of saturated densities of concrete samples by year.
Figure 8. Summary of estimated cube strengths of concrete samples by saturated density.
3.2.4. Maximum aggregate size
One interesting trend, which can be clearly observed in , is the sudden change in maximum aggregate size after 1932. Of the 37 samples analysed, all 15 of the samples that date from after 1932 — which came from 7 different structures — had a maximum aggregate size of 20 mm, and this perhaps signifies a change in design practice which limited the maximum size of aggregate. In particular, this change coincides with the release of the first edition of Reynolds’ ‘Reinforced Concrete Designers’ Handbook’ (Reynolds Citation1932). While Reynolds’ handbook was not a building code, it did specify recommendations for the grading of aggregate for various types of concrete. Reynolds suggested that, for ordinary building work, the fine aggregate should be graded from ‘dust’ to ¼ in. (6.35 mm) particles, and the coarse aggregate from ¼ in. to ¾ in. (19.0 mm) particles — with permissible coarse aggregate sizes of 1½ in. (38.1 mm) or 2 in. (50.8 mm) for mass concrete works.
Figure 9. Summary of maximum aggregate size by year.
In all the cores from bridges built prior to 1932 — of which there were 22 samples from 4 different structures — the maximum aggregate size was extremely variable, with the largest maximum aggregate size being 75 mm, the smallest being 25 mm, and the mean being 45 mm. In the modern construction practice in United Kingdom, the maximum aggregate size for structural concrete is usually 25 mm or 40 mm as it has to be at least 5 mm smaller than the horizontal reinforcing bar spacing and at least 2/3 smaller than the vertical bar spacing (Neville and Brooks Citation2010) in order to be evenly distributed through the hardened concrete. Although in his 1932 book, Reynolds does not cite the need for aggregate to pass reinforcement as a reason for the suggested limit, writing later in ‘Practical Reinforced Concrete Design’ (Reynolds Citation1938), he references the by-laws for the construction and conversion of reinforced concrete buildings in the ‘The London Building (Amendment) Act, 1935’, which restricted the size of coarse aggregate to at least ¼ in. (6.35 mm) less than the minimum lateral distance between reinforcing bars. Thus, it seems likely that he was aware of this issue in 1932.
Aggregate of the size found in these bridges has the potential to have a detrimental effect on concrete, since the larger the aggregate particle, the larger the interfacial transition zone (ITZ) between the cement paste and the aggregate surface. The ITZ is an area in which the ‘wall effect’ alters the way in which cement particle packing occurs against aggregate surfaces and results in a region of high porosity (Scrivener, Crumbie, and Laugesen Citation2004). This ITZ becomes increasingly porous as the aggregate size increases (Basheer, Basheer, and Long Citation2005), resulting in localised weakness and highly permeable regions in hardened concrete, which can lead to a reduction in strength.
3.3. Summary of core tests results
A statistical analysis of the core test results is presented in . From the data reviewed, there seems to be no correlation between the year in which the structure was built and parameters such as cement content, compressive strength and density.
Table 2. Summary of key laboratory findings.
3.4. Deterioration risks
3.4.1. Cover to reinforcement
Cover survey results were reported for 33 of the 36 bridges. The depths of cover varied significantly, not only between structures, but for individual bridges (). The results for maximum cover depth ranged from 30–193 mm, and the results for minimum cover depth ranged from 5–30 mm, with a mean minimum cover of 24 mm and a median of 22 mm.
Figure 10. Minimum and maximum cover depths for each bridge.
Historically, the importance of concrete cover and its contribution to durability were not appreciated, and there were very little requirements for minimum cover. As a result, many concrete structures were built with inadequate cover to protect the steel.
The first recommendations for concrete cover in the UK appeared in 1911 in a report by the Royal Institute of British Architects (RIBA Citation1911). The report specified that ‘in ordinary cases a cover of ½ inch (12.7 mm) on slabs and 1 inch (25.4 mm) on beams is sufficient’. However, this applied only to buildings and the reasoning for cover was to provide fire resistance — not to protect the steel from typical environmental exposure.
In 1915, London County Council introduced ‘The Reinforced Concrete Regulations’ (Andrews Citation1916) which required a minimum cover of 1½ inches for vertical bars in pillars, 1 inch for longitudinal bars in beams, ½ inch to any reinforcement in slabs, and 1 inch to reinforcement in any other members — while also requiring the cover to be at least equal in depth to the diameter of the bar to be covered in each of these instances. The regulations also required cover to be at least 2 inches beyond the anchored end of a bar and not less than twice the diameter of the bar to be covered,
Requirements for concrete structures were recommended by the Department of Scientific and Industrial Research in 1933, who specified concrete cover to be either ½ inch (12.7 mm) or the diameter of the bar, whichever was greater (Department of Scientific and Industrial Research Citation1933).
In 1945, the Ministry of War Transport published Memorandum No. 577, ‘Memorandum on Bridge Design and Construction’ (Ministry of War Transport Citation1945), which specified a minimum cover requirement of 1½ inches to the main reinforcement for abutment walls, 2 inches over the compression flanges of joists and upper flanges of beams, and 1 inch to all reinforcement, including stirrups, in the bridge deck — to be raised to 1½ inches if the structure is exposed to sea action.
Additional cover requirements based on exposure conditions were introduced in the 1948 code of practice, CP 114 ‘The Structural Use of Normal Reinforced Concrete in Buildings’ (BSI Citation1948), which specified different covers for two different environments — ‘internal’ and ‘external’. The minimum covers for internal work largely remained the same as those of the previous decade. However, for main reinforcement in columns, cover had to be increased to 1½ inches (38 mm), and for all external work, work against earth faces and internal work in aggressive environments, all covers had to be increased by ½ inch (12.7 mm) (BSI Citation1948, Clarke Citation2009).
However, indicates that failure to achieve these appears to have been a common problem throughout the five decades during which these structures were built, and this is likely to be an issue for many historic reinforced concrete structures built during this period.
Figure 11. Summary of minimum concrete cover to steel reinforcement by year and modern limits based on BS 8500–1 (BSI Citation2016a) requirements.
One issue was that until 1945, cover requirements only applied to the main bars, not the stirrups whose cover was originally required to be ½ inch (12.7 mm) (Reynolds Citation1932, Citation1945). What was not realised initially was that corrosion of the steel not only led to a loss in strength of the reinforcement bar, but the formation of expansive corrosion products which cause cracking of the surrounding concrete, meaning that cover requirements needed to apply to all steel. In addition, whilst the maintenance of reinforcement positions within formwork using spacers (referred to in older documents as ‘cover-blocks’) was an established practice, it was not the only method used. In Reynolds’ 1945 book ‘Concrete Construction’ (Reynolds Citation1945) he states:
Concrete cover-blocks can be left permanently in position and are therefore preferable to wood or steel wedges which must be withdrawn as concreting proceeds with consequent risk of reduction of cover due to movement of the bar.
Such an approach is likely to be much less secure than using spacers.
3.4.2. Carbonation depth
Carbonation depths were reported for all 36 bridges. The maximum depth of carbonation ranged significantly between the different bridges, from 0–125 mm, with a mean of 20 mm and a median of 5 mm (). Some of these results are outside the expected range (both above and below), as typical Portland cement concrete usually carbonates to a depth of 5–8 mm over a 10 year period, increasing to 10–15 mm after 50 years, with the rate of increase in carbonation depth generally decreasing the longer the concrete is exposed to air (BRE Citation1995).
Figure 12. Summary of maximum depths of carbonation by year.
The wide variation in carbonation is likely contributed to by a number of concrete quality and environmental factors, the majority of which are not documented. Quality issues include the water/cement ratio (w/c), which has a strong influence over the porosity of concrete and, hence, mass transport characteristics, and the presence of additional pathways for CO2 — such as cracks and construction defects. Environmental conditions include atmospheric CO2 levels and relative humidity.
One of these parameters can be explored within the data, albeit indirectly, since the strength of concrete is largely defined by the w/c ratio. Thus, plots carbonation depth against estimated cube strength, indicating very clearly that above a strength of 55 N/mm2, very little carbonation is observed.
Figure 13. Maximum depth of carbonation versus estimated cube strength.
While carbonation is not harmful to concrete itself, the resulting reduction in the pH of the cement matrix causes the breakdown of the thin passivating oxide layer on the surface of the steel, rendering it vulnerable to corrosion. As such, progression of the carbonation front to the reinforcement poses a serious risk to the durability of the structure.
When comparing the carbonation depths with the cover survey results () it is clear that in several cases the depth of carbonation far exceeds the concrete cover. Using this criterion, of the bridges where cover depth data existed (32), 34% of these appear at risk of corrosion.
Figure 14. Minimum cover depth versus carbonation depth, plotted to identify instances where the carbonation front had reached the reinforcement.
3.4.3. Chloride content
Chloride induced corrosion is a primary durability concern in the United Kingdom due to the high risk of external ingress of de-icing salts from roads and vehicles, and sea-salt ingress from marine environments (Bamforth, Price, and Emerson Citation1997; Broomfield Citation2003). Chloride content was reported for 35 of the 36 bridges (). Generally, the concrete samples had high concentrations of chlorides. At a depth of 0–25 mm, the chloride content ranged from 0.0–3.84% of cement content, with a mean of 0.90% and median of 0.65%. At a depth of 25–50 mm, the chloride content ranged from 0.0–2.85% of cement content, with a mean of 0.66% and a median of 0.36%.
Figure 15. Maximum chloride content as a percentage of cement at different depths of each bridge.
Chloride ions may enter concrete in two ways: they may be added to the fresh concrete during mixing, either as an aggregate contaminant or as part of an admixture, or they may enter the hardened concrete from an external source (Lambert Citation2002). The existence of admixed chlorides is only of concern in historic concrete structures since the use of calcium chloride in concrete admixtures as accelerators was banned in 1976 (BRE Citation2002) and chloride contamination of aggregates now has enforced limits (Bamforth, Price, and Emerson Citation1997). Chloride concentrations versus year of construction are shown in .
Figure 16. Maximum chloride as a percentage of cement at a depth of 25–50 mm versus year of construction.
Whilst there is a seeming increase in the variance of chloride levels measured with construction year within the period of time studied, which might indicate increased use of chloride admixtures, it must be noted that there are very few data points for earlier years, and the presence of chlorides may be partly, or wholly, the result of chloride ingress from the exterior in the form of de-icing salts from roads and vehicles, and sea-salt ingress from marine environments. Most of the structures had a higher chloride content at 0–25 mm than at 25–50 mm, which suggests that the chlorides ingressed from external sources. However, some (no. 5, 6, 10, 19, 30, 32, 34 and 36 — distinguished by different markers in had a higher chloride content at a depth of 25–50 mm than 0–25 mm, which suggests that the chlorides may be admixed or from aggregate contamination.
While all of the bridges in the study are subjected to seasonal de-icing salts (exposure class XD3), 11 are located within 1 km of the coastline. While none are in direct contact with sea water, they are likely to be exposed to airborne chlorides (exposure class XS1). Boxplots of the chloride concentration results for XS1 and XD3 exposure classes at depths of 0–25 mm and 25–50 mm are shown in , and it is clear that chloride contents are higher at all quartiles and at both depths for the XS1 exposure class bridges than for the XD3 bridges.
Figure 17. Boxplots of chloride concentration results for XS1 and XD3 exposure classes at depths of 0–25 mm and 25–50 mm.
However, simple linear regression modelling of the relationship between chloride content at 0–25 mm (dependent variable) and distance from the coast (independent variable) for all 35 bridges with chloride data produces a solution with an R2 of only 0.073, which suggests that the distance from the coast itself plays very little role in the likelihood of chloride ingress in road bridges in Scotland overall. This is unsurprising given the regular use of de-icing salts during Scottish winters.
If linear regression is performed again for only the 11 bridges likely to be exposed to airborne chlorides from marine environments, with chloride content as the dependent variable at 0–25 mm () and 25–50 mm (), the R2 values are 0.004 and 0.046, respectively, and the predicted values show an increase in chloride content as the distance from the coast increases. This suggests that, even in a marine environment, the distance from the coastline cannot be considered to be the main factor in determining chloride ingress. It is likely that the application of de-icing salts and the quality of the concrete both play a crucial role in the extent of chloride ingress in historic concrete road bridges in Scotland. However, to investigate this further, a statistical analysis involving variables which were not included in the reports would need to be performed. Issues of mix design and strength which are relevant to the ability of hardened concrete to resist the ingress of chlorides will be discussed in a subsequent part of this paper dealing with modern design requirements.
Figure 18. Chloride content results at 0–25 mm depth and linear regression predictions for the XS1 exposure class bridges, with respect to approximate distance from the coastline.
Figure 19. Chloride content results at 25–50 mm depth and linear regression predictions for the XS1 exposure class bridges, with respect to approximate distance from the coastline.
The corrosion of steel due to chloride ingress is dependent on several factors, and it is not possible to determine a single value of chloride content which represents the threshold at which corrosion will occur. However, reports published by the Building Research Establishment (BRE Citation2002, Currie and Robery Citation1994) give guidance on estimated levels of risk for structures of different ages and in various conditions, with a chloride level of 0.8–1.5% by weight of cement identified as presenting a ‘Very High’ risk of corrosion where the pH is >10 (i.e. where carbonation has not progressed substantially). Where carbonation has progressed and the pH is <10, the guidance suggests that a chloride level of 0.6–0.8% presents the same level of risk.
3.4.4. Half-cell potential
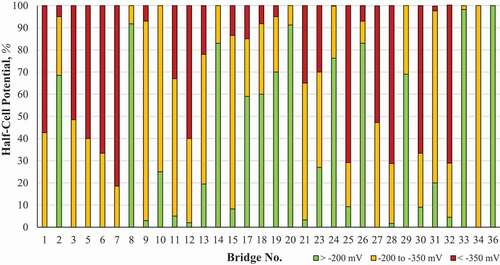
Half-cell potentials were reported for 32 of the 36 bridges. While half-cell potential measurements cannot be used to quantify corrosion, they can indicate the probability of corrosion. Areas which have a half-cell potential more negative than −350 mV indicate a 90% probability of corrosion, with results of −200 to −350 mV indicating a 50% probability of corrosion, and results more positive than −200 mV indicating a 10% probability of corrosion (ASTM International Citation2015). 24 of the 36 bridges (66.7%) had areas where the half-cell potential was more negative than −350 mV, and, as shown in , many of these bridges had a significant proportion of results that were less than −350 mV.
Figure 20. Percentage of half-cell potential results in mV ranges.
As the exposure class of a bridge can have a significant impact on the likelihood of corrosion, the relationship between exposure class and half-cell potential results less than −350 mV was considered. As shown in , while the minimum, first quartile and median results are significantly higher for exposure class XS1, the third quartile results for both are approximately the same (57.3, 56.3) and the maximum for the XD3 bridges is significantly higher than for XS1, indicating that the potential for widespread corrosion in these bridges is not limited to a certain exposure class and there are other characteristics which need to be taken into consideration.
Figure 21. Boxplots of half-cell potential results < −350 mV for XS1 (9 bridges) and XD3 (23 bridges) exposure classes.
attempts to relate the half-cell corrosion measurements to other characteristics with influence over corrosion. It indicates which bridges had more than 50% of half-cell measurements less than −350 mV, alongside indications of whether carbonation had reached the reinforcement and whether chloride levels at either test depth exceeded the BRE levels indicating a high risk of corrosion. It was assumed that the pH of the concrete was less than 10 if carbonation had reached the reinforcement. Of the 11 bridges that displayed high frequencies of high half-cell potential measurements, 9 showed carbonation or chloride characteristics of concern (or both). Bridges with no corrosion-related characteristics or where half-cell measurements were not conducted, are excluded. The relationship between the risk level from and the age of the structures is shown in . attempts to demonstrate the relationship between risk level and exposure class, and suggests that the bridges in XS1 exposure conditions are, generally, more likely to be at risk than those in XD3 exposure conditions. However, it should be noted that there are significantly less XS1 bridges than XD3 bridges (11 XS1, 25 XD3) and additional results to this relatively small sample size may have a notable influence on the presentation of the relationship between exposure class and risk level.
Table 3. Relationships between high frequencies of half-cell corrosion readings < −350 mV and carbonation and chloride characteristics indicating a risk of corrosion.
Figure 22. Relationship between risk level (based on carbonation depth, chloride level and half-cell potential readings) and age of structure.
Figure 23. Relationship between risk level (based on carbonation depth, chloride level and half-cell potential readings) and exposure class, from results for 11 XS1 bridges and 25 XD3 bridges.
It should also be noted that there are 13 bridges where carbonation and chloride levels are of concern, but high half-cell measurements were relatively infrequent. It should be stressed that this does not mean that half-cell corrosion measurements have failed to detect a problem — it may well be the case that conditions for these bridges are such that corrosion is unlikely to occur — and overall, it can be concluded that half-cell measurements are a worthwhile evaluation technique.
3.5. Comparison with modern concrete design standards
At the start of the 20th century, there were very few design standards during early reinforced concrete construction — the first UK regulations appearing in 1915 when London County Council introduced the Reinforced Concrete Regulations (Addis and Bussell Citation2003; Andrews Citation1916; Clarke Citation2009) — and so designs were carried out by individual specialists who each had their own requirements.
Furthermore, many aspects of concrete design which have a significant impact on durability were not well understood or overlooked completely. Historically a belief that existed within the engineering community was that concrete durability was inherently related to its strength and, as a result, even in the 1960s it was generally believed that durability did not need to be considered at the design stage (Neville Citation2001).
This view has altered significantly over time and, in modern construction in the United Kingdom, concrete structures are designed in accordance with BS EN 1992 ‘Eurocode 2: Design of Concrete Structures’ (BSI Citation2014), with concrete conforming to BS EN 206 (BSI Citation2013). Additionally, the supplementary standards to EN 206 — BS 8500–1 and −2 (BSI Citation2016a, Citation2016b) — are used to provide additional guidance with regards to aspects of concrete specification and production, with detailed coverage of durability requirements.
These standards specify the design requirements that concrete structures must satisfy to ensure the durability of the concrete in specific environments — known as ‘exposure classes’. For each given exposure class these design requirements include, but are not limited to:
Maximum w/c ratio
Minimum strength class
Minimum cement content
Minimum cover to steel reinforcement
While the minimum strength class of concrete is a factor which has always been of principal concern in concrete design, the influence of w/c ratio and cement type on durability were not fully appreciated until the 1980s (Neville Citation2001). The minimum cover is also an important requirement of the concrete design which, as described in BS EN 1992-1-1 (BSI Citation2014), serves to ensure the safe transmission of forces, the protection of steel against corrosion, and adequate fire resistance.
In this discussion, it is protection of steel against corrosion that is of most concern. Given the lack of historic design requirements for durability and the critical role that minimum cover plays in determining the durability of reinforced concrete structures, it is useful, at this stage, to compare the data from the tests reports to the modern design requirements in order to give a clearer context to their significance. However, in order to do this effectively, it is first necessary to give a brief overview of the process which determines the minimum design requirements.
3.6. Design overview
3.6.1. Strength class
In the United Kingdom, the recommended minimum and maximum 28-day strength values for concrete bridges, as described in BS EN 1992–2 (BSI Citation2005), are 37 and 85 MPa, respectively. However, it should be noted that, in some cases, the requirements for ensuring durability may result in a choice of a higher strength class than is required for the structural design (BSI Citation2014).
Due to the changes in the fineness and C3S content of Portland cement over the past 150 years, the rate of hydration of modern Portland cement will be greater than that of historic Portland cement (Butler Citation1923; Corish and Jackson Citation1982; Nixon Citation1988).
However, due to the decrease in C2S, the long-term strength gain — that which occurs after 28 days — will be lower than would be observed in the historic material. This means that strengths measured 50 or more years after construction are unlikely to reflect the strength at 28 days. Conversely, deterioration processes may have caused a decline in strength. The result of these two opposing factors means that uncertainty exists regarding how the estimated cube strengths presented in this study relate to the strength of the concrete throughout service life.
3.6.2. Exposure class
The determination of exposure class is critical in the design of reinforced concrete structures, as the environmental exposure conditions will determine the mechanisms and extent of deterioration that will occur, and the standards provide guidance to engineers regarding the specification of concrete to provide adequate protection to ensure durability throughout the design working life.
The relevant exposure class is selected from those designated in BS EN 206 (BSI Citation2013), BS 1992-1-1 (BSI Citation2014) and BS 8500–1 (BSI Citation2016a). Once this has been determined, the relevant recommended limiting values for maximum w/c ratio, minimum strength class, minimum cement content, and minimum cover (if relevant) given in BS EN 8500–1, can be applied. The standard provides greater flexibility than BS 1992-1-1 in selecting minimum cover: lower minimum cover is usually an option if a lower w/c and higher cement content are specified.
As previously mentioned, in accordance with Eurocode 2, minimum cover has to be determined not only to ensure the protection of the steel against corrosion, but also adequate transmission of bond forces and fire resistance. Each of these minimum cover requirements is calculated separately with the greatest value satisfying all three should be selected.
3.7. Determining minimum requirements
In the case of the structures analysed, as they were all elements of road bridges, the exposure classes XC4 (corrosion induced by carbonation), XD3 (corrosion induced by chlorides other than from seawater) and XF4 (freeze/thaw attack) are all applicable. Based on this and the recommended values in BS 8500–1 (BSI Citation2016a), XD3 has the most demanding requirements, shown in . As previously discussed, 11 of these bridges are within 1 km of the coastline and, therefore, would also be subject to the more demanding requirements relating to exposure class XS1 (exposed to airborne salt but not in direct contact with sea water) if they were constructed today. However, to simplify the comparison with modern requirements, all bridges will considered to be class XD3 with regards to chloride exposure, as all the bridges are exposed to seasonal de-icing salts.
Table 4. Options for requirements for concrete exposed to an XD3 exposure class environment.
3.7.1. Comparison with minimum requirements
Due to gaps in the test data and difficulties in accurately calculating the w/c and cement content of hardened concrete (Wilkie and Dyer Citation2020), it was deemed unwise to include these parameters in any comparison with modern concrete design standards. However, it is possible to compare the results of the covermeter survey with recommended minimum cover for durability, and, while there is no record of 28-day strengths for the concrete samples, the results of the compressive tests can be compared to the current standards to determine which of the samples have a characteristic compressive strength that is greater than the minimum 28-day requirement.
Only 43 (38%) of the estimated cube strengths were greater than the XD3 requirement of 45 N/mm2 and only 60 (53%) were above the absolute minimum of 37 N/mm2 specified in modern UK standards. 28 of the 34 bridges (82%) for which there were reported strengths had at least one compressive strength test result which was below 45 N/mm2 and only 6 of the bridges (18%) had results which were all above 45 N/mm2. However, due to the issues related to maximum aggregate size and sample size which have been previously discussed, it is possible that the compressive strength results may be over-estimated.
The results of the covermeter survey () show that the minimum recorded cover, in most cases, was significantly lower than the lowest requirement of 40 mm. In fact, of the 90 recorded minimum cover results, 66 (73%) were below the 40 mm requirement and, of the 86 recorded maximum cover results, 27 (30%) were below this requirement.
Considering the upper estimated cube strength and minimum cover measurements simultaneously for each bridge, of the 29 for which both measurements existed, 4 (14%) satisfied the requirements in . Using the lower values, none of the bridges satisfied these requirements.
Overall, these results illustrate a historical underestimation of the importance of the role of concrete cover, and this must be a point to be borne in mind for those with responsibility for historic concrete structures.
4. Conclusions
Test data was collated from reports previously prepared by eight different testing houses for 36 different reinforced concrete bridges built prior to 1950. These test reports contained data for 119 concrete cores, data from covermeter, half-cell potential, and chloride and carbonation depth surveys. The data from these reports were collated and analysed in order to try to understand the deterioration risks of early 20th century reinforced concrete bridges and establish a greater understanding of historic concrete construction in Scotland.
The approach to testing and reporting of results between the different testing houses varied. Most reports focussed primarily on the compressive strength of concrete cores removed from the structures, and there was a lack of additional data relating to the physical and chemical composition of the concrete. This lack of supporting compositional data makes it difficult to observe temporal trends which may exist in the materials used for manufacturing reinforced concrete structures prior to 1950. However, one evident difference was that maximum aggregate sizes were much greater than those recommended for reinforced concrete today were observed in the bridges built prior to 1932, which suggests that the effect the maximum aggregate size has on the properties of hardened concrete was not well understood. It would seem from the test data that this changed in 1932 as, in all of the analysed concrete samples that were cast after this time, the maximum aggregate size was found to be 20 mm only. It would appear that this very clear transition can be linked to published guidance.
From a durability standpoint, most of these structures fell below the requirements of UK standards today. The protective concrete cover to reinforcement was considerably lower than relevant modern requirements, with at least 87.7% of the areas surveyed having a cover less than the modern minimum, and in some cases, the depth of cover was determined to be as low as 5 mm. Furthermore, 61.9% of the structures had an estimated cube strength that was below the minimum 28-day compressive strength requirement for the likely exposure conditions, potentially leaving some structures at risk of deterioration from freeze-thaw attack, and both carbonation and chloride-induced corrosion.
There appears to be no correlation between the age of the structure and compressive strength of the concrete, but the spread of results from individual bridges, and even from the same elements on the same bridge, was significant. This suggests a poor degree of quality control which is likely a result of poor workmanship or lack of control between batch preparations. The variation in these results highlights the need to carry out tests on a larger number of samples from historic concrete structures than may usually be recommended, as the variability of the concrete seems to be far greater than would be expected in a modern structure.
It is possible that some of the estimated cube strengths reported were not an accurate representation of the concrete, as the size of the cores that were taken may have been much smaller in relation to the maximum aggregate size than is recommended by current standards. As discussed, the maximum size in historic concrete structures built prior to 1932 could be much greater than that used in modern construction and, therefore, the size of the core used needs to be considered by those taking samples from concrete structures from this era to ensure accurate and comparable results.
It is clear from this study, that historic concrete bridges in Scotland, and historic concrete structures in Scotland in general, are likely to suffer from significant durability issues due to their design. In particular, the cover in many of the structures is significantly lower than would be acceptable in relation to durability for modern construction, and a comparison of the results of the carbonation and covermeter surveys show that the carbonation front is likely to have advanced beyond the reinforcement in many of these bridges. The data make a strong case for using higher strength and, hence, low w/c ratio concrete where carbonation is a risk, since concrete with an estimated cube strength of greater than 55 N/mm2 showed almost no evidence of carbonation.
The chloride depth survey showed that, at the time of testing, many of the structures had a high chloride content. While there is evidence of chlorides from marine and cast-in sources in many of these bridges, the results of this study suggest that the use of de-icing salts is the most likely source of high chloride contents for early reinforced concrete road bridges in Scotland. Comparison with the carbonation survey showed that high chloride contents were often combined with carbonation, suggesting a high risk of corrosion. The half-cell potential measurements confirm that there were areas in the majority of the bridges which had a 90% probability of corrosion, and, in several cases, the extent of this area was significant.
While many of the bridges are at risk from durability related issues, there appears to be no correlation between the year they were built and the level of risk, i.e. the oldest structures are not necessarily the ones most at risk. In fact, results of this study suggest that the risk of deterioration of historic concrete structures is dependent on the initial quality of the concrete, the depth of cover to reinforcement and the environmental exposure conditions — a conclusion which corresponds with the findings of other authors in both Italy (Bertolini et al. Citation2011) and Spain. (Marcos et al. Citation2016).
It should be re-iterated that the results reported in this study do not reflect the current status of these bridges since it is probable that in cases where problems were identified, remedial action would have been taken. However, it is clear that engineers were learning about the nature of reinforced concrete even as it was being used for construction throughout a large part of the 20th century, meaning that inspection and maintenance of historic concrete bridges will continue to be a necessity, and, in many cases, conservation strategies which include re-alkalisation, chloride extraction and electro-chemical protection may need to be put in place in order to preserve these unique examples of architectural heritage.
Acknowledgments
Initial work on this study was supported by a collaborative doctoral research award funded by the Arts and Humanities Research Council (grant no. AH/L008467/1) and Historic Environment Scotland through the Scottish Cultural Heritage Consortium. Additional analysis and preparation of the manuscript were supported by the J. Paul Getty Trust. The authors would like to thank Transport Scotland for providing access to their records, without which this study would not have been possible.
Additional information
Funding
References
- Addis, B., and M. Bussell. 2003. Key developments in the history of concrete construction and the implications for remediation and repair. In Concrete building pathology, ed. S. MacDonald, 15–105. Oxford: Blackwell Science.
- Andrews, E. S. 1916. The reinforced concrete regulations of the London County council. London: B.T. Batsford Ltd.
- ASTM International. 1980. C876-80: Standard test method for corrosion potentials of uncoated reinforcing steel in concrete. West Conshohocken: ASTM International.
- ASTM International. 1987. C876-87: Standard test method for corrosion potentials of uncoated reinforcing steel in concrete. West Conshohocken: ASTM International.
- ASTM International. 2015. C876-15: Standard test method for corrosion potentials of uncoated reinforcing steel in concrete. West Conshohocken: ASTM International.
- ASTM International. 2018. C42/C42M-18a: Standard test method for obtaining and testing drilled cores and sawed beams of concrete. West Conshohocken: ASTM International.
- Baker, A. G. 1992. Structural investigations. In Durability of concrete structures: Investigation, repair, protection, ed. G. Mays, 37–81. London: E & FN Spon.
- Bamforth, P. B., W. F. Price, and M. Emerson. 1997. Contractor report 359: An international review of chloride ingress into structural concrete. Edinburgh: Transport Research Laboratory.
- Basheer, L., P. A. M. Basheer, and A. E. Long. 2005. Influence of coarse aggregate on the permeation, durability and the microstructure characteristics of ordinary Portland cement concrete. Construction and Building Materials 19 (9):682–90. doi:https://doi.org/10.1016/j.conbuildmat.2005.02.022.
- Bertolini, L., M. Carsana, M. Gastaldi, F. Lollini, and E. Radaelli. 2011. Corrosion assessment and restoration strategies of reinforced concrete buildings of the cultural heritage. Materials and Corrosion 62 (2):146–54. doi:https://doi.org/10.1002/maco.201005773.
- BRE (Building Research Establishment). 1981. IP 6/81, Carbonation of concrete made with dense natural aggregates. Bracknell: BRE Press.
- BRE (Building Research Establishment). 1995. Digest 405: Carbonation of concrete and its effects on durability. Watford: BRE.
- BRE (Building Research Establishment). 2002. Digest 444 Part 2: Corrosion of steel in concrete - Investigation and assessment. Watford: BRE.
- Broomfield, J. 2003. The identification and assessment of defects, damage and decay. In Concrete building pathology, ed. S. MacDonald, 140–60. Oxford: Blackwell Science.
- BSI (British Standards Institution). 1948. CP 114, codes of practice committee for civil engineering, public works and building, the structural use of normal reinforced concrete in buildings. London: BSI.
- BSI (British Standards Institution). 1980. BS 4551: 1980, methods of testing mortars, screeds and plasters. London: BSI.
- BSI (British Standards Institution). 1983a. BS 1881-120:1983, testing concrete - Method for determination of the compressive strength of concrete cores. London: BSI.
- BSI (British Standards Institution). 1983b. BS 1881-114:1983, testing concrete - Methods for determination of hardened concrete. London: BSI.
- BSI (British Standards Institution). 1988a. BS 1881-124:1988, testing concrete - Methods for analysis of hardened concrete. London: BSI.
- BSI (British Standards Institution). 1988b. BS 1881-204:1988, testing concrete - Recommendations on the use of electromagnetic covermeters. London: BSI.
- BSI (British Standards Institution). 2005. BS EN 1992-2:2005, Eurocode 2 - Design of concrete structures - Part 2: Concrete bridges - Design and detailing rules. London: BSI.
- BSI (British Standards Institution). 2009. BS EN 12504-1:2009, testing concrete in structures, Part 1: Cored specimens – Taking, examining and testing in compression. London: BSI.
- BSI (British Standards Institution). 2012. BS EN 12390-1:2012, Testing hardened concrete, Part 1: Shape, dimensions and other requirements for specimens and moulds. London: BSI.
- BSI (British Standards Institution). 2013. BS EN 206:2013, concrete - Specification, performance, production and conformity. London: BSI.
- BSI (British Standards Institution). 2014. BS EN 1992-1-1:2004+A1:2014, Eurocode 2: Design of concrete structures - Part 1-1: General rules and rules for buildings. London: BSI.
- BSI (British Standards Institution). 2016a. BS 8500-1:2015+A1:2016, concrete - complementary British standard to BS EN 206 Part 1: Method of specifying and guidance for the specifier. London: BSI.
- BSI (British Standards Institution). 2016b. BS 8500-2:2015+A1:2016, concrete - complementary British standard to BS EN 206, Part 2: Specification for constituent materials and concrete. London: BSI.
- Butler, D. B. 1923. The British standard specification for Portland cement. London: Institute of Structural Engineers.
- Clarke, J. L. 2009. Technical report no. 70: Historical approached to the design of concrete buildings and structures. Camberley: The Concrete Society.
- Corish, A. T., and P. J. Jackson. 1982. Portland cement properties - past and present. Concrete 7 (16):16–18.
- Currie, R. J., and P. C. Robery. 1994. Repair and maintenance of reinforced concrete. Watford: Building Research Establishment.
- Department of Scientific and Industrial Research. 1933. Report of the reinforced concrete structures committee of the building research board with recommendations for a code of practice for the use of reinforced concrete in buildings. London: His Majesty’s Stationery Office.
- Halstead, P. E. 1961. The early history of Portland cement. Transactions of the Newcomen Society 34 (1):37–54. doi:https://doi.org/10.1179/tns.1961.003.
- Higginson, C. C., G. B. Wallace, and E. L. Ore. 1963. Effect of maximum size aggregate on compressive strength of mass concrete. ACI Symposium on Mass Concrete SP-6 (111): 219–56.
- Lambert, P. 2002. Technical notes no: 1, reinforced concrete - History, properties & durability. Bordon: Corrosion Prevention Association (CPA).
- Marcos, I., J. San-Josẻ, L. Germendia, A. Santamaría, and J. M. Manso. 2016. Central lessons from the historical analysis of 24 reinforced-concrete structures in northern Spain. Journal of Cultural Heritage 20:649–59. doi:https://doi.org/10.1016/j.culher.2016.03.003.
- Ministry of War Transport. 1945. Memorandum No. 577, Memorandum on bridge design and construction. London: His Majesty’s Stationary Office.
- Neville, A. 2001. Consideration of durability of concrete structures: Past present, and future. Materials and Structures/Materiaux Et Constructions 34:114–18.
- Neville, A. M., and J. J. Brooks. 2010. Concrete technology. 2nd ed. Harlow: Pearson Education Limited.
- Nixon, P. J. 1988. Changes in Portland cement properties and their effects on concrete. Watford: Building Research Establishment.
- Reynolds, C. E. 1932. Reinforced concrete designers’ handbook. 1st ed. London: Concrete Publications Limited.
- Reynolds, C. E. 1938. Practical examples of reinforced concrete design: In accordance with the code of practice for the use of reinforced concrete in buildings (1934) and London County council building by-laws (1938). 1st ed. London: Concrete Publications Limited.
- Reynolds, C. E. 1945. Concrete construction. 2nd ed. London: Concrete Publications.
- RIBA. 1911. Joint committee report on reinforced concrete. Second Report, The Royal Institute of British Architects, London.
- Scrivener, K. L., A. K. Crumbie, and P. Laugesen. 2004. The interfacial transition zone (ITZ) between cement paste and aggregate in concrete. Interface Science 12 (4):411–21. doi:https://doi.org/10.1023/B:INTS.0000042339.92990.4c.
- Urquhart, D. C. M. 2020. The early concrete bridges of Scotland: A heritage at risk? Journal of Architectural Conservation 26 (3):201–14. doi:https://doi.org/10.1080/13556207.2020.1780052.
- Walker, S., D. L. Bloem, and R. D. Gaynor. 1959. Relationships of concrete strength to maximum size of aggregate. In Proceedings of the thirty-eighth annual meeting, ed. H. P. Orland, 367–85. Washington, DC: Highway Research Board.
- Walker, S., and D. L. Bloem. 1960. Effects of aggregate size on properties of concrete. ACI Journal, Proceedings 57 (3):283–98.
- Wilkie, S. D., and T. D. Dyer. 2020. Challenges in the analysis of historic concrete: understanding the limitations of techniques, the variability of the material and the importance of representative samples. International Journal of Architectural Heritage 1–16. doi:https://doi.org/10.1080/15583058.2020.1749728.