
Abstract
Esophageal cancers are highly aggressive tumors with poor prognosis despite some recent advances in surgical and radiochemotherapy treatment options. This study addressed the feasibility of drugs targeting epigenetic modifiers in esophageal squamous cell carcinoma (ESCC) and esophageal adenocarcinoma (EAC) cells. We tested inhibition of histone deacetylases (HDACs) by SAHA, MS-275, and FK228, inhibition of DNA methyltransferases by Azacytidine (AZA) and Decitabine (DAC), and the effect of combination treatment using both types of drugs. The drug targets, HDAC1/2/3 and DNMT1, were expressed in normal esophageal epithelium and tumor cells of ESCC or EAC tissue specimens, as well as in non-neoplastic esophageal epithelial (Het-1A), ESCC (OE21, Kyse-270, Kyse-410), and EAC (OE33, SK-GT-4) cell lines. In vitro, HDAC activity, histone acetylation, and p21 expression were similarly affected in non-neoplastic, ESCC, and EAC cell lines post inhibitor treatment. Combined MS-275/AZA treatment, however, selectively targeted esophageal cancer cell lines by inducing DNA damage, cell viability loss, and apoptosis, and by decreasing cell migration. Non-neoplastic Het-1A cells were protected against HDACi (MS-275)/AZA treatment. RNA transcriptome analyses post MS-275 and/or AZA treatment identified novel regulated candidate genes (up: BCL6, Hes2; down: FAIM, MLKL), which were specifically associated with the treatment responses of esophageal cancer cells. In summary, combined HDACi/AZA treatment is efficient and selective for the targeting of esophageal cancer cells, despite similar target expression of normal and esophageal cancer epithelium, in vitro and in human esophageal carcinomas. The precise mechanisms of action of treatment responses involve novel candidate genes regulated by HDACi/AZA in esophageal cancer cells. Together, targeting of epigenetic modifiers in esophageal cancers may represent a potential future therapeutic approach.
List of Abbreviations
| 5mC | = | 5-methylcytidine |
| AZA | = | Azacytidine |
| DAC | = | Decitabine |
| DNMT | = | DNA (cytosine-5)-methyltransferase |
| EAC | = | esophageal adenocarcinoma |
| ESCC | = | esophageal squamous cell carcinoma |
| FAIM | = | Fas apoptotic inhibitory molecule |
| GEJ | = | gastro-esophageal junction |
| H3Ac | = | histone H3 acetylation |
| H3K4me3 | = | histone H3 trimethylation at lysine 4 |
| H3K9Ac | = | histone 3 lysine 9 acetylation |
| HDAC | = | histone deacetylases |
| HDACi | = | HDAC inhibitor |
| Hes-2 | = | Hairy and enhancer of split 2 |
| SAHA | = | suberoylanilide hydroxamic acid |
| TSA | = | Trichostatin A |
Introduction
Esophageal cancer is an aggressive malignancy of the upper gastrointestinal tract and is classified into two major histotypes: esophageal squamous cell carcinoma (ESCC) and esophageal adenocarcinoma (EAC). Esophageal cancer patients are often diagnosed at advanced stages with metastatic disease.Citation1 Prognosis clearly depends on cancer stage, showing a decrease of the 5-year survival rate from 69% for T1 down to 17% for T3.Citation2 Thus, therapeutic approaches are dependent on stage and cancer sub-type (ESCC or EAC).Citation3 Precursor lesions, such as Barrett's Esophagus, or early stages with localized disease are managed by endoscopic mucosal resection.Citation4 The only curative approach for advanced esophageal cancers (T3 or lymph node metastasis) is still based on surgery.Citation3,5 Neoadjuvant treatment by combined radio-/chemotherapy with 5-flurouracil and cisplatin achieves doubling of median survival from 20.4 to 45.6 months.Citation6 ESCC patients show higher rates of pathological complete response than EAC patients after neoadjuvant radiochemotherapy.Citation7 Indeed, perioperative chemotherapy instead of neoadjuvant radiochemotherapy seems to be favorable for EAC treatment.Citation8 So far, treatment strategies including molecular targeted intervention are not yet widely approved for patients with ESCC and EAC, except HER2-targeted therapy for adenocarcinomas of the lower gastric-esophageal junction (GEJ).Citation9
Epigenetic alterations are involved in the carcinogenesis and progression of esophageal cancers.Citation10-12 Moreover, epigenetic modifiers, such as DNA (cytosine-5)-methyltransferase 1 (DNMT1) and class I histone deacetylase 1 and 2 (HDAC1/HDAC2) are frequently expressed in esophageal cancers and may represent novel target structures.Citation13-16 Little is known about the detailed mechanisms of action and response to HDAC inhibitors (HDACi) or DNMT1 inhibitors, such as Azacytidine (AZA) and its derivative Decitabine (DAC) in esophageal cancer cells, particularly upon consideration of the 2 distinct clinico-pathological subtypes of ESCC and EACs.Citation17-19 In other solid gastrointestinal tract cancers, HDACi or AZA showed anti-tumor activity in model systems, but its clinical relevance is still under investigation.Citation20,21 Since solid tumors frequently exhibit major intra- and inter-tumoral heterogeneity, it is not surprising that HDACi and AZA treatment was so far only approved for hematological diseases.Citation22-24
The mechanism of action of HDACi or DNMT inhibitors is mainly via their effect on altering, respective re-activating transcription of silenced tumor suppressor genes.Citation25 Re-expression of p21/CDKN1A is one example for gene de-repression post HDACi treatment and marks a critical decision point for HDACi efficacy.Citation26,27 Moreover, HDACi show major cell type-specific, respective potentially cancer cell-selective effectsCitation28,29 and include distinct patterns of induction of apoptosis, differentiation, cell cycle arrest, or even immunomodulation (for HDACi).Citation16,21,30,31 The distinct cellular effects may be triggered by cell type-specific patterns of transcriptional re-expression, as well as oxidative stress or DNA repair.Citation32,33
Importantly, synergistic effects of HDACi and the DNMT inhibitor DAC were reported for growth inhibition, DNA damage, and apoptosis induction in different tumor entities.Citation34–36 Again, the underlying mechanism of action is not validated yet, but HDACi appear to decelerate removal of incorporated DAC from DNA, thereby enhancing the harmful action of DAC.Citation37
In the setting of the 2 major types of esophageal cancer, this study addressed the basic molecular effects (e.g. histone acetylation levels) as well as cellular (e.g. cell viability) and molecular (RNA transcriptome) responses of non-neoplastic and several esophageal cancer cell lines to broad (suberoylanilide hydroxamic acid or SAHA) and specific (MS-275, FK228) HDACi, to the DNMT inhibitors AZA and DAC, and to combinations of HDACi and AZA. In addition, human tissue specimens of esophageal cancer patients and case-matched normal esophageal epithelia were examined for expression of the therapy-relevant targets HDAC1/2/3 and DNMT1, as well as the levels of corresponding epigenetic marks. Our study thereby comprehensively investigates the basis for potential further (pre-) clinical biomarkers and inhibitor exploitation of epigenetic modifiers in the 2 main histotypes of esophageal cancers.
Results
Frequent HDAC1–3 and DNMT1 expression in esophageal carcinomas
In case-matched tissue specimens of normal esophageal epithelium (n = 20) and ESCCs (n = 10) or EACs (n = 10) of patients without neoadjuvant treatment, HDAC1, HDAC2, HDAC3 and DNMT1 were frequently expressed in the nuclei of basal normal epithelial and ESCC and EAC cells (). Thereby, 10–20% of ESCC and EAC had slightly lower HDAC1, HDAC2, and HDAC3 expression in cancer as compared to normal epithelial cells. In addition, 50% of ESCCs and EACs showed a clear loss of nuclear DNMT1 in cancer cells (, arrows; see Supplementary Table S1 for quantification). Finally, H3K9Ac (80% of ESCC, 40% of EAC) and 5mC (50% of ESCCs and EACs) levels were reduced in cancer as compared to normal epithelial cells.
Figure 1. HDACs are deregulated in esophageal cancer cells. The panels show representative serial sections, respective the same tissue areas, of matching normal esophageal epithelium and ESCC or EAC tissue specimens stained for the epigenetic modifiers HDAC1, HDAC2, HDAC3, H3K9ac (red staining; via AP/Streptavidin, DAKO Real Detection system AP/RED) as well as DNMT1 and 5mC (brown staining, via DAB, DAKO envision FLEX+ Kit). Note reduced H3K9ac as well as loss of DNMT1 expression and 5mC (see arrows) in tumor cells of ESCCs and EACs as compared to normal epithelial cells (see inserts). Refer to Supplementary Data Table S1 for quantification of all cases. Bar represents 100 μm.
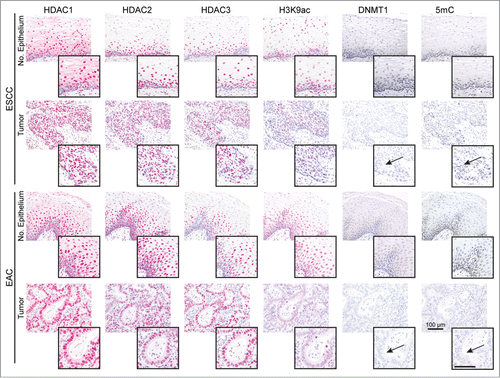
Thus, HDAC1–3 as relevant drug targets are frequently expressed in normal and cancer cells of ESCC and EAC patients, whereby DNMT1 is lost in cancer cells in about half of the patients.
HDACs are deregulated in esophageal cancer cells
Six esophageal cancer cell lines (ESCC cell lines OE21, Kyse-270, and Kyse-410, EAC cell lines OE33 and SK-GT-4, and a cell line derived from a GEJ adenocarcinoma, OE19) and a non-neoplastic esophageal epithelial cell line (Het-1A) were next characterized for HDAC1, HDAC2, HDAC3, and DNMT1 localization and expression (). As seen for human tissue specimens, nuclear HDAC expression was seen in non-neoplastic Het-1A and the 6 ESCC, EAC, and GEJ cancer cell lines (). Similar to 10–20% of patient tissue specimens, some ESCC and EAC cell lines showed significantly reduced HDAC1, HDAC2, and HDAC3 protein levels (OE21 cells: HDAC1 P = 0.0015; HDAC2 P < 0.001; HDAC3 P = 0.0479, and OE33 cells: HDAC1 P = 0.0435; HDAC2 P = 0.017; ).
Figure 2. HDACs are deregulated in esophageal cancer cells. (A) Indirect immunofluorescence staining revealed nuclear localization for DNMT1 and HDAC1, HDAC2, and HDAC3 in all 7 cell lines. (B) Protein levels were analyzed by immunoblotting, shown by one representative blot (left) and quantification by densitometry (right), revealing maintained HDAC1, HDAC2, HDAC3 and DNMT1 expression in most esophageal cancer cell lines, but decreased HDAC1, HDAC2, and HDAC3 expression in OE21 and OE33 compared to Het-1A cells. (C) Measurement of general HDAC activity revealed increased HDAC activity in all esophageal cancer cell lines (except OE19 as GEJ cell line) compared to Het-1A cells (dark gray bars). Trichostatin A (TSA) as positive control shows adequate reduction of HDAC activity in all cell lines, proving specificity of the fluorescence signal. Data is represented as mean ± SEM for 3 independent experiments. All activity measurements were performed in technical duplicates. Significance levels are represented as *: 0.05–0.01, **: ≤ 0.01–0.001 and ***: ≤ 0.001.
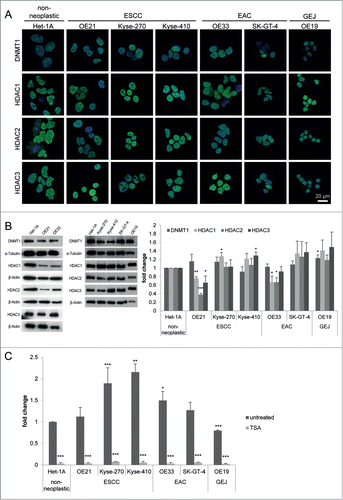
Furthermore, compared to the non-neoplastic Het-1A cells, HDAC activity was increased in all ESCC and EAC cell lines, except in the GEJ cell line OE19, exhibiting reduced HDAC activity ().
Thus, HDAC levels in the selected non-neoplastic and esophageal cancer cell lines reflect patterns observed in human esophageal cancer patients. Importantly, HDAC activity appears to be uncoupled from HDAC levels in some esophageal cancer cells.
HDACi and AZA selectively reduce esophageal cancer cell viability
To test the vulnerability of esophageal cancer cells to HDAC inhibition, the effects of broad (SAHA) and 2 selective HDACi (MS-275, FK228) as well as 2 DNMT inhibitors (AZA and DAC) were examined in ESCC and EAC cells with reduced HDAC levels but maintained HDAC activity ().
Figure 3. Dose response curves for the effect of HDACi/AZA on cell viability. Cells were cultured with DMSO (=0 on x-axis) and various doses of (A) SAHA, (B) MS-275, (C) FK228 as well as (D, E) AZA or (F) DAC for 72 h before cell viability was analyzed. To rule out known difficulties with AZA drug stability, cells were treated with (D) continuous AZA or (E) daily refreshment of AZA. (G-I) Cells were treated with 50 μM AZA and 2 different concentrations of each HDACi for 72 h before cell viability was determined. Data is represented as percent in comparison to vehicle (DMSO) treated cells (set to 100%). Shown is the mean ± SEM for 3 independent experiments, each performed in technical triplicate. Significance levels are represented as *: 0.05–0.01, **: ≤ 0.01–0.001 and ***: ≤ 0.001.
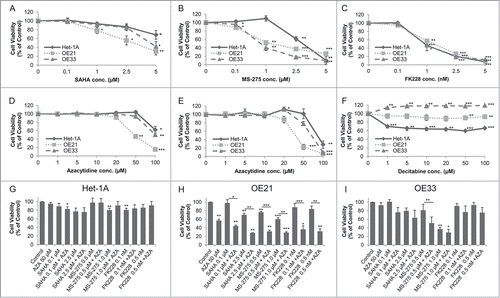
For HDACi, SAHA reduced cell viability at doses from 1 to 5 μM mainly in OE21 cells (). In contrast, MS-275 showed strong cancer cell selectivity, with reduction of cell viability to 52.4% in OE21 (P = 0.0012) and to 40.0% in OE33 (P = 0.0065) at 1 μM (). Finally, FK228 also effectively reduced cell viability without being cancer cell selective ().
Second, treatment with continuous AZA at different doses reduced cell viability to 46.4% in OE21 cells at 50 μM (P = 0.0026; ). OE33 and the non-neoplastic Het-1A cells only showed an effect at the highest dose of 100 μM (). Daily AZA refreshment revealed similar results, excluding drug stability problems (). In contrast, DAC treatment decreased cell viability of non-neoplastic Het-1A cells, but was ineffective in esophageal cancer cells (). DAC was therefore not considered for further experiments.
Surprisingly, in combination treatment of 2 different concentrations of each HDACi with 50 μM AZA, cell viability of non-neoplastic Het-1A cells was mainly unaffected (). In contrast, HDACi/AZA combination treatment had a supportive effect on esophageal cancer cells as compared to HDAC or AZA alone (see Supplementary Fig. S1): For OE21 cells, all tested HDACi/AZA dose combinations showed enhanced effects compared to the single substances (P = 0.0246 − 0.0003; ). For OE33 cells, a marked reduction of cell viability was seen for 0.5 μM MS-275 with AZA (P = 0.0022; ).
In addition, combined HDACi/AZA treatment was able to render specific HDACi effective, which had been ineffective alone (). Thus, combination of FK228/AZA reduced OE21 cell viability to 35% (P = 0.017 − 0.007), while this was not seen for FK228 alone or only to 57% for AZA alone ().
The supportive effects of combined HDACi and AZA treatment were also observed for additional ESCC (Kyse-270, Kyse-410), EAC (SK-GT-4), and one GJE (OE19) cell lines (Supplementary Fig. S2; see Additional File 2). Thereby, the strongest effect of combined HDACi (particularly MS-275) with AZA treatment was seen for Kyse-270 and Kyse-410.
The above experiments in 7 cell lines clearly show that - despite the similar HDAC levels in non-neoplastic and cancer cell lines - HDACi (SAHA, MS-275 and FK228) and AZA act in a cancer cell-selective way and show enhanced cancer cell-selective efficacy upon combination therapy.
HDACi and/or AZA downregulate HDAC activity and alter their target protein expression
To link the distinct non-neoplastic and esophageal cancer cell responses to specific HDACi and AZA effects, HDAC activity, histone acetylation, and target protein expression were next examined ( and Supplementary Fig. S3 and S4).
Figure 4. Downregulation of HDAC activity by HDACi. HDAC activity was measured 24 h post HDACi/AZA addition, showing similar downregulation of HDAC activity in all 7 cell lines. Inhibitor concentrations: SAHA = 0.1 μM, MS-275 = 0.5 μM and FK228 = 0.1 nM. Shown is the mean ± SEM of 3 independent experiments, performed in technical duplicates. Significance levels are represented as *: 0.05–0.01, **: ≤ 0.01–0.001 and ***: ≤ 0.001.
HDAC activity was inhibited in non-neoplastic and the 6 esophageal cancer cell lines (). This was most significant for treatment with MS-275, causing decreased HDAC activity down to 28–39% rest activity compared to vehicle treated cells (P = 0.07 to ≤ 0.001).
Subsequently, in Het-1A, OE21 and OE33 cells, histone H3 acetylation was induced by HDACi/AZA (Supplementary Fig. S3). Thereby, HDACi/AZA target levels were not directionally altered, except for a different regulation of DNMT1 in non-neoplastic (upregulation) and EAC (downregulation, P = 0.0428 − 0.0129), as well as a clear reduction of HDAC3 protein expression in ESCC cells (P = 0.04; Supplementary Fig. S4).
Thus, altered control of HDAC activity does not explain the distinct cellular responses of non-neoplastic and esophageal cancer cell lines to HDACi/AZA treatment, while cell line specific regulation of HDACi/AZA targets post treatment may add to this.
HDACi induce DNA damage, apoptosis and cell cycle arrest exclusively in esophageal cancer cells
To examine the basis of cancer cell specific loss of cell viability by HDACi/AZA treatment, induction of DNA damage, apoptosis, S-phase distribution and cell proliferation were next analyzed ().
Figure 5. HDACi/AZA treatment induces DNA damage, apoptosis and cell cycle arrest selectively in esophageal cancer cells. (A) DNA damage was assessed by COMET assays 24 h after addition of MS-275 and/or AZA, revealing induction of DNA damage in OE21 (AZA, MS-275-AZA) and OE33 (MS-275/AZA) cells. The total number of analyzed cells, respective COMETs, by CASP software V1.2.2 is given in the bars. (B) Measurement of apoptosis 72 h post HDACi and/or AZA treatment showed cancer cell selective effects, especially of combined MS-275 and AZA treatment in OE21 and OE33 cells. Apoptosis data is presented as percent of 10 000 recorded cells. (C) S phase distribution and (D) Ki-67 expression was analyzed 72 h post HDACi/AZA treatment. Abbreviations: C = control/DMSO treatment, A = AZA, S = SAHA, M = MS-275 and F = FK228. Shown is the mean ± SEM for 3 independent experiments. Obtained p-values were represented as *: 0.05–0.01 and **: ≤ 0.01–0.001.
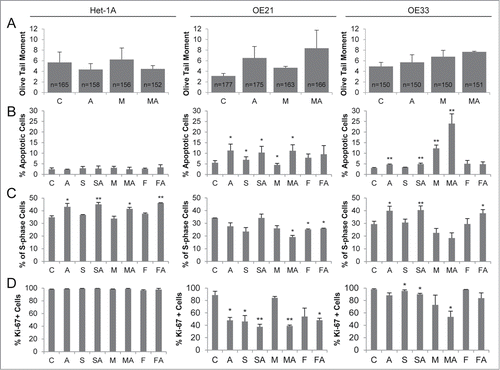
First, quantification of DNA strand breaks by COMET assay post AZA, MS-275, or MS-275/AZA treatment revealed a marked induction of DNA breaks in ESCC/OE21 and EAC/OE33 (, middle and right panels), but not in non-neoplastic/Het-1A cells ( left panel). A similar finding was recorded by analysis of DNA damage via p-H2A.X levels, showing increased p-H2A.X levels post AZA and particularly post all HDACi/AZA combinations in ESCC/OE21 and EAC/OE33, but not in non-neoplastic/Het-1A cells (Supplementary Fig. S5).
As expected from cell viability and DNA damage analyses, there was no significant apoptosis induction in non-neoplastic Het-1A cells by HDACi/AZA ( left panel). Instead, treatment of ESCC/OE21 or EAC/OE33 cells with AZA, HDACi, or HDACi/AZA significantly increased the number of apoptotic cells compared to control-treated cells (ESCC/OE21: MS-275/AZA up to 11.2%, P = 0.0164; EAC/OE33: MS-275 with 12.3%, P = 0.0031, and MS-275/AZA up to 24%, P = 0.0088; see middle and right panels).
Moreover, increased apoptosis in ESCC and EAC cells was accompanied by reduction of S-phase () and Ki-67-positive cells () post HDACi and/or AZA treatment. This effect was enhanced upon combined MS-275/AZA treatment, but was not seen for non-neoplastic/Het-1A cells. In addition, treatment with AZA or SAHA/AZA and FK288/AZA, which was mainly ineffective at the level of cell viability, only slightly altered S-phase and Ki-67-positivity.
Thus, the significant cancer cell-selective reduction of cell viability by HDACi/AZA treatment in ESCC and EAC cells is mediated via increased DNA damage, apoptosis induction, reduced proliferation, and cell cycle arrest. Non-neoplastic cells, with similar loss of HDAC activity upon HDACi/AZA treatment, are protected against these effects.
Azacytidine impairs migration specifically in tumor cell lines
To investigate whether HDACi/AZA treatment may also affect esophageal cancer cell migration, cell exclusion assays were next performed using conditions not affecting cell viability ().
Figure 6. Azacytidine impairs migration specifically in esophageal cancer cells. (A) Cell viability measurement 24 h post inhibitor treatment. Shown is the mean ± SEM for 3 independent experiments, performed in technical triplicates. (B) Cell migration was analyzed 24 h post inhibitor treatment by cell exclusion assay. Cell migration was quantified 24 h post MS-275/AZA addition. Data is represented as the log2 fold change of the cell free area (mean ± SEM) of 3 independent experiments. Representative images are shown in (C).
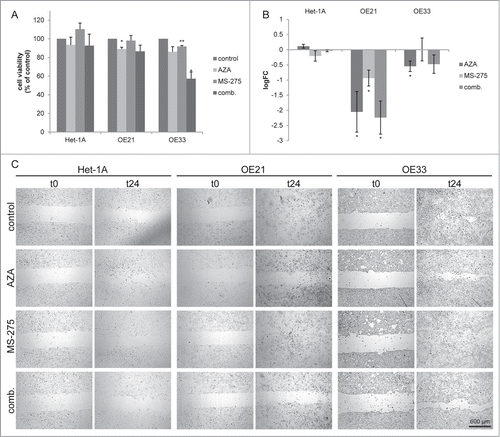
HDACi/AZA treatment had no effect on migration of non-neoplastic/Het-1A cells ( left panels). In contrast, ESCC and EAC cells showed decreased cell migration post MS-275/AZA treatment (), which was significant for ESCC/OE21 cells (P < 0.017) and was mostly related to effects of AZA.
Thus, non-neoplastic and esophageal cancer cells also differ in their responses to HDACi/AZA regarding cell migration.
Transcriptome analyses reveal distinct profiles of genes regulated by MS-275/AZA treatment in esophageal cancer cells
To identify genes regulated by HDACi/AZA treatment and thereby mirroring the different cellular outcomes of non-neoplastic and esophageal cancer cells, RNA transcriptome analyses were performed 24 h post treatment (; ).
Figure 7. RNA transcriptome analyses reveal differentially regulated genes by MS-275/AZA treatment. (A) The diagram represents the absolute numbers of significantly upregulated (red bars) and downregulated (green bars) genes for MS-275, AZA and their combination (comb.) compared to vehicle (DMSO) treated cells. (B) Number of genes regulated by MS-275/AZA treatment depicted by Venn diagram, showing joint or unique regulation between cell lines. Using the curated gene sets from the Consensus Path DB,Citation80 all gene sets related to apoptosis, drug metabolism, DNA replication and damage as well as cell cycle were extracted, depicting (C) upregulated and (D) downregulated gene sets from OE21, OE33 and Het-1A cell lines. (E) Regulation of CDKN1A/p21 mRNA in the present RNA transcriptome were confirmed (F) by qRT-PCR on mRNA and (G) by immunoblot on protein level for all 3 HDACi/AZA combinations. (H) ChIP analysis was performed 24 h post MS-275/AZA treatment with H3Ac and H3K4me3 followed by real-time PCR of the CDKN1A promotor. Data are represented as fold change of % input DNA (after normalization to H3) compared to vehicle (DMSO) treated cells (mean ± SEM).
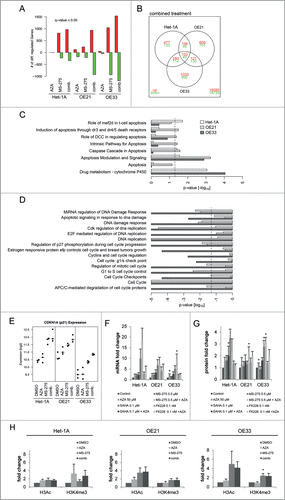
Table 1. Summary of TOP40 differentially regulated genes post MS-275/AZA treatment in esophageal cancer cells
Transcriptome analyses showed that AZA alone had only minor effects on gene expression, while MS-275 alone and specifically the MS-275/AZA combination induced high numbers of differentially up- or down-regulated genes (). Since combined MS-275/AZA treatment was shown to be especially effective against cancer cells (), the RNA transcriptome data was analyzed in detail for genes affected by combined MS-275/AZA treatment in both ESCC/OE21 and EAC/OE33, but not in non-neoplastic/Het-1A cells.
Thus, cancer cell specific genes affected by MS-275/AZA treatment included 251 significantly regulated genes, with 121 and 130 genes being up- and down-regulated, respectively (). shows the TOP40 of significantly up- or down-regulated genes. Functional analysis with gene-set enrichmentCitation38 between DMSO and MS-275/AZA treated cells elucidated the cancer cell specific cellular consequences after combined drug treatment. The bar plots clearly depict the significant upregulation of apoptotic pathways () and downregulation of DNA damage repair pathways and cell cycle progression () in OE21 and OE33 cells.
Since p21 is involved in cellular responses to HDACi/AZA treatment in other cancer types,Citation26 validation of RNA transcriptome data was first performed for p21. Indeed, p21/CDKN1A mRNA expression was upregulated by MS-275/AZA in non-neoplastic, ESCC and EAC cells (). This was further confirmed by qRT-PCR for MS-275/AZA as well as all other HDACi/AZA combinations, revealing an upregulation of p21 mRNA () and protein () expression in all 3 cell lines. At the protein level, this was only significant post MS-275/AZA treatment of ESCC/OE21 (P = 0.046) and EAC/OE33 (P = 0.0337) cells, again reflecting their cellular response. To confirm that these alterations were mediated via direct HDACi effects, the CDKN1A promotor was analyzed for global histone H3 acetylation (H3Ac) and histone H3 trimethylation at lysine 4 (H3K4me3) by ChIP (). Indeed, MS-275 or MS-275/AZA treatment increased H3Ac to 4-fold in both cancer cell lines, while H3K4me3 was preferentially upregulated by 2-fold in OE33 cells ( middle and left).
Thus, RNA transcriptome data was validated at the mRNA, protein and regulatory level for the known HDACi target p21/CDKN1A. Moreover, functional gene enrichment analysis of RNA transcriptome data reflected the cancer cell selective behavior of esophageal cancer cells.
Novel candidate genes involved in cancer cell specific responses to HDACi/AZA treatment
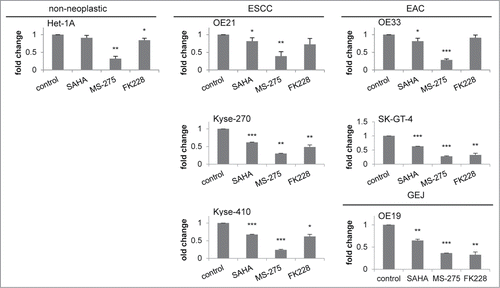
To further study the genes altered in parallel to the specific cellular responses of esophageal cancer cell lines upon HDACi/AZA treatment, selected genes from the RNA transcriptome TOP40 analysis (see ) were further validated by qRT-PCR post MS-275, AZA, or MS-275/AZA treatment (). For upregulated genes this was BCL6 (rank #2) and Hairy and enhancer of split 2/Hes2 (rank #27). For downregulated genes this was Fas apoptotic inhibitory molecule/FAIM (rank #4) and MLKL (rank #9).
Figure 8. Validation of novel candidate genes associated with specific response of esophageal cancer cells. RNA transcriptome data of 4 selected TOP40 genes is shown as expression levels post 24 h of HDACi/AZA treatment in the left panels. Results of validation by qRT-PCR for relative mRNA levels is shown in the right panels. Shown is the mean ± SEM for 3 independent experiments (right hand). (A) BCL6 (rank #2) and Hes2 (rank #27) were selected as upregulated genes and (B) FAIM (rank #4) and MLKL (rank #9) were selected as downregulated genes. Refer to for ranking of the TOP40 gene list.
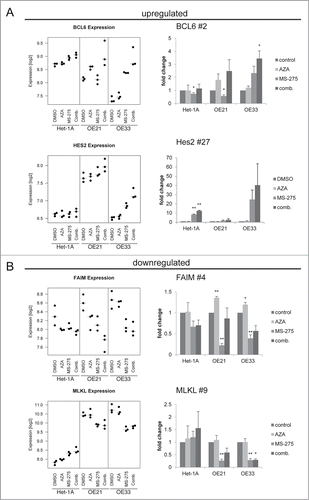
Indeed, BCL6 was specifically and significantly upregulated in ESCC/OE21 and EAC/OE33 (P = 0.0258), but not in non-neoplastic/Het-1A cells (P = 0.3563). Again, this was most prominent for combined HDACi/AZA treatment. Instead, Hes-2 was strongly upregulated in EAC/OE33, but not in ESCC/OE21. Non-neoplastic/Het-1A cells, however, also showed some Hes-2 regulation in HDACi/AZA treated cells by qRT-PCR. Furthermore, FAIM was downregulated in OE33 by combined MS-275/AZA treatment, whereas MS-275 alone showed the strongest downregulation in OE21. In addition, MLKL was specifically downregulated in ESCC/OE21 (P = 0.0032) and EAC/OE33 (P = 0.047) post combined MS-275 or MS-275/AZA.
Thus, qRT-PCR data confirm RNA transcriptome data for selected candidates specifically involved in the cellular responses of cancer, but not non-neoplastic cells to HDACi/AZA treatment.
Discussion
Epigenetic alterations are involved in the carcinogenesis and progression of esophageal cancers.Citation10-12 However, in contrast to hematologicCitation39-41 or some selected other gastrointestinal tract tumors,Citation42-44, the potential of epigenetic-based therapy has not yet been widely addressed in esophageal cancer. So far, treatment advances of the highly aggressive esophageal cancers are by surgery and radiochemotherapy.Citation5,8
In an exploratory setting, the present study examined the potential of targeting epigenetic modifiers in the 2 main clinico-pathological sub-types esophageal squamous cell carcinoma (ESCC) and esophageal adenocarcinoma (EAC). In contrast to previous studies in other cancer entities, analysis of human tissue specimens for HDAC1, HDAC2, HDAC3, and DNMT1 expression, as well as comprehensive analysis of both non-neoplastic and ESCC and EAC cell lines using treatment with the DNMT1 inhibitors AZA and DAC, three HDACi with different specificities and combined HDACi/AZA were tested. Furthermore, the present study addressed basic and cellular effects of the different treatments and performed extensive RNA transcriptome analyses to identify genes involved in mediating the specific cellular responses. By this, this study provides a novel comprehensive approach and insight into the epigenetic targeting of esophageal cancer.
As reported in part before by others,Citation13,14,45 HDAC1, HDAC2, and HDAC3 protein expression is frequent in esophageal carcinomas, both in the adjacent normal epithelial as well as in the cancer cells. At a first glance, this argues against HDACs being a valuable target and may explain why others before have not followed this further. Indeed, we also found similar HDAC expression patterns in our in vitro model with 7 cell lines, of which 6 reflected the spectrum of human esophageal cancers. Nevertheless, these still exhibited distinct and significant cancer cell-selective effects upon inhibition of the ubiquitous targets. Moreover, our analyses of human tissue specimens of esophageal cancers also suggested frequent histone H3 hypoacetylation, especially in ESCCs. Increased HDAC activity may account for this hypoacetylation, as again indicated by our in vitro analyses. Indeed, HDAC activity was uncoupled from HDAC expression in our in vitro analyses. In human esophageal cancers, fresh-frozen tissue specimens of patients not receiving neoadjuvant radiochemotherapy are required to perform these tests, but since the standard of care for most advanced esophageal cancers does not foresee this,Citation3 translational analysis of this aspect requires further prospective studies.
Irrespective of this, our immunohistochemical analysis showed that the actionable drug targets HDAC1, HDAC2, and HDAC3 are present in the clinico-pathological situation, providing one important basis for further exploitation of targeting epigenetic modifiers in esophageal cancer.
For this, the different types of HDAC inhibitors require detailed consideration, since some HDACi are broadly acting (e.g., SAHA), others show more specific HDAC targeting, like MS-275 or FK228 for class I HDACs.Citation16 So far, it is still unclear whether broad or more specific HDACi are more feasible for cancer cell treatment. In addition, HDACi with similar specificities may even differentially affect the same cancer cell model.Citation46 Therefore, parallel testing of several HDACi in the same cell model is important.
However, so far only few studies addressed the effect of single HDACi (for example, FK228 or TSA) on ESCC cells in vitro.Citation47–50 Importantly, there are no previous reports on HDACi testing in EAC cells with a therapeutic perspective. Hence, the present study is the first to demonstrate the effect of two DNMT inhibitors (AZA/DAC), broad (SAHA), and specific (MS-275, FK228) HDACi in three ESCC, two EAC, and one GEJ cell lines and comparing this to a non-neoplastic esophageal epithelial cell line (Het-1A).
As reported previously in other settings,Citation21,51 the two DNMT inhibitors AZA and DAC induced different responses in esophageal cancer cells. Hence, only AZA was further tested in combinations with HDACi in esophageal cancer cells.
Our subsequent comprehensive analysis clearly underlines the cancer-cell selectivity of HDACi/AZA treatment for robust cell death responses in ESCC and EAC cells, especially for MS-275/AZA. This was not seen for a cell line derived from a gastro-esophageal junction adenocarcinoma (OE19).Citation52
Specifically, so far only few other groups focusing on solid cancers have addressed the effects of HDACi on paired non-neoplastic and corresponding cancer cell lines, especially not for cells derived from the same epithelial origin.Citation33,43,53 For instance, Lee at al.Citation33 compared normal foreskin fibroblast to non-small cell lung cancer and prostate cancer cells—i.e. comparing cell lines from different cellular origins—for response to a single broad HDACi (SAHA). Similar, Qiu et al.Citation53 compared HDACi responses of primary neonatal foreskin fibroblasts to the cervical cancer cell line HeLa and human melanoma cell lines (MM96L, SK-Mel-13, A2058, MM229). Nevertheless, both studies also showed cell death upon HDACi treatment only in the transformed cancer cells, as seen in the present study of esophageal cancer cells.
Indeed, cancer cells are more vulnerable to HDACi due to their defects in DNA repair,Citation33 differences in gene regulation,Citation29 and/or their increased sensitivity to production of reactive oxygen species (ROS),Citation32 as compared to normal cells. Since we found both increased DNA damage as well as decreased DNA repair pathway regulation in esophageal cancer cell lines upon HDACi treatment, a mechanistic link between HDAC inhibition and altered DNA repair appears a conceivable explanation for the cancer cell selective effects. In contrast, non-neoplastic cells appear to be protected against HDACi by still functional cell cycle control and/or DNA repair mechanisms.Citation33,53 Moreover, ROS may also be involved in mediating protection against HDACi, since normal cells were shown to upregulate thioredoxin, which has anti-oxidant function and limits HDACi induced ROS accumulation.Citation32 In fact, when specifically looking for such genes in our RNA transcriptome data, there was a decrease of genes ensuring a stable redox environment (e.g., TXNRD2 or MSRA) in esophageal cancer cells only.
In order to identify novel candidate pathways and players altered between cellular responses of normal esophageal versus esophageal cancer cells, RNA transcriptome data was examined and validated in more detail for 2 up- and 2 downregulated genes. In fact, the transcriptional repressor BCL6, which was ranked #2 of the upregulated genes in esophageal cancer cells upon HDACi/AZA treatment, is an interesting candidate, although alterations of BCL6 are mainly associated with B-cell lymphomas.Citation54 Still, in this hematologic setting, altered acetylation limits the BCL6 associated function in recruiting histone deacetylases and sustaining its repressive functions, allowing cell transformation.Citation55 Indeed, BCL6 acetylation is controlled by HDAC- and SIRT-dependent mechanismsCitation55 and interference with this may lead to cell cycle arrest and apoptosis. Since we studied cancer cell lines in vitro, we can rule out possible contaminating effects, which might occur from lymphocytes when performing the same RNA transcriptome analysis from (non-microdissected) complex tissue specimens. Thus, BCL6 may represent a novel regulator also in esophageal cells.
In addition, the validated notch target gene Hes2Citation56 was significantly upregulated predominantly in OE33 cells post MS-275/AZA treatment. EAC tumors often show decreased Notch target gene expression via Cdx2 overexpression.Citation57,58 Notch signaling promotes esophageal keratinocyte differentiation and thereby is considered anti-oncogenic in esophageal cancers.Citation59 Indeed, the HDACi valproic acid was shown to re-activate Notch signaling in cancer cells via upregulation of Notch-1 and Notch targets like Hes1.Citation60,61 Thus, upregulated Hes-2 might point toward re-activation of Notch signaling in OE33 and subsequently influenced cell differentiation.
Of the validated genes significantly downregulated by HDACi/AZA treatment in esophageal cancer cells, the anti-apoptotic gene FAIM (rank #4)Citation62 and MLKL (rank #9) as mediator of selection between necroptosis and apoptosisCitation63 are of interest because they may influence the observed cell death of esophageal cancer cells. Indeed, this differential regulation of genes associated with apoptosis in non-transformed and malignant cells has been observed before.Citation29
Moreover, in view of our data on reduced cell migration in esophageal cancer cells upon MS-275/AZA treatment, the RNA transcriptome data showed that Poldip2 decreased exclusively post MS-275/AZA (TOP#21) in both cancer cells. Indeed, altered Poldip2 expression is known to hinder cell migration via interference with actin organization.Citation64
Finally, genes that were differentially regulated by MS-275/AZA treatment and were also linked to epigenetic regulation included a DNA helicase (RECQL4) associated with DNA damage response, as well as PHF13, targeting chromatin remodeling and DNA repair.Citation65,66
Thus, our in vitro analyses yield essential insight into novel candidate genes, which mediate the cancer cell specific effects of HDACi/AZA treatment in esophageal cancer cells. Clearly, detailed functional analyses of the specific altered molecular pathways and new candidates as well as preclinical in vivo studies are essential for transferring HDACi/AZA treatment into a more clinico-pathological setting. However, this is clearly beyond the scope of the present study. Simple xenografting of esophageal cancer cells probably may not yield adequate in vivo data that is closer to the clinical situation than in vitro analysis. It has to be considered that the frequent radiochemotherapy and complex tumor microenvironment for esophageal cancer patients, which at the present time may at all be considered for (epigenetic) targeted therapy, requires careful preclinical consideration. Thus, genetic mouse models of esophageal cancers, especially for both subtypes of ESCC and EAC, might be the best preclinical in vivo model system of choice, but these are rare.Citation67,68 Orthotopic transplantation as alternative mouse model seems to be possible, but also showed some drawbacks before.Citation69-72 For example, Gros and colleaguesCitation69 injected primary EAC cells into the submucosa of the abdominal esophagus by an invasive surgery technique, but only peritoneal carcinomatosis without formation of primary tumors was observed in this model. Still, our study provides a first comprehensive in vitro approach and insight to show cancer cell-selectivity for the entity of esophageal cancer by comparing non-neoplastic esophageal Het-1A cells to five esophageal and one GEJ cancer cell lines, providing a proof of principle concept.
In summary, this study revealed a cancer cell selective and synergistic effect of HDAC and DNMT1 inhibition, despite similar target expression in non-neoplastic and esophageal cancer cells in human tissue specimens and in vitro. Moreover, by identification of novel candidate genes involved in this process, the present study paves the way for further exploitation of detailed functional pathway analyses as well as future preclinical studies.
Methods
Tissue specimens of human esophageal cancer and immunohistochemistry
Formalin-fixed and Paraffin-embedded (FFPE) tissue specimens of 20 patients with esophageal carcinomas undergoing primary resection without neoadjuvant radiochemotherapy at the University Medical Center Freiburg were examined and was approved by institutional ethics regulations (#435/11). Immediate serial sections (3 μm) of tissue specimens were subjected to deparaffination, antigen retrieval and staining with appropriate antibodies (Supplementary Table S2). IHC was evaluated for nuclear positivity in normal esophageal epithelial cells and invasive tumor cells with following scores: Score 0 = negative, Score 1 = weak and/or heterogeneous protein expression in <70% cells, and Score 2 = strong expression and homogeneous in >70% cells.
Cell culture and inhibitor treatment
Esophageal cell lines Het-1A, OE21, Kyse-270, Kyse-410, OE33, OE19 and SKGT-4 (European Collection of Cell Cultures) were cultured as previously described.Citation73-75 Cell lines were verified by DNA fingerprinting/STR analysis for authenticity via the Leibniz-Institute DSMZ (July 2013; data available upon request), except Kyse-270 and Kyse-410. All drugs were purchased from Selleckchem (SAHA #S1047; MS-275 S1053; FK228 #S3020; AZA #S1782; DAC #S1200) and dissolved in DMSO. If not stated otherwise, 50 μM AZA, 0,1 μM SAHA, 0,5 μM MS-275 and 0,1nM FK228 were used.
Indirect immunofluorescence and Ki-67 quantification
Indirect immunofluorescence has been performed to standard protocols as reported by us before.Citation73 See Supplementary Table S2 for used primary antibodies. Ki-67 expression was determined by analysis on ScanˆR System from Olympus (Hamburg, Germany).
Immunoblotting
Protein isolation and immunoblotting was performed as described.Citation74,75 See Supplementary Table S2 for used antibodies. Bands were quantified by densitometry with ImageJ Version 1.46r.
HDAC activity assay
HDAC activity was quantified by HDAC Cell-Based Activity Assay Kit (Cayman Chemicals, # 600150) according to the manufacturer´s instruction. To dissect the influence of each HDACi on the general HDAC activity, HDACi were added 24 h prior to measurement.
Cell viability, cell cycle, and apoptosis
Cell viability (MTS assay), cell cycle by S-phase analysis (Edu proliferation assay) and apoptosis (Annexin V/PI staining) were determined 72 h post inhibitor treatment as described before.Citation75
COMET assay
DNA damage was quantified 24 h post treatment by COMET SCGE assay kit from Enzo Life sciences (ADI-900-166) according to the manufacturer´s instruction with adaption of used cell numbers to 3 × 10Citation5/mL. Comets were finally photographed by fluorescence microscopy for a minimum of 50 comets/condition and quantified by CASP software V1.2.2.Citation76
Cell migration
Migration was quantified by cell exclusion assay inserts of IBIDI (#80241). After removal of the insert, inhibitors were added and cell free gaps were photographed (time point t0). Same regions were again imaged 24 h later (t24). Data are represented as log2 fold change of the difference in the cell free area, quantified by Tscratch.Citation77
qRT-PCR
Total RNA was isolated 24 h post treatment by RNeasy® Mini Kit (Qiagen, #74106). cDNA synthesis was performed with iScript kit (Bio-Rad, #170–8891). qRT-PCR was performed using established protocolsCitation74 and mRNA expression levels were calculated by the comparative Ct method, normalized to the housekeeping gene TBP (for p21) or ß-Actin. Primers and probes are listed in Supplementary Table S3.
Chromatin Immunoprecipitation (ChIP)
ChIP experiments were performed as described before with slight modifications.Citation78,79 Chromatin (60 μg/IP) was pre-cleared for 1.5 h at 4°C and immunoprecipitated overnight at 4°C with the following antibodies: anti-H3K4me3 (Abcam, ab8580), anti-H3ac (Millipore, #06–599) and anti-H3 (Abcam, ab1791). Elution and de-crosslinking was performed overnight at 65°C in 1% SDS/0.1M NaHCO3, supplemented with 100 μg Proteinase K (Roche, #3115879001). After RNAse (Roche, #10109169001) treatment, DNA was purified with MinElute spin columns (Qiagen, #28006) and analyzed by RT-PCR with following primers for CDKN1A transcription start site: 5′-tctggggtctcacttcttgg-3′ and 5′-gagtcccaaataggggcagt-3′.
RNA Transcriptome analyses
Total RNA was isolated 24 h post vehicle/inhibitor treatment by RNeasy® Mini Kit (Qiagen, #74106) according to the manufacturer's instruction. Samples were then processed as described before.Citation74 Probe sets with known bad quality and without Entrez ID annotation were removed, resulting in 20811 EntrezID annotated genes used for analysis. Differential gene expression analysis between treatment groups was performed by an empirical Bayes approach providing moderated t-statistics. Gene expression data is available at GEO under the access ID GSE57130. The gene set enrichment analyses were performed using the GAGE algorithm,Citation38 which tests whether a gene set is highly ranked relative to other genes. For functional annotation we used genes sets from the Consensus Path DB.Citation80
Statistics
For all in vitro analyses 3 independent experiments were performed and corresponding diagrams show the mean ± SEM. Statistical testing was performed by student's t-test. Obtained P-values were represented as *: 0.05–0.01, **: ≤ 0.01–0.001 and ***: ≤ 0.001.
Disclosure of Potential Conflicts of Interest
No potential conflicts of interest were disclosed.
Author Contributions
Conception and design (TAh, SL), development of methodology (TAh, ST, JO, MF, MB, HB), acquisition of data (TAh, ST, JO, SH, JH, MF), analysis and interpretation of data (TAh, ST, MF, UH, MW, HB, MB, SL), writing, review and/or revision of the manuscript (TAh, SL with all coauthors), study supervision (SL).
Supplemental_Material.zip
Download Zip (400.1 KB)Acknowledgments
The authors greatly acknowledge the expert technical support of Ms. Anja Schoepflin and Mr. Fabian Beier (Institute of Surgical Pathology, University Medical Center Freiburg) and the Genomics and Proteomics Core Facility, German Cancer Research Center/DKFZ, Heidelberg, Germany. In addition, we thank Dr. Corinna Herz (Environmental Health Sciences and Hospital Infection Control, University Medical Center Freiburg) for the possibility of HDAC activity measurements.
Funding
The study was supported by the Deutsche Forschungsgemeinschaft (SFB992 grant C3 to SL; SFB850 grant Z1 to SL, HB and MB) and in part by the Mushett Family Foundation (Chester, NJ, USA; grant to SL, MW).
References
- Enzinger PC, Mayer RJ. Esophageal cancer. N Engl J Med 2003; 349:2241-52; PMID:14657432; http://dx.doi.org/10.1056/NEJMra035010
- Wijnhoven BP, Tran KT, Esterman A, Watson DI, Tilanus HW. An evaluation of prognostic factors and tumor staging of resected carcinoma of the esophagus. Ann Surg 2007; 245:717-25; PMID:17457164; http://dx.doi.org/10.1097/01.sla.0000251703.35919.02
- Cools-Lartigue J, Spicer J, Ferri LE. Current Status of Management of Malignant Disease: Current Management of Esophageal Cancer. J Gastrointest Surg 2015; PMID:25650163
- Shah PM, Gerdes H. Endoscopic options for early stage esophageal cancer. J Gastrointest Oncol 2015; 6:20-30; PMID:25642334
- Makowiec F, Baier P, Kulemann B, Marjanovic G, Bronsert P, Zirlik K, Henke M, Hopt UT, Hoeppner J. Improved long-term survival after esophagectomy for esophageal cancer: influence of epidemiologic shift and neoadjuvant therapy. J Gastrointest Surg 2013; 17:1193-201; PMID:23636882; http://dx.doi.org/10.1007/s11605-013-2212-7
- Makowiec F, Baier P, Kulemann B, Marjanovic G, Bronsert P, Zirlik K, Henke M, Hopt UT, Hoeppner J. Improved Long-Term Survival After Esophagectomy for Esophageal Cancer: Influence of Epidemiologic Shift and Neoadjuvant Therapy. J Gastrointest Surg 2013; 17(7):1193-201; PMID:23636882
- van Hagen P, Hulshof MC, van Lanschot JJ, Steyerberg EW, van Berge Henegouwen MI, Wijnhoven BP, Richel DJ, Nieuwenhuijzen GA, Hospers GA, Bonenkamp JJ, et al. Preoperative chemoradiotherapy for esophageal or junctional cancer. N Engl J Med 2012; 366:2074-84; PMID:22646630; http://dx.doi.org/10.1056/NEJMoa1112088
- Hoeppner J, Zirlik K, Brunner T, Bronsert P, Kulemann B, Sick O, Marjanovic G, Hopt UT, Makowiec F. Multimodal treatment of locally advanced esophageal adenocarcinoma: which regimen should we choose? Outcome analysis of perioperative chemotherapy versus neoadjuvant chemoradiation in 105 patients. J Surg Oncol 2014; 109:287-93; PMID:24277235; http://dx.doi.org/10.1002/jso.23498
- Kothari N, Almhanna K. Current status of novel agents in advanced gastroesophageal adenocarcinoma. J Gastrointest Oncol 2015; 6:60-74; PMID:25642339
- Ahrens TD, Werner M, Lassmann S. Epigenetics in esophageal cancers. Cell Tissue Res 2014; 356:643-55; PMID:24816987; http://dx.doi.org/10.1007/s00441-014-1876-y
- Kaz AM, Grady WM. Epigenetic biomarkers in esophageal cancer. Cancer Lett 2014; 342:193-9; PMID:22406828
- Alvarez H, Opalinska J, Zhou L, Sohal D, Fazzari MJ, Yu Y, Montagna C, Montgomery EA, Canto M, Dunbar KB, et al. Widespread hypomethylation occurs early and synergizes with gene amplification during esophageal carcinogenesis. PLoS Gen 2011; 7:e1001356
- Toh Y, Yamamoto M, Endo K, Ikeda Y, Baba H, Kohnoe S, Yonemasu H, Hachitanda Y, Okamura T, Sugimachi K. Histone H4 acetylation and histone deacetylase 1 expression in esophageal squamous cell carcinoma. Oncol Rep 2003; 10:333-8; PMID:12579268
- Langer R, Mutze K, Becker K, Feith M, Ott K, Hofler H, Keller G. Expression of class I histone deacetylases (HDAC1 and HDAC2) in oesophageal adenocarcinomas: an immunohistochemical study. J Clin Pathol 2010; 63:994-8; PMID:20924032; http://dx.doi.org/10.1136/jcp.2010.080952
- Zhao SL, Zhu ST, Hao X, Li P, Zhang ST. Effects of DNA methyltransferase 1 inhibition on esophageal squamous cell carcinoma. Dis esophagus 2011; 24:601-10; PMID:21539677; http://dx.doi.org/10.1111/j.1442-2050.2011.01199.x
- West AC, Johnstone RW. New and emerging HDAC inhibitors for cancer treatment. J Clin Investig 2014; 124:30-9; PMID:24382387; http://dx.doi.org/10.1172/JCI69738
- Yamashita K, Upadhyay S, Osada M, Hoque MO, Xiao Y, Mori M, Sato F, Meltzer SJ, Sidransky D. Pharmacologic unmasking of epigenetically silenced tumor suppressor genes in esophageal squamous cell carcinoma. Cancer Cell 2002; 2:485-95; PMID:12498717; http://dx.doi.org/10.1016/S1535-6108(02)00215-5
- Wang S, Liu H, Akhtar J, Chen HX, Wang Z. Alteration of runt-related transcription factor 3 gene expression and biologic behavior of esophageal carcinoma TE-1 cells after 5-azacytidine intervention. Asian Pac J Cancer Prev 2013; 14:5427-33; PMID:24175838; http://dx.doi.org/10.7314/APJCP.2013.14.9.5427
- Arai M, Imazeki F, Sakai Y, Mikata R, Tada M, Seki N, Shimada H, Ochiai T, Yokosuka O. Analysis of the methylation status of genes up-regulated by the demethylating agent, 5-aza-2'-deoxycytidine, in esophageal squamous cell carcinoma. Oncol Rep 2008; 20:405-12; PMID:18636205
- Butler LM, Agus DB, Scher HI, Higgins B, Rose A, Cordon-Cardo C, Thaler HT, Rifkind RA, Marks PA, Richon VM. Suberoylanilide hydroxamic acid, an inhibitor of histone deacetylase, suppresses the growth of prostate cancer cells in vitro and in vivo. Cancer Res 2000; 60:5165-70; PMID:11016644
- Venturelli S, Berger A, Weiland T, Essmann F, Waibel M, Nuebling T, Hacker S, Schenk M, Schulze-Osthoff K, Salih HR, et al. Differential induction of apoptosis and senescence by the DNA methyltransferase inhibitors 5-azacytidine and 5-aza-2'-deoxycytidine in solid tumor cells. Mol Cancer Ther 2013; 12:2226-36; PMID:23924947; http://dx.doi.org/10.1158/1535-7163.MCT-13-0137
- Duvic M, Vu J. Vorinostat: a new oral histone deacetylase inhibitor approved for cutaneous T-cell lymphoma. Exp Opin Investig Drugs 2007; 16:1111-20; PMID:17594194; http://dx.doi.org/10.1517/13543784.16.7.1111
- Prince HM, Dickinson M. Romidepsin for cutaneous T-cell lymphoma. Clin Cancer Res 2012; 18:3509-15; PMID:22535155; http://dx.doi.org/10.1158/1078-0432.CCR-11-3144
- Kaminskas E, Farrell AT, Wang YC, Sridhara R, Pazdur R. FDA drug approval summary: azacitidine (5-azacytidine, Vidaza) for injectable suspension. Oncologist 2005; 10:176-82; PMID:15793220; http://dx.doi.org/10.1634/theoncologist.10-3-176
- Thiagalingam S, Cheng KH, Lee HJ, Mineva N, Thiagalingam A, Ponte JF. Histone deacetylases: unique players in shaping the epigenetic histone code. Ann N Y Acad Sci 2003; 983:84-100; PMID:12724214; http://dx.doi.org/10.1111/j.1749-6632.2003.tb05964.x
- Richon VM, Sandhoff TW, Rifkind RA, Marks PA. Histone deacetylase inhibitor selectively induces p21WAF1 expression and gene-associated histone acetylation. Proc Natl Acad Sci U S A 2000; 97:10014-9; PMID:10954755; http://dx.doi.org/10.1073/pnas.180316197
- Ocker M, Schneider-Stock R. Histone deacetylase inhibitors: signalling towards p21cip1/waf1. Int J Biochem Cell Biol 2007; 39:1367-74; PMID:17412634; http://dx.doi.org/10.1016/j.biocel.2007.03.001
- LaBonte MJ, Wilson PM, Fazzone W, Groshen S, Lenz HJ, Ladner RD. DNA microarray profiling of genes differentially regulated by the histone deacetylase inhibitors vorinostat and LBH589 in colon cancer cell lines. BMC Med Genomics 2009; 2:67; PMID:19948057; http://dx.doi.org/10.1186/1755-8794-2-67
- Bolden JE, Shi W, Jankowski K, Kan CY, Cluse L, Martin BP, MacKenzie KL, Smyth GK, Johnstone RW. HDAC inhibitors induce tumor-cell-selective pro-apoptotic transcriptional responses. Cell Death Dis 2013; 4:e519; PMID:23449455; http://dx.doi.org/10.1038/cddis.2013.9
- Bolden JE, Peart MJ, Johnstone RW. Anticancer activities of histone deacetylase inhibitors. Nat Rev Drug Discov 2006; 5:769-84; PMID:16955068; http://dx.doi.org/10.1038/nrd2133
- Gao S, Mobley A, Miller C, Boklan J, Chandra J. Potentiation of reactive oxygen species is a marker for synergistic cytotoxicity of MS-275 and 5-azacytidine in leukemic cells. Leuk Res 2008; 32:771-80; PMID:18031811; http://dx.doi.org/10.1016/j.leukres.2007.09.007
- Ungerstedt JS, Sowa Y, Xu WS, Shao Y, Dokmanovic M, Perez G, Ngo L, Holmgren A, Jiang X, Marks PA. Role of thioredoxin in the response of normal and transformed cells to histone deacetylase inhibitors. Proc Natl Acad Sci U S A 2005; 102:673-8; PMID:15637150; http://dx.doi.org/10.1073/pnas.0408732102
- Lee JH, Choy ML, Ngo L, Foster SS, Marks PA. Histone deacetylase inhibitor induces DNA damage, which normal but not transformed cells can repair. Proc Natl Acad Sci U S A 2010; 107:14639-44; PMID:20679231; http://dx.doi.org/10.1073/pnas.1008522107
- Luszczek W, Cheriyath V, Mekhail TM, Borden EC. Combinations of DNA methyltransferase and histone deacetylase inhibitors induce DNA damage in small cell lung cancer cells: correlation of resistance with IFN-stimulated gene expression. Mol Cancer Ther 2010; 9:2309-21; PMID:20682643; http://dx.doi.org/10.1158/1535-7163.MCT-10-0309
- Nishioka C, Ikezoe T, Yang J, Udaka K, Yokoyama A. Simultaneous inhibition of DNA methyltransferase and histone deacetylase induces p53-independent apoptosis via down-regulation of Mcl−1 in acute myelogenous leukemia cells. Leuk Res 2011; 35:932-9; PMID:21550660; http://dx.doi.org/10.1016/j.leukres.2011.04.004
- Yang D, Torres CM, Bardhan K, Zimmerman M, McGaha TL, Liu K. Decitabine and vorinostat cooperate to sensitize colon carcinoma cells to Fas ligand-induced apoptosis in vitro and tumor suppression in vivo. J Immunol 2012; 188:4441-9; http://dx.doi.org/10.4049/jimmunol.1103035
- Chai G, Li L, Zhou W, Wu L, Zhao Y, Wang D, Lu S, Yu Y, Wang H, McNutt MA, et al. HDAC inhibitors act with 5-aza-2'-deoxycytidine to inhibit cell proliferation by suppressing removal of incorporated abases in lung cancer cells. PloS one 2008; 3:e2445; PMID:18560576; http://dx.doi.org/10.1371/journal.pone.0002445
- Luo W, Friedman MS, Shedden K, Hankenson KD, Woolf PJ. GAGE: generally applicable gene set enrichment for pathway analysis. BMC Bioinformatics 2009; 10:161; PMID:19473525; http://dx.doi.org/10.1186/1471-2105-10-161
- Rosato RR, Almenara JA, Grant S. The histone deacetylase inhibitor MS-275 promotes differentiation or apoptosis in human leukemia cells through a process regulated by generation of reactive oxygen species and induction of p21CIP1/WAF1 1. Cancer Res 2003; 63:3637-45; PMID:12839953
- Matthews GM, Lefebure M, Doyle MA, Shortt J, Ellul J, Chesi M, Banks KM, Vidacs E, Faulkner D, Atadja P, et al. Preclinical screening of histone deacetylase inhibitors combined with ABT-737, rhTRAIL/MD5-1 or 5-azacytidine using syngeneic Vk*MYC multiple myeloma. Cell Death Dis 2013; 4:e798; PMID:24030150; http://dx.doi.org/10.1038/cddis.2013.306
- Lainey E, Wolfromm A, Marie N, Enot D, Scoazec M, Bouteloup C, Leroy C, Micol JB, De Botton S, Galluzzi L, et al. Azacytidine and erlotinib exert synergistic effects against acute myeloid leukemia. Oncogene 2013; 32:4331-42; PMID:23085751; http://dx.doi.org/10.1038/onc.2012.469
- Ryu JK, Lee WJ, Lee KH, Hwang JH, Kim YT, Yoon YB, Kim CY. SK-7041, a new histone deacetylase inhibitor, induces G2-M cell cycle arrest and apoptosis in pancreatic cancer cell lines. Cancer Lett 2006; 237:143-54; PMID:16009488; http://dx.doi.org/10.1016/j.canlet.2005.05.040
- Zhan Y, Gong K, Chen C, Wang H, Li W. P38 MAP kinase functions as a switch in MS-275-induced reactive oxygen species-dependent autophagy and apoptosis in human colon cancer cells. Free Radic Biol Med 2012; 53:532-43; PMID:22634147; http://dx.doi.org/10.1016/j.freeradbiomed.2012.05.018
- Schneider-Stock R, Diab-Assef M, Rohrbeck A, Foltzer-Jourdainne C, Boltze C, Hartig R, Schonfeld P, Roessner A, Gali-Muhtasib H. 5-Aza-cytidine is a potent inhibitor of DNA methyltransferase 3a and induces apoptosis in HCT-116 colon cancer cells via Gadd45- and p53-dependent mechanisms. J Pharmacol Exp Ther 2005; 312:525-36; PMID:15547111; http://dx.doi.org/10.1124/jpet.104.074195
- Nakagawa M, Oda Y, Eguchi T, Aishima S, Yao T, Hosoi F, Basaki Y, Ono M, Kuwano M, Tanaka M, et al. Expression profile of class I histone deacetylases in human cancer tissues. Oncol Rep 2007; 18:769-74; PMID:17786334
- Chang J, Varghese DS, Gillam MC, Peyton M, Modi B, Schiltz RL, Girard L, Martinez ED. Differential response of cancer cells to HDAC inhibitors trichostatin A and depsipeptide. Br J Cancer 2012; 106:116-25; PMID:22158273; http://dx.doi.org/10.1038/bjc.2011.532
- Hoshino I, Matsubara H, Hanari N, Mori M, Nishimori T, Yoneyama Y, Akutsu Y, Sakata H, Matsushita K, Seki N, et al. Histone deacetylase inhibitor FK228 activates tumor suppressor Prdx1 with apoptosis induction in esophageal cancer cells. Clin Cancer Res 2005; 11:7945-52; PMID:16278420; http://dx.doi.org/10.1158/1078-0432.CCR-05-0840
- Hoshino I, Matsubara H, Akutsu Y, Nishimori T, Yoneyama Y, Murakami K, Komatsu A, Sakata H, Matsushita K, Ochiai T. Gene expression profiling induced by histone deacetylase inhibitor, FK228, in human esophageal squamous cancer cells. Oncol Rep 2007; 18:585-92; PMID:17671705
- Shoji M, Ninomiya I, Makino I, Kinoshita J, Nakamura K, Oyama K, Nakagawara H, Fujita H, Tajima H, Takamura H, et al. Valproic acid, a histone deacetylase inhibitor, enhances radiosensitivity in esophageal squamous cell carcinoma. Int J Oncol 2012; 40:2140-6; PMID:22469995
- Tzao C, Jin JS, Chen BH, Chung HY, Chang CC, Hsu TY, Sun GH. Anticancer effects of suberoylanilide hydroxamic acid in esophageal squamous cancer cells in vitro and in vivo. Dis Esophagus 2014; 27:693-702.
- Xie M, Jiang Q, Xie Y. Comparison Between Decitabine and Azacitidine for the Treatment of Myelodysplastic Syndrome: A Meta-Analysis With 1,392 Participants. Clin Lymphoma Myeloma Leuk 2015; 15:22-8.
- Rockett JC, Larkin K, Darnton SJ, Morris AG, Matthews HR. Five newly established oesophageal carcinoma cell lines: phenotypic and immunological characterization. Br J Cancer 1997; 75:258-63; PMID:9010035; http://dx.doi.org/10.1038/bjc.1997.42
- Qiu L, Burgess A, Fairlie DP, Leonard H, Parsons PG, Gabrielli BG. Histone deacetylase inhibitors trigger a G2 checkpoint in normal cells that is defective in tumor cells. Mol Biol Cell 2000; 11:2069-83; PMID:10848630; http://dx.doi.org/10.1091/mbc.11.6.2069
- Ye BH, Lista F, Lo Coco F, Knowles DM, Offit K, Chaganti RS, Dalla-Favera R. Alterations of a zinc finger-encoding gene, BCL−6, in diffuse large-cell lymphoma. Science 1993; 262:747-50; PMID:8235596; http://dx.doi.org/10.1126/science.8235596
- Bereshchenko OR, Gu W, Dalla-Favera R. Acetylation inactivates the transcriptional repressor BCL6. Nat Gen 2002; 32:606-13; PMID:12402037; http://dx.doi.org/10.1038/ng1018
- Iso T, Kedes L, Hamamori Y. HES and HERP families: multiple effectors of the Notch signaling pathway. J Cell Physiol 2003; 194:237-55; PMID:12548545; http://dx.doi.org/10.1002/jcp.10208
- Tamagawa Y, Ishimura N, Uno G, Yuki T, Kazumori H, Ishihara S, Amano Y, Kinoshita Y. Notch signaling pathway and Cdx2 expression in the development of Barrett's esophagus. Lab Investig 2012; 92:896-909; PMID:22449796; http://dx.doi.org/10.1038/labinvest.2012.56
- Vaninetti N, Williams L, Geldenhuys L, Porter GA, Guernsey DL, Casson AG. Regulation of CDX2 expression in esophageal adenocarcinoma. Mol Carcinog 2009; 48:965-74; PMID:19415720; http://dx.doi.org/10.1002/mc.20549
- Katoh M, Katoh M. Notch signaling in gastrointestinal tract (review). Int J Oncol 2007; 30:247-51; PMID:17143535
- Stockhausen MT, Sjolund J, Manetopoulos C, Axelson H. Effects of the histone deacetylase inhibitor valproic acid on Notch signalling in human neuroblastoma cells. Br J Cancer 2005; 92:751-9; PMID:15685243; http://dx.doi.org/10.1038/sj.bjc.6602309
- Greenblatt DY, Vaccaro AM, Jaskula-Sztul R, Ning L, Haymart M, Kunnimalaiyaan M, Chen H. Valproic acid activates notch-1 signaling and regulates the neuroendocrine phenotype in carcinoid cancer cells. Oncologist 2007; 12:942-51; PMID:17766653; http://dx.doi.org/10.1634/theoncologist.12-8-942
- Moubarak RS, Planells-Ferrer L, Urresti J, Reix S, Segura MF, Carriba P, Marques-Fernandez F, Sole C, Llecha-Cano N, Lopez-Soriano J, et al. FAIM-L is an IAP-binding protein that inhibits XIAP ubiquitinylation and protects from Fas-induced apoptosis. J Neurosci 2013; 33:19262-75; PMID:24305822; http://dx.doi.org/10.1523/JNEUROSCI.2479-13.2013
- Remijsen Q, Goossens V, Grootjans S, Van den Haute C, Vanlangenakker N, Dondelinger Y, Roelandt R, Bruggeman I, Goncalves A, Bertrand MJ, et al. Depletion of RIPK3 or MLKL blocks TNF-driven necroptosis and switches towards a delayed RIPK1 kinase-dependent apoptosis. Cell Death Dis 2014; 5:e1004; PMID:24434512; http://dx.doi.org/10.1038/cddis.2013.531
- Lyle AN, Deshpande NN, Taniyama Y, Seidel-Rogol B, Pounkova L, Du P, Papaharalambus C, Lassegue B, Griendling KK. Poldip2, a novel regulator of Nox4 and cytoskeletal integrity in vascular smooth muscle cells. Circ Res 2009; 105:249-59; PMID:19574552; http://dx.doi.org/10.1161/CIRCRESAHA.109.193722
- Singh DK, Karmakar P, Aamann M, Schurman SH, May A, Croteau DL, Burks L, Plon SE, Bohr VA. The involvement of human RECQL4 in DNA double-strand break repair. Aging Cell 2010; 9:358-71; PMID:20222902; http://dx.doi.org/10.1111/j.1474-9726.2010.00562.x
- Mund A, Schubert T, Staege H, Kinkley S, Reumann K, Kriegs M, Fritsch L, Battisti V, Ait-Si-Ali S, Hoffbeck AS, et al. SPOC1 modulates DNA repair by regulating key determinants of chromatin compaction and DNA damage response. Nucleic Acids Res 2012; 40:11363-79; PMID:23034801; http://dx.doi.org/10.1093/nar/gks868
- Opitz OG, Harada H, Suliman Y, Rhoades B, Sharpless NE, Kent R, Kopelovich L, Nakagawa H, Rustgi AK. A mouse model of human oral-esophageal cancer. J Clin Investig 2002; 110:761-9; PMID:12235107; http://dx.doi.org/10.1172/JCI0215324
- Quante M, Bhagat G, Abrams JA, Marache F, Good P, Lee MD, Lee Y, Friedman R, Asfaha S, Dubeykovskaya Z, et al. Bile acid and inflammation activate gastric cardia stem cells in a mouse model of Barrett-like metaplasia. Cancer Cell 2012; 21:36-51; PMID:22264787; http://dx.doi.org/10.1016/j.ccr.2011.12.004
- Gros SJ, Dohrmann T, Rawnaq T, Kurschat N, Bouvet M, Wessels J, Hoffmann RM, Izbicki JR, Kaifi JT. Orthotopic fluorescent peritoneal carcinomatosis model of esophageal cancer. Anticancer Res 2010; 30:3933-8; PMID:21036705
- Gros SJ, Dohrmann T, Peldschus K, Schurr PG, Kaifi JT, Kalinina T, Reichelt U, Mann O, Strate TG, Adam G, et al. Complementary use of fluorescence and magnetic resonance imaging of metastatic esophageal cancer in a novel orthotopic mouse model. Int J Cancer 2010; 126:2671-81; PMID:19847813
- Kuroda S, Kubota T, Aoyama K, Kikuchi S, Tazawa H, Nishizaki M, Kagawa S, Fujiwara T. Establishment of a Non-Invasive Semi-Quantitative Bioluminescent Imaging Method for Monitoring of an Orthotopic Esophageal Cancer Mouse Model. PloS One 2014; 9:e114562; PMID:25493557; http://dx.doi.org/10.1371/journal.pone.0114562
- Ohara T, Takaoka M, Sakurama K, Nagaishi K, Takeda H, Shirakawa Y, Yamatsuji T, Nagasaka T, Matsuoka J, Tanaka N, et al. The establishment of a new mouse model with orthotopic esophageal cancer showing the esophageal stricture. Cancer Lett 2010; 293:207-12; PMID:20153104; http://dx.doi.org/10.1016/j.canlet.2010.01.017
- Fichter CD, Herz C, Munch C, Opitz OG, Werner M, Lassmann S. Occurrence of multipolar mitoses and association with Aurora-A/-B kinases and p53 mutations in aneuploid esophageal carcinoma cells. BMC Cell Biol 2011; 12:13; PMID:21470402; http://dx.doi.org/10.1186/1471-2121-12-13
- Timme S, Ihde S, Fichter CD, Waehle V, Bogatyreva L, Atanasov K, Kohler I, Schopflin A, Geddert H, Faller G, et al. STAT3 expression, activity and functional consequences of STAT3 inhibition in esophageal squamous cell carcinomas and Barrett's adenocarcinomas. Oncogene 2014; 33:3256-66; PMID:23912451
- Fichter CD, Timme S, Braun JA, Gudernatsch V, Schopflin A, Bogatyreva L, Geddert H, Faller G, Klimstra D, Tang L, et al. EGFR, HER2 and HER3 dimerization patterns guide targeted inhibition in two histotypes of esophageal cancer. Int J Cancer 2014; 135:1517-30; PMID:24510732; http://dx.doi.org/10.1002/ijc.28771
- Konca K, Lankoff A, Banasik A, Lisowska H, Kuszewski T, Gozdz S, Koza Z, Wojcik A. A cross-platform public domain PC image-analysis program for the comet assay. Mutat Res 2003; 534:15-20; PMID:12504751; http://dx.doi.org/10.1016/S1383-5718(02)00251-6
- Geback T, Schulz MM, Koumoutsakos P, Detmar M. TScratch: a novel and simple software tool for automated analysis of monolayer wound healing assays. BioTechniques 2009; 46:265-74; PMID:19450233
- Shang Y, Myers M, Brown M. Formation of the androgen receptor transcription complex. Mol Cell 2002; 9:601-10; PMID:11931767; http://dx.doi.org/10.1016/S1097-2765(02)00471-9
- Hoffmeyer K, Raggioli A, Rudloff S, Anton R, Hierholzer A, Del Valle I, Hein K, Vogt R, Kemler R. Wnt/beta-catenin signaling regulates telomerase in stem cells and cancer cells. Science 2012; 336:1549-54; PMID:22723415; http://dx.doi.org/10.1126/science.1218370
- Kamburov A, Stelzl U, Lehrach H, Herwig R. The ConsensusPathDB interaction database: 2013 update. Nucleic Acids Res 2013; 41:D793-800; PMID:23143270; http://dx.doi.org/10.1093/nar/gks1055