
Abstract
DNA methylation plays an important role in disease etiology. The Illumina Infinium HumanMethylation450 (450K) BeadChip is a widely used platform in large-scale epidemiologic studies. This platform can efficiently and simultaneously measure methylation levels at ∼480,000 CpG sites in the human genome in multiple study samples. Due to the intrinsic chip design of 2 types of chemistry probes, data normalization or preprocessing is a critical step to consider before data analysis. To date, numerous methods and pipelines have been developed for this purpose, and some studies have been conducted to evaluate different methods. However, validation studies have often been limited to a small number of CpG sites to reduce the variability in technical replicates. In this study, we measured methylation on a set of samples using both whole-genome bisulfite sequencing (WGBS) and 450K chips. We used WGBS data as a gold standard of true methylation states in cells to compare the performances of 8 normalization methods for 450K data on a genome-wide scale. Analyses on our dataset indicate that the most effective methods are peak-based correction (PBC) and quantile normalization plus β-mixture quantile normalization (QN.BMIQ). To our knowledge, this is the first study to systematically compare existing normalization methods for Illumina 450K data using novel WGBS data. Our results provide a benchmark reference for the analysis of DNA methylation chip data, particularly in white blood cells.
Introduction
DNA methylation, where a methyl group is added to a cytosine or adenine DNA nucleotide, may result in the regulation of gene expression.Citation1 DNA methylation influences numerous biological processes, such as development and cell differentiation, and also plays a crucial role in the progress of complex diseases, including cancer and asthma.Citation2,3 Therefore, exploring the relation between this epigenetic variation and various phenotypes is increasingly favored in scientific research.
Nowadays, Illumina has developed the Infinium HumanMethylation450 BeadChip (450K) for profiling large-scale DNA methylation at single base resolution by genotyping the C/T polymorphism after sodium bisulfite treatment of DNA.Citation4 Unlike the previous version (27K), this new array incorporates 2 different chemical assays: (1) Infinium I (n = 135,501), which uses a single color with 2 different probes to generate methylated (M) and unmethylated (U) measurements for a specific CpG locus; and (2) Infinium II (n = 350,076), which uses a single probe with 2 different colors to obtain M and U signal intensities for a CpG locus. Although the 450K chip covers a large number of CpG methylation loci and, thus, can be used in high-throughput methylomic studies, such a special probe design causes potential problems for data analysis. A previous report showed that Type I and Type II probes usually have different distributions of methylation values, and that Type II probes are relatively less accurate and sensitive for detecting extreme methylation values.Citation5
Several methods and pipelines have been developed to preprocess the 450K array data, in order to adjust for probe type or color bias, subtract background signals, and eliminate systematic errors. For example, quantile normalization (QN), a well-established technique in analyzing gene expression data,Citation6 is often used to analyze the Illumina methylation array data. QN replaces the signal intensity of a probe with the mean intensity of the probes that have the same rank from all studied arrays, and thus makes the distribution of probe intensities from each array the same. In general, raw data should be preprocessed by color balance adjustment and background correction before QN. Yousefi et al. proposed a reference factor-based color channel normalization method called all sample mean normalization (ASMN), which used the mean of red/green control probe intensities of all samples to generate the reference normalization factors for the specific color channel and then normalized each sample accordingly.Citation7 Dedeurwaerder et al. proposed a peak-based correction (PBC) method to estimate the M-value peaks for Infinium I and II independently, and rescale the Infinium II values to match the Infinium I initial range.Citation5 Maksimovic et al. subsequently proposed a subset-quantile within array normalization (SWAN) method, which assumes that probes with the same number of CpGs should have the same intensity distribution regardless of their design types.Citation8 Touleimat and Tost also developed a categorical subset quantile normalization (SQN) method based on the assumption that probes belonging to the same CpG categories (CpG island, S shore, S shelf, N shore, N shelf, and distant) should have similar distributions.Citation9 Pidsley et al. then generated a combinational preprocessing framework that collected several relevant methods integrating background adjustment, between-array quantile normalization, and dye bias correction for M and U signals, and Infinium I and II separately; among them, a method named Dasen was the most recommended.Citation10 Teschendorff et al. published a β-mixture quantile normalization (BMIQ) method that decomposed the β profiles of Type I and Type II probes into 2 mixtures of 3 methylation states, and then quantile normalized the 3 distributions of Type II profile corresponding to those of Type I profile.Citation11
To date, it is unclear which of the proposed methods described above is best for preprocessing methylation data from the Illumina 450K BeadChip platform. To address this issue, several comparisons of different preprocessing approaches have been conducted,Citation12-14 mostly assessing reproducibility of technical replicates, reduction of probe design bias and the influence of downstream differential methylation analysis. As a result, BMIQ was the most recommended method, and Marabita et al. even preferred a QN plus BMIQ (QN.BMIQ) analysis pipeline, which first quantile-normalized the intensities of methylation signals among all arrays and then used BMIQ to normalize the β-values within each array.Citation13 However, almost all existing comparisons did not possess the true status of intracellular DNA methylation as a gold standard for comparison. Reproducibility of technical replicates only implies chip precision, but does not directly measure chip accuracy when the truth is unknown. More recently, sequencing-based technologies for genome-wide epigenetic profiling have emerged. In spite of their higher cost (compared to the array-based profiling), such technology is believed to better capture the true methylation level in cells with a higher resolution.Citation15 Hence, the sequencing data can be used for validating DNA methylation. Dedeurwaerder et al. and Marabita et al. have employed 2 bisulfite pyrosequencing (BPS) data sets as validation datasets to evaluate the analytic pipelines for 450K data, but they only have 352 and 15 BPS-450K matched CpG sites, which are far fewer than those in the 450K chip and the whole genome.Citation12,13
In this work, we performed whole-genome bisulfite sequencing (WGBS) on 4 white blood cell samples, which also have Illumina Infinium 450K array data available from an epigenetic study that includes 64 samples. We used the WGBS data as gold standard to compare the performance of normalizing the 450K data with 8 representative methods (i.e., QN, PBC, SWAN, SQN, Dasen, BMIQ, ASMN, and QN.BMIQ) on a genome-wide scale. To our knowledge, this is the first study to systematically compare normalization methods for the Illumina 450K methylation data using WGBS data. The comparative analyses on our data set indicate that PBC and QN.BMIQ-normalized 450K data are most consistent with the corresponding WGBS data.
Results
Comparison of raw and normalized 450K data with WGBS data
Comparison of CpG methylation levels
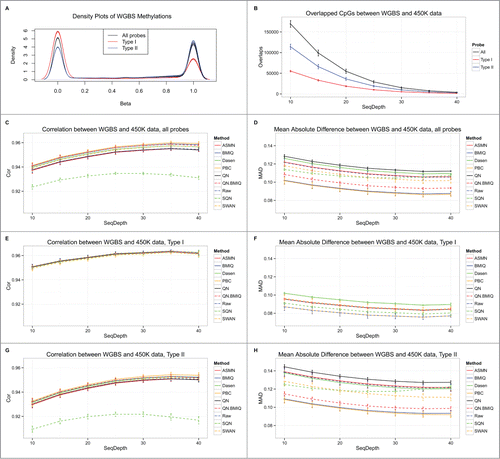
Bisulfite sequencing data has high precision and resolution, and can thus be used as the gold standard to validate array-based DNA methylation data. Our methylation dataset was composed of 4 samples, each having both 450K and WGBS data. For each sample, we used different cutoffs of sequence depth to filter out CpGs from the WGBS data, and calculated the Pearson correlation coefficient (PCC) for the β-values of overlapped CpGs between the WGBS data and each 450K data (raw and normalized). The 450K data for 64 samples were pooled together for normalization. The β-value distributions of WGBS CpGs that overlapped with CpGs obtained with the 450K platform showed 2 obvious peaks at low and high methylation levels, regardless of the type of probe used (Type I, Type II, or all; ). The number of overlapping CpGs between WGBS and 450K data decreased when the cutoff of sequencing depth increased (). The mean Pearson correlations or mean absolute differences (MAD) between WGBS and 450K data reached extreme values when the sequencing depth was about 35 (). Most of the normalized 450K data showed similar high correlations with WGBS data, except that produced by SQN (). Similar results were observed when using Spearman correlation for comparison (Fig. S1). MAD curves clearly show that 450K data normalized by PBC and BMIQ were closest to the gold standard WGBS data; QN.BMIQ also showed good performance (). Raw measures of Type I probe CpGs showed good consistency with the sequence data, yielding the smallest MADs compared to most normalized values. Note that BMIQ, PBC, and ASMN do not adjust the Type I probe data and therefore showed the same correlations and MADs with WGBS data (). However, many normalization approaches improved the correlation and MAD with WGBS for Type II probes, compared to the raw measures; among them, PBC, BMIQ, and QN.BMIQ showed the largest correlations and smallest MADs with the gold standard WGBS data ().
Figure 1. Comparison of different normalization methods for 450K data using WGBS data at a single CpG level. (A) β distributions of WGBS methylation data for CpGs that overlapped with those obtained using the 450K platform. (B) Numbers of overlapped CpGs between WGBS and 450K data when choosing different cutoffs of sequencing depth. Mean correlations between WGBS and each normalized 450K data for all overlapped 450K CpGs (C); for Type I probe CpGs (E); and for Type II probe CpGs (G). Mean absolute differences between WGBS data and each normalized 450K data for all overlapped 450K CpGs (D); for Type I probe CpGs (F); and for Type II probe CpGs (H).
Comparison of CpG methylation differences associated with phenotypes
The four samples, measured by both WGBS and 450K platforms in our data set, originated from 2 monozygotic twin pairs. In every pair of twins, one had asthma while the other one did not. We next compared the performances of these normalization methods in downstream differential methylation analysis. For each twin pair, we computed methylation differences by subtracting the methylation values of healthy samples from the values of asthmatic twin samples, and calculated PCCs of methylation differences between different normalization data and between each twin in the pair. The clustering diagram in shows that data from the same twin pair clustered together, suggesting that biological variation between samples are more significant than that introduced by different normalization methods. Furthermore, we calculated the methylation differences using the WGBS data, and compared the PCCs between WGBS data and normalized 450K data for each twin pair. The results show that the correlations of QN.BMIQ data rank top 3 in both sample pairs ().
Figure 2. Comparison of CpG methylation differences using different normalization methods for 450K data. (A) Cluster dendrogram of CpG methylation differences. Pearson correlation coefficient (PCC) between WGBS- and 450K-based methylation differences for sample.378 (B) and sample.911 (C).Overlaps between top differentially methylated CpGs between WGBS and each 450K-based data for sample.378 (D) and sample.911 (E).
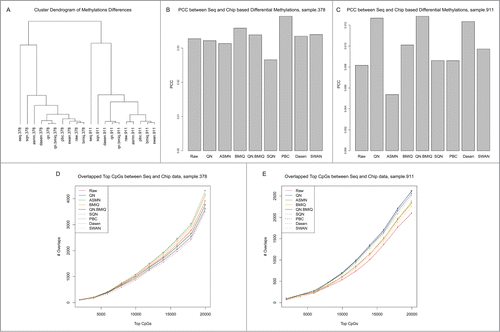
Next, we ranked the differentially methylated CpGs according to their absolute methylation differences, and counted the number of top CpGs that were overlapped in both WGBS and 450K data. We used 10 cutoffs from 2000 to 20000 to extract the top CpGs for comparisons. The results showed that the PBC normalized array data had the largest number of differentially methylated CpGs overlapping with those from the sequencing data in both twin pairs ().
Comparisons based on methylation regions
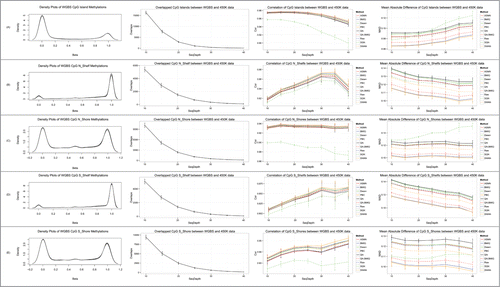
DNA methylation is usually studied in the context of DNA regions (such as CpG islands, shores, and shelves) rather than single CpG sites, largely because a group of adjacent CpGs that have concordant differential methylation patterns may indicate a robust and significant methylation event associated with phenotype.Citation16-18 On the other hand, the SQN method performs normalization based on different probe categories related to CpGs. Therefore, we aggregated CpGs methylation values into regional levels and compared them in the context of regions. According to 450K platform annotations, the measured CpG sites, which were contained in both 450K and WGBS data, belonged to 25,733 CpG islands, 11,536 N_shelves, 20,059 N_shores, 11,003 S_shelves, and 17,893 S_shores. We calculated the average β-value of the CpGs located in a specific CG region to be the regional methylation level and calculated their average sequencing coverage to be the regional coverage. We then compared those different normalization approaches with previous single-site based analyses. The correlations between WGBS data and 450K data normalized by PBC, BMIQ, and QN.BMIQ were larger, and their mean absolute differences were smaller, than after normalization by other methods. SQN still performed the worst, especially in the context of CpG islands and shores ().
Figure 3. Comparison of different normalization methods for 450K data using WGBS data on a CpG regional level. β distributions, numbers of overlapped CpGs, mean correlations, and mean absolute differences between WGBS and 450K data, for CpG Island (A), N_Shelf (B), N_Shore (C), S_Shelf (D), and S_Shore (E) regions.
Assessment of reduction of variability in technical replicates
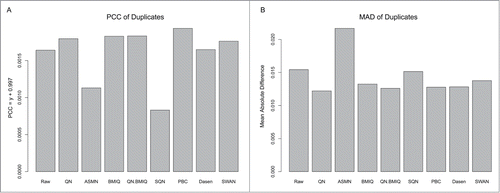
Using the 2 pairs of technical replicates in our data set, we assessed the reduction in variability between replicates following normalization with each method. shows that the PCCs of duplicates from PBC and QN.BMIQ-normalized 450K data are larger than for other methods, while those from ASMN and SQN-normalized data are actually smaller than those of raw data. Consistent results are shown in the MADs of duplicates: QN and QN.BMIQ data showed smaller MADs in replicate samples, while ASMN data showed even larger differences between technical replicates than original raw data (). These results are similar to those reported by Marabita et al and Dedeurwaerder et al. studies, where they also preferred the QN.BMIQ and PBC methods.Citation12,13
Figure 4. Comparison of variability reduction in technical replicates after using different normalization methods on 450K data. Pearson correlation coefficients (A) and mean absolute differences (B) between duplicate samples.
Reduction of probe type bias
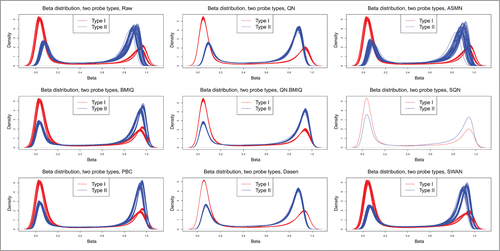
An important objective of normalizing the Illumina 450K data is to reduce the bias caused by the use of the 2 types of probes. Therefore, we drew density plots of methylation β-values for each sample using raw and normalized 450K data (), where the a red line represents the densities of Type I probes for a sample and a blue line represents the densities of Type II probes for a sample. It is shown that QN, ASMN, Dasen, and SWAN do not fully remove probe type bias; in contrast, QN.BMIQ, BMIQ, PBC, and SQN eliminate the bias between the 2 probe types. These results are similar to those reported by other researchers.Citation12-14 However, for SQN, although the bias is reduced, the correlation/difference between the WGBS and its normalized 450K data, and that between technical replicates, is severely compromised, which was already shown in the above analyses. Hence, PBC and QN.BMIQ could be the most efficient normalization methods.
Figure 5. Comparison of the reduction of probe type bias after different normalizations. Density distributions of 2 probe type data.
Discussion
The Illumina Infinium 450K arrays are now widely used in profiling large-scale intracellular DNA methylation levels in human epigenomic studies. Although many analytic methods and pipelines for data from this platform have been implemented, a consensus on preprocessing methods has not been reached. In this work, we used whole-genome bisulfite sequencing (WGBS) methylation data as gold standard to compare and evaluate the performance of 8 normalization methods for the 450K data on a genome-wide scale. In particular, microarray data from the 450K platform were obtained from 64 white blood cell samples, among which 4 samples were also measured by WGBS. WGBS data and differently normalized 450K data were compared to evaluate the performance of different normalization approaches. Our results suggest that PBC and QN.BMIQ normalization methods may outperform others when analyzing the Illumina Infinium 450K data.
Similar conclusions have been drawn by other studies. For example, Marabita et al. found the QN plus BMIQ method most effective among their 6 compared methods;Citation13 Dedeurwaerder et al. recommended the PBC method according to their comparative analyses;Citation12 Wu et al. found that raw data performed better than several normalization approaches.Citation14 Our observations are consistent with those reports, although from a novel perspective. However, Maksimovic et al. and Touleimat et al. reported that PBC did not work well when the methylation level distribution did not exhibit well-defined peaks;Citation8,9 Teschendorff et al. also showed that PBC could lead to discontinuities in Type II density distribution.Citation11 So the generalizability of our conclusions may need to be evaluated on data from other tissue types.
The significance of our work lies in using the WGBS data as a gold standard to evaluate the performance of normalizing 450K array data on a genome-wide scale. Previous reports were mainly focused on just a few CpG sites for sequencing-based validation, such as the small bisulfite pyrosequencing (BPS) data sets employed by Dedeurwaerder et al. and Marabita et al.Citation12,13 WGBS can capture cytosine methylation states on a whole-genome scale with high accuracy, especially when the sequencing depth is high.Citation19 Therefore, we generated a whole-genome DNA methylation data set with the WGBS technology, and used it as a gold standard to evaluate the corresponding 450K data normalized by different methods. To our knowledge, this is the first study to systematically compare normalization methods for the Illumina 450K methylation data using WGBS data.
We acknowledge several limitations of our study. First, the sequencing depth in our experiment is modest, ∼13× coverage per CpG site on average. Although we applied a higher cutoff to obtain more accurate measures from sequencing, this reduced the number of CpG sites to be compared. Also, our WGBS validation data set was small, and DNA methylation was only measured in white blood cells. The conclusions may need further confirmation on other tissue data. We also did not evaluate the impact of sequencing errors, which could bias the methylation levels measured by WGBS. However, considering the high cost of WGBS at the current time, the Illumina 450K methylation platform will remain a popular technology for large-scale DNA methylation profiling. Hence, our results will be valuable for the analysis of the 450K array data.
Materials and Methods
Illumina Infinium HumanMethylation450 data
We quantified DNA methylation levels in white blood cells from 64 children using the Illumina Infinium 450K platform. High quality DNA (750 ng) was bisulfite converted using EZ DNA methylation kit (Zymo Research, Irvine, CA). Bisulfite converted DNA (200 ng) was used for analysis of whole-genome methylation using the HumanMethylation 450K BeadChip (Illumina). In brief, bisulfite converted DNA was whole-genome amplified for 23 hours followed by end-point fragmentation. Fragmented DNA was precipitated, denatured, and hybridized to the BeadChips for 18 hours at 48°C. The BeadChips were washed and the hybridized primers were extended and labeled prior to scanning the BeadChips using the Illumina iScan system.
We read methylation data from the raw IDAT files using an R package named methylumi and calculated the β-value for each CpG as β = M/(M + U + α), where M and U represent methylated and unmethylated signal intensities at the specific site and α is an arbitrary offset (usually 100) intended to stabilize β-values where fluorescent intensities are low. Sometimes, people use another index called M-value to quantify the DNA methylation level, which is calculated as log2 [(M + α)/(U + α)]. In essence, the M-value is equivalent to a logit transformation of the β-value. Note that some normalization methods are performed on β-values and some are based on M-values.
Whole-genome bisulfite sequencing data
Four samples were used in the methyl-seq experiment. First, 750 ng of DNA were bisulfite bisulfite-converted using the EZ DNA methylation-lightning kit. The concentration of bisulfite-converted DNA was measured using quantifluor single stranded DNA system (Promega, San Luis Obispo, CA) on an Ascent Fluorometer (Thermofisher, Pittsburgh, PA). Bisulfite-converted DNA (50 ng) was used to create a methyl-seq library using Epigenome Methyl-Seq Kit (Epicentre – an Illumina company) according to the manufacturers’ protocol. In brief, cDNA was synthesized using random hexamer with tagging sequence. After digesting excess random primer, terminal tagging oligo (TTO) was added to the cDNA. The tagged cDNA was purified using AMpure XP system (Life Technologies, Grand Island, NY). The epigenome library was amplified (10 cycles) and then purified using AMpure XP system. The library was then quantified using high sensitivity DNA Chip (Agilent Technologies, Santa Clara, CA). The 200-cycle paired-end sequencing experiment was performed by a university facility core, which used Illumina HiSeq2000 and followed a standard protocol from the manufacturer's manual.
We utilized a tool named Bismark v0.12.5 to map the WGBS reads to human genome hg19 and perform methylation calls.Citation20 We then counted the number of methylated (observed as C) and unmethylated (observed as T) cytosines at each CpG and calculated its β-value as #C/(#C + #T). The generated β profile was regarded as the benchmark or gold standard of DNA methylation status of the 4 samples.
Normalization of the Infinium 450K data
We pooled the 450K data from 64 samples together as a data set and respectively preprocessed it with 8 representative methods (See ) to produce the normalized DNA methylation profiles.
Table 1. Normalization methods for Illumina 450K data
We implemented color balance adjustment, background correction, and quantile normalization (QN) with the R package lumi, which was designed to process the Illumina gene expression and methylation microarray.Citation21 The fuks, tost, BMIQ and dasen functions from the wateRmelon package were respectively utilized for normalizing the 450K data, which are after color and background corrections, based on the PBC SQN, BMIQ, and Dasen methods.Citation10 ASMN and SWAN were respectively implemented with the asmnCitation7 and minfiCitation22 packages, and QN.BMIQ was achieved by combining the 2 normalization methods with the help of lumi and wateRmelon packages.Citation13 All computational analyses were implemented with R 3.1.2 and all the packages of normalization were downloaded from Bioconductor 3.0.
From all raw and normalized 450K data, we filtered the SNP-containing probes that were annotated by the Illumina 450K platform and those unreliable probes that had at least one detectable P-value larger than 0.05. The remaining methylation profiles were used for our comparative analyses.
Disclosure of Potential Conflicts of Interest
No potential conflicts of interest were disclosed.
Figure_S1.docx
Download MS Word (243.9 KB)Funding
This study was supported by the Competitive Medical Research Fund (WC) from the University of Pittsburgh, and by grants HL07996 and HL117191 (JCC) from the US. National Institutes of Health.
Supplemental Material
Supplemental data for this article can be accessed on the publisher's website.
References
- Razin A, Riggs AD. DNA methylation and gene function. Science 1980; 210:604-10; PMID:6254144; http://dx.doi.org/10.1126/science.6254144
- Durham AL, Wiegman C, Adcock IM. Epigenetics of asthma. Biochim Biophys Acta 2011; 1810:1103-9; PMID:21397662; http://dx.doi.org/10.1016/j.bbagen.2011.03.006
- Jones PA. Functions of DNA methylation: islands, start sites, gene bodies and beyond. Nat Rev Genet 2012; 13:484-92; PMID:22641018; http://dx.doi.org/10.1038/nrg3230
- Bibikova M, Barnes B, Tsan C, Ho V, Klotzle B, Le JM, Delano D, Zhang L, Schroth GP, Gunderson KL, et al. High density DNA methylation array with single CpG site resolution. Genomics 2011; 98:288-95; PMID:21839163; http://dx.doi.org/10.1016/j.ygeno.2011.07.007
- Dedeurwaerder S, Defrance M, Calonne E, Denis H, Sotiriou C, Fuks F. Evaluation of the infinium methylation 450K technology. Epigenomics 2011; 3:771-84; PMID:22126295; http://dx.doi.org/10.2217/epi.11.105
- Bolstad BM, Irizarry RA, Astrand M, Speed TP. A comparison of normalization methods for high density oligonucleotide array data based on variance and bias. Bioinformatics 2003; 19:185-93; PMID:12538238; http://dx.doi.org/10.1093/bioinformatics/19.2.185
- Yousefi P, Huen K, Schall RA, Decker A, Elboudwarej E, Quach H, Barcellos L, Holland N. Considerations for normalization of DNA methylation data by Illumina 450K BeadChip assay in population studies. Epigenetics 2013; 8:1141-52; PMID:23959097; http://dx.doi.org/10.4161/epi.26037
- Maksimovic J, Gordon L, Oshlack A. SWAN: Subset-quantile within array normalization for illumina infinium HumanMethylation450 BeadChips. Genome Biol 2012; 13:R44; PMID:22703947; http://dx.doi.org/10.1186/gb-2012-13-6-r44
- Touleimat N, Tost J. Complete pipeline for Infinium((R)) Human Methylation 450K BeadChip data processing using subset quantile normalization for accurate DNA methylation estimation. Epigenomics 2012; 4:325-41; PMID:22690668; http://dx.doi.org/10.2217/epi.12.21
- Pidsley R, Y Wong CC, Volta M, Lunnon K, Mill J, Schalkwyk LC. A data-driven approach to preprocessing Illumina 450K methylation array data. BMC Genomics 2013; 14:293; PMID:23631413; http://dx.doi.org/10.1186/1471-2164-14-293
- Teschendorff AE, Marabita F, Lechner M, Bartlett T, Tegner J, Gomez-Cabrero D, Beck S. A beta-mixture quantile normalization method for correcting probe design bias in Illumina Infinium 450 k DNA methylation data. Bioinformatics 2013; 29:189-96; PMID:23175756; http://dx.doi.org/10.1093/bioinformatics/bts680
- Dedeurwaerder S, Defrance M, Bizet M, Calonne E, Bontempi G, Fuks F. A comprehensive overview of Infinium HumanMethylation450 data processing. Brief Bioinform 2013; 15(6):929-41; PMID:23990268
- Marabita F, Almgren M, Lindholm ME, Ruhrmann S, Fagerstrom-Billai F, Jagodic M, Sundberg CJ, Ekstrom TJ, Teschendorff AE, Tegner J, et al. An evaluation of analysis pipelines for DNA methylation profiling using the Illumina HumanMethylation450 BeadChip platform. Epigenetics 2013; 8:333-46; PMID:23422812; http://dx.doi.org/10.4161/epi.24008
- Wu MC, Joubert BR, Kuan PF, Haberg SE, Nystad W, Peddada SD, London SJ. A systematic assessment of normalization approaches for the Infinium 450K methylation platform. Epigenetics 2014; 9:318-29; PMID:24241353; http://dx.doi.org/10.4161/epi.27119
- Harris RA, Wang T, Coarfa C, Nagarajan RP, Hong C, Downey SL, Johnson BE, Fouse SD, Delaney A, Zhao Y, et al. Comparison of sequencing-based methods to profile DNA methylation and identification of monoallelic epigenetic modifications. Nat Biotechnol 2010; 28:1097-105; PMID:20852635; http://dx.doi.org/10.1038/nbt.1682
- Bell JT, Tsai PC, Yang TP, Pidsley R, Nisbet J, Glass D, Mangino M, Zhai G, Zhang F, Valdes A, et al. Epigenome-wide scans identify differentially methylated regions for age and age-related phenotypes in a healthy ageing population. PLoS Genet 2012; 8:e1002629; PMID:22532803; http://dx.doi.org/10.1371/journal.pgen.1002629
- Irizarry RA, Ladd-Acosta C, Wen B, Wu Z, Montano C, Onyango P, Cui H, Gabo K, Rongione M, Webster M, et al. The human colon cancer methylome shows similar hypo- and hypermethylation at conserved tissue-specific CpG island shores. Nat Genet 2009; 41:178-86; PMID:19151715; http://dx.doi.org/10.1038/ng.298
- Shiota K. DNA methylation profiles of CpG islands for cellular differentiation and development in mammals. Cytogenet Genome Res 2004; 105:325-34; PMID:15237220; http://dx.doi.org/10.1159/000078205
- Smith ZD, Gu H, Bock C, Gnirke A, Meissner A. High-throughput bisulfite sequencing in mammalian genomes. Methods 2009; 48:226-32; PMID:19442738; http://dx.doi.org/10.1016/j.ymeth.2009.05.003
- Krueger F, Andrews SR. Bismark: a flexible aligner and methylation caller for Bisulfite-Seq applications. Bioinformatics 2011; 27:1571-2; PMID:21493656; http://dx.doi.org/10.1093/bioinformatics/btr167
- Du P, Kibbe WA, Lin SM. lumi: a pipeline for processing Illumina microarray. Bioinformatics 2008; 24:1547-8; PMID:18467348; http://dx.doi.org/10.1093/bioinformatics/btn224
- Aryee MJ, Jaffe AE, Corrada-Bravo H, Ladd-Acosta C, Feinberg AP, Hansen KD, Irizarry RA. Minfi: a flexible and comprehensive Bioconductor package for the analysis of Infinium DNA methylation microarrays. Bioinformatics 2014; 30:1363-9; PMID:24478339; http://dx.doi.org/10.1093/bioinformatics/btu049