
Abstract
The TET family of dioxygenases (TET1/2/3) can convert 5-methylcytosine (5mC) into 5-hydroxymethylcytosine (5hmC) and has been shown to be involved in active and passive DNA demethylation. Here, we demonstrate that altering TET dioxygenase levels within physiological range can affect DNA methylation dynamics of HEK293 cells. Overexpression of TET1 increased global 5hmC levels and was accompanied by mild DNA demethylation of promoters, gene bodies and CpG islands. Conversely, the simultaneous knockdown of TET1, TET2, and TET3 led to decreased global 5hmC levels and mild DNA hypermethylation of above-mentioned regions. The methylation changes observed in the overexpression and knockdown studies were mostly non-reciprocal and occurred with different preference depending on endogenous methylation and gene expression levels. Single-nucleotide 5hmC profiling performed on a genome-wide scale revealed that TET1 overexpression induced 5mC oxidation without a distribution bias among genetic elements and structures. Detailed analysis showed that this oxidation was related to endogenous 5hmC levels. In addition, our results support the notion that the effects of TET1 overexpression on gene expression are generally unrelated to its catalytic activity.
Abbreviations
| 5caC | = | 5-carboxylcytosine |
| 5fC | = | 5-formylcytosine |
| 5hmC | = | 5-hydroxymethylcytosine |
| 5mC | = | 5-methylcytosine |
| CGI | = | CpG island |
| DNMT | = | DNA methyltransferase |
| FDR | = | false discovery rate |
| FLAG-tag | = | a polypeptide protein tag |
| Flp-In™ T-REx™-293 | = | a commercial HEK293 cell line |
| GAPDH | = | glyceraldehyde-3-phosphate dehydrogenase |
| GFP | = | green fluorescent protein |
| HEK293 cells | = | human embryonic kidney 293 cells |
| qRT-PCR | = | quantitative RT-PCR |
| RRHP | = | reduced representation 5-hydroxymethylcytosine profiling |
| shRNA | = | small hairpin RNA |
| siRNA | = | small interfering RNA |
| TET | = | ten-eleven translocation protein family |
Introduction
In mammals, DNA methylation at the 5-position of cytosine residues occurs predominantly in the context of CpG dinucleotides and is generally associated with transcriptional repression.Citation1,2 It is essential for normal development and involved in various cellular processes, such as genomic imprinting, X chromosome inactivation, tissue-specific gene expression, and silencing of repetitive DNA.Citation3,4 While CpG sites are underrepresented throughout the genome and tend to be methylated, there are CpG-rich regions termed CpG islands (CGIs), which are generally unmethylated. They often cover transcriptional start sites and approximately 70% of annotated gene promoters are associated with a CGI.Citation5 Genomic methylation patterns are dynamic during development and disturbed in various diseases, such as cancer, imprinting-related diseases, and psychiatric disorders.Citation6-9 Methylation patterns are established by the de novo DNA methyltransferases DNMT3A and DNMT3B and are accurately maintained through cell division by the maintenance methyltransferase DNMT1.Citation10 In contrast to its establishment, less is known about the enzymes and pathways involved in DNA demethylation.
The recent discovery that the ten-eleven translocation (TET) family of dioxygenases can iteratively convert 5-methylcytosine (5mC) into 5-hydroxymethylcytosine (5hmC), 5-formylcytosine (5fC), and 5-carboxylcytosine (5caC) has provided a mechanism for the initiation of active and passive DNA demethylation.Citation11-19 The TET enzyme family consists of 3 members (TET1, TET2, and TET3) that originate from a common ancestor gene by triplicationCitation20 and that have been shown to play important roles at different stages of development and in reprogramming of differentiated cells.Citation21 Due to their partially overlapping expression patterns during early development and viable Tet1 and Tet2 single-knockout mice, a certain degree of functional redundancy between Tet1 and Tet2 has been proposed.Citation22,23 Compensatory effects among the Tet enzymes were further supported by a study with Tet1/Tet2 double-knockout mouse embryos. Although the majority of double-mutant embryos died perinatally, a fraction survived to overtly normal adult mice probably due to compensation by Tet3.Citation24 Moreover, a study investigating the effects of individual TET depletions in a pluripotent carcinoma model identified many overlapping TET target loci suggesting a synergistic role of the TET enzymes.Citation25 Although the TET enzymes are expressed to varying degrees in somatic cells,Citation26-28 only a few studies have addressed their role in DNA methylation regulation in differentiated cells. Two reports demonstrated that TET1 overexpression in HEK293 cells caused DNA demethylation of reporter plasmids and endogenous genomic loci.Citation11,29 However, both studies overexpressed only the catalytic domain of TET1, which might miss important regulatory domains and might not reflect the wild type situation. Indeed, a recent study by Jin and colleaguesCitation30 showed that overexpression of the TET1 catalytic domain induced massive global DNA demethylation in HEK293T cells whereas overexpression of full-length TET1 had only minimal global effects. Using shRNA-mediated knockdown of TET1, the authors demonstrated that TET1 can act as a maintenance DNA demethylase preventing methylation spreading from methylated edges into hypomethylated CGIs.
Here, we demonstrate that TET expression levels altered within physiological range can influence DNA methylation dynamics in HEK293 cells. TET1 overexpression increased global 5hmC levels and caused mild DNA hypomethylation of promoters, gene bodies and CGIs, whereas TET triple knockdown led to decreased global 5hmC levels and mild hypermethylation of such regions. The methylation changes were mostly non-reciprocal between the overexpression and knockdown studies and occurred with different preference depending on endogenous methylation and gene expression levels. Reduced representation 5-hydroxymethylcytosine profilingCitation31 (RRHP) revealed that TET1 overexpression induced 5mC oxidation without a distribution bias among genetic elements and structures, but that this oxidation was related to endogenous 5hmC levels.
Results
TET1 overexpression induces DNA hypomethylation whereas TET triple knockdown induces DNA hypermethylation in HEK293 cells
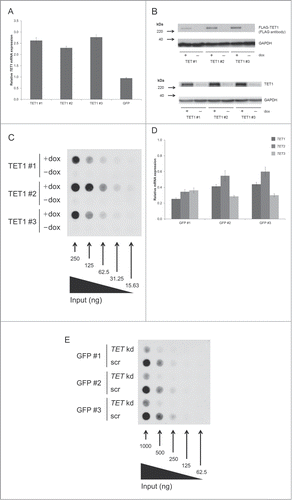
We used the Flp-In™ T-REx™-293 host cell line to generate 3 stable HEK293 cell lines exhibiting doxycycline-inducible expression of FLAG-tagged TET1. Doxycycline induction for 48 h revealed a ∼2.5-fold mRNA overexpression of TET1 in all 3 cell lines (). Western blots confirmed the expression of tagged TET1 protein and showed strongly increased TET1 protein levels (). The increase of total TET1 protein levels in induced cells exceeded the 2.5-fold increase of TET1 mRNA, which might be due to a different stability of mRNA and protein. DNA dot blot assays demonstrated a strong increase of 5hmC in induced cells compared to absent 5hmC signals in uninduced control cells (). Complementary to the overexpression of TET1, we performed the simultaneous knockdown of TET1, TET2, and TET3. This triple knockdown should help compensate for a possible redundancy among the different TET enzymes. The siRNA-mediated knockdown was carried out for 96 h in 3 Flp-In™ T-REx™-293 cell lines that had an integrated copy of GFP instead of FLAG-tagged TET1. These cells were cultivated in the absence of doxycycline, and for most cell lines and TET transcripts we could achieve a knockdown efficiency of more than ∼60% compared to the scrambled controls (). DNA dot blot assays indicated a strong decrease of global 5hmC levels after TET knockdown (). During the overexpression and knockdown studies, we did not observe any obvious changes in cell morphology or growth rate when comparing treated cell lines with their respective controls. Analysis of endogenous TET expression levels relative to GAPDH expression revealed low basal levels of TET enzyme expression in HEK293 control cells ranging from 0.42% of GAPDH expression for TET1 and 0.36% for TET3 down to 0.09% for TET2 transcripts (Fig. S1).
Figure 1. TET1 overexpression and TET triple knockdown affect global 5hmC levels of HEK293 cells. (A) Quantitative real-time RT-PCR of induced vs. uninduced T-REx-293-TET1 cell lines demonstrates elevated TET1 mRNA levels after doxycycline induction of transgene expression. T-REx-293-GFP control cells (GFP) do not show elevated TET1 transcript levels upon induction. Measurements were performed in duplicates and presented as mean ± SD. (B) Western blot analysis of FLAG-tagged TET1 overexpression in T-REx-293-TET1 cell lines in induced and uninduced state with anti-FLAG (upper part) and anti-TET1 antibodies (lower part) shows inducible expression of TET1. (C) DNA dot blot analysis shows increased global 5hmC levels in induced compared to uninduced T-REx-293-TET1 cells. (D) Quantitative real-time RT-PCR demonstrates reduced TET transcript levels in T-REx-293-GFP cell lines treated with siRNAs against TET1, TET2 and TET3 when compared to scrambled controls. Measurements were performed in triplicates and presented as mean ± SD. (E) DNA dot blot analysis shows decreased global 5hmC levels in TET triple knockdown (TET kd) compared to scrambled control (scr) T-REx-293-GFP cell lines. TET1 #1–3: single-cell derived T-REx-293-TET1 cell lines; GFP #1–3: single-cell derived T-REx-293-GFP cell lines; +dox: doxycycline- induced transgene expression; -dox: uninduced control.
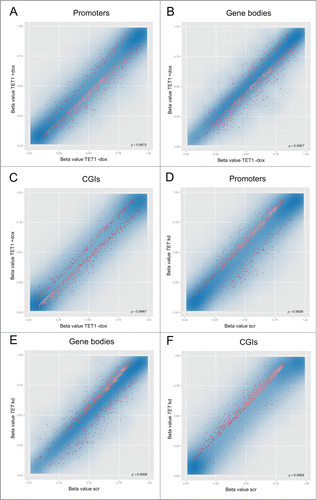
We investigated whether TET1-mediated 5mC oxidation leads to genomic DNA demethylation and, if in contrast to this, the triple knockdown of the TET enzymes leads to an increase of genomic 5mC levels due to reduced demethylation activity. To this end, Infinium HumanMethylation450 BeadChip analyses were performed on DNA extracted from the TET1 overexpression and TET triple knockdown experiments. As these assays are based on bisulfite treatment of sample DNA, the oxidation products of the TET enzymes can complicate the data interpretation: 5hmC gives the same readout as 5mC while 5fC and 5caC give the same readout as unmodified cytosine.Citation32-34 For TET1 overexpression this means that we cannot specifically measure an increase of 5hmC. Although the oxidation of 5mC to 5hmC cannot be detected by BeadChip analyses, we note that it is an important epigenetic process as 5hmC is enriched at gene bodies, which positively correlates with gene expression in many mammalian cell types.Citation20 However, the BeadChips are capable of detecting DNA demethylation events, since “unmethylated” signals are much more likely to be unmodified cytosines rather than 5fC/5caC due to the low abundance of these modified bases, which is typically one to several orders of magnitude lower than that of 5mC.Citation15 It has been reported that the transient overexpression of the Tet2 catalytic domain in HEK293 cells increased the genomic content of 5hmC and also led to elevated 5fC/5caC levels.Citation15 Although our cell system is characterized by a modest overexpression of full-length TET1, we cannot rule out that elevated levels of 5fC/5caC exist that might to a certain degree interfere with the interpretation of demethylation data. In contrast, if we see a methylation increase after the triple knockdown of the TET enzymes, then this is presumably due to increased 5mC levels. Taken together, the BeadChips, although being based on bisulfite analysis, are suitable of detecting the questioned methylation changes in both experiments. Data analysis using the RnBeads software package revealed that TET1 overexpression caused slight DNA demethylation in gene promoters, gene bodies and CGIs. While the affected regions showed a wide range of initial methylation levels, there was a higher preference for those gene promoters and gene bodies with intermediate methylation levels (). In contrast, TET1 overexpression preferentially caused demethylation in already sparsely methylated CGIs (). The triple knockdown of the TET enzymes led to slight methylation increases in promoters, gene bodies and CGIs (). The affected regions also showed a wide range of initial methylation levels, but there was a clear preference for those promoters, gene bodies and CGIs with a higher degree of methylation. Details on the depicted 1,000 best ranking regions are provided in Tables S1–S6.
Figure 2. TET1 overexpression and TET triple knockdown affect DNA methylation levels of HEK293 cells. Shown are comparisons of mean methylation β values for different genomic regions after induced overexpression of TET1 (TET1 +dox; A–C) and triple knockdown of the TET enzymes (TET kd; D–F) compared to the respective uninduced (TET1 -dox) or scrambled controls (scr). The methylation status of more than 450,000 CpG sites was measured by Illumina Infinium HumanMethylation450 BeadChips and quantitatively analyzed on the region level for the 3 replicate cell lines of each experiment. The transparent blue areas correspond to point density with the 1% of the points in the sparsest populated plot regions drawn explicitly. The 1,000 best ranking differentially methylated promoters (A, D), gene bodies (B, E) and CGIs (C, F) are represented by red dots. ρ = Pearson correlation coefficient.
Small numbers of reciprocal methylation changes among top-ranked promoters, gene bodies and CGIs
We prepared candidate lists of the 500 top-ranked CGIs and top-ranked, gene symbol-associated promoters and gene bodies that were identified in the overexpression and knockdown studies (Tables S7–S12). In line with the analyses described above, the majority of these top-ranked regions showed a methylation decrease after TET1 overexpression and a methylation increase after TET triple knockdown (). Gene ontology overrepresentation tests (Table S13) of promoters and gene bodies that were hypomethylated after TET1 overexpression revealed enrichment related to the field of sensory perception. In contrast, promoters hypermethylated after TET knockdown were enriched in the category “immune system process” while hypermethylated gene bodies were enriched in the category “system development” and categories related to biological regulation, including the regulation of transcription from RNA polymerase II promoters. Promoter-associated CGIs that were hypomethylated in the overexpression or hypermethylated in the knockdown study did not show any significant enrichment.
Figure 3. Reciprocal methylation changes of TET1 overexpression and TET triple knockdown. Shown are the distributions of the 500 top-ranked differentially methylated promoters, gene bodies, and CGIs toward hypo- (↓) and hyper-methylation (↑). In general, TET1 overexpression was associated with DNA hypomethylation while TET knockdown was associated with DNA hypermethylation (both in bold). Overlaps are shown in the right hand column.
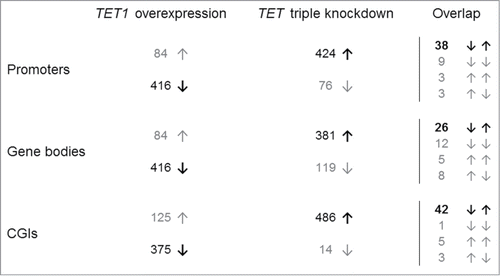
Next, we compared the candidate lists from both studies to identify reciprocal methylation changes (). Details on consistently identified promoters, gene bodies and CGIs are provided in Tables S14–S16. Of the top 500 differentially methylated gene promoters, 38 showed decreased methylation induced by TET1 overexpression (range −4 to −23%) in combination with increased methylation after TET triple knockdown (range +7 to +24%). Fifteen other promoters overlapped among both top lists, but showed methylation changes to other directions. Among the 500 top-ranked gene bodies of both studies, 26 showed reciprocal methylation changes as described above while further 25 gene bodies exhibited methylation changes to other directions. Similar to gene promoters, 42 CGIs showed decreased methylation after TET1 overexpression and increased methylation after TET triple knockdown. Here, 9 further CGIs were identified in both top lists but showed other methylation dynamics. Interestingly, only 8 of the 42 CGIs overlapped with the gene promoters that showed reciprocal methylation changes. Gene ontology analyses of promoters, gene bodies, and CGIs with reciprocal methylation changes did not reveal over- or underrepresented biological processes (Table S17). Only 3 gene promoters, corresponding CGIs and gene bodies had a total overlap of reciprocal effects (DUSP26, ZNF597, and ZNF619). Although TET1 overexpression and TET triple knockdown generally caused opposite methylation changes at gene promoters, gene bodies and CGIs there were only limited reciprocal effects among the top-ranking target regions.
TET1 overexpression and TET triple knockdown have promoter methylation-independent, marginal effects on gene transcription
As DNA methylation of gene promoters is often associated with repressed gene expression and as the TET enzymes have been reported to affect gene expression, we used GeneChip® Human Genome U133 Plus 2.0 arrays to look for whole genome gene expression changes. RNA was extracted from the same overexpression, knockdown and control cells described and analyzed above. For both, the TET1 overexpression study and the triple knockdown study, the 3 replicate cell lines were analyzed in treated versus control states. Combined analysis of the replicates using an FDR (q-value) <0.05 identified no deregulated genes after TET1 overexpression and one downregulated gene after TET triple knockdown (KIAA0494/EFCAB14). To look for more subtle expression changes and account for interclonal differences among the replicate cell lines, we performed pair-wise analyses in which each experimental sample was compared to its respective baseline control using the Affymetrix MAS 5.0 comparison algorithm. Probe sets were retained that showed a consistent up- or downregulation among the 3 replicate cell lines of the respective study. This way, 11 up- and 10 down-regulated genes were identified that showed consistent deregulation in all 3 TET1-overexpressing cell lines (Table S18). With 67 up- and 124 downregulated genes, the triple knockdown experiment caused more gene expression changes (Table S19). Gene ontology analyses of deregulated genes did not reveal any over- or underrepresented biological processes after induced overexpression of TET1 or TET triple knockdown (Table S20). Importantly, TET1 overexpression had no effect on the transcript abundance of other TET species or DNA methyltransferases; neither did the TET triple knockdown affect DNA methyltransferase levels. We can rule out an effect of doxycycline used for induction of TET1 expression as other experiments have shown that doxycycline itself had no effect on the transcriptome of HEK293 cells.Citation35 Although the majority of expression changes were below 2-fold in the overexpression and knockdown studies, they could exemplarily be verified by qRT-PCR (Fig. S2). There was very little overlap among the identified genes of both studies as only 2 genes were deregulated in all TET1-overexpressing and triple knockdown cell lines, even though these genes showed reciprocal expression changes (ARRDC4, HOXA13).
Comparison of the gene expression profiles to the 500 top-ranked differentially methylated gene promoters showed no overlap in case of TET1 overexpression whereas after TET triple knockdown 3 slightly upregulated genes showed increased promoter methylation (CREBZF, HIST1H3H, and ROBO1). Taken together, the transcriptional changes observed after TET1 overexpression or TET triple knockdown cannot be linked to altered methylation levels of the top-ranked differentially methylated gene promoters. However, it should be noted that TET1 was moderately overexpressed in our experiments, and the endogenous TET levels were quite low in the HEK293 cell system studied.
TET1 overexpression and TET triple knockdown affect promoter methylation depending on gene expression levels
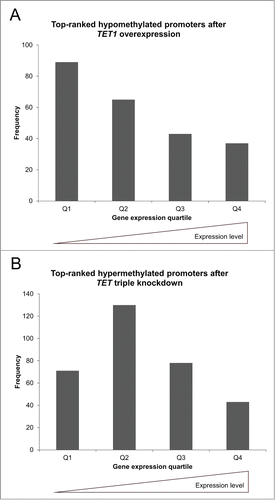
As TET1 overexpression and the triple knockdown of the TET enzymes affected promoter methylation levels with different preference depending on initial methylation levels, we asked whether this may be related to the general expression level of a gene. To this end, we first divided the gene expression profiles of the control cell lines into quartiles ranging from lowest/absent to highest expression levels and compared those to the corresponding methylation β values determined in the BeadChip experiments verifying the assumption that promoter methylation levels and gene expression intensities are generally negatively correlated (Fig. S3). Next, we compared the top-ranked differentially methylated gene promoters that showed a methylation decrease after TET1 overexpression or a methylation increase upon TET knockdown to the quartiles of gene expression. While TET1 overexpression preferentially caused demethylation of gene promoters with medium methylation levels, we found that genes of all expression levels were affected and identified a bias toward lowly expressed genes (). TET triple knockdown preferentially led to increased methylation levels at gene promoters with high methylation levels. Similar to TET1 overexpression, we found that genes of all expression levels were affected; however, there was a bias toward moderately expressed genes (). Importantly, after filtering for identical gene symbols between the methylation and gene expression data sets, the remaining promoters preserved their distribution patterns that depended on endogenous methylation levels (Fig. S4).
Figure 4. TET1 overexpression and TET triple knockdown affect promoter methylation levels depending on gene expression levels. The top-ranked differentially methylated gene promoters that showed a methylation decrease after TET1 overexpression (A) or a methylation increase after TET knockdown (B) are grouped according to gene expression quartiles of the respective control cells. Comparisons between expression and methylation were only performed for genes with identical gene symbol annotations in both data sets (TET1 overexpression: n = 234, TET triple knockdown: n = 322). Q1 – Q4: gene expression quartiles ranging from lowest to highest expression levels.
Reduced representation 5-hydroxymethylcytosine profiling (RRHP) revealed global 5hmC increase after TET1 overexpression
As the DNA dot blot experiments indicated a strong increase of genomic 5hmC levels upon TET1 overexpression, we investigated 5hmC distribution patterns in overexpressing vs. control cells. DNA from 2 of the 3 pairs of TET1 overexpression and control samples analyzed above was subjected to RRHP at Zymo Research. This approach enabled single-nucleotide 5hmC profiling at MspI restriction sites throughout the genome. In the end of this next-generation sequencing-based method, counting of read numbers allowed for quantification of 5hmC levels and comparison between samples.Citation31 Sequencing resulted in 22–25 million mapped 5hmC reads in uninduced control cells compared to 40–41 million reads in TET1-overexpressing cells confirming the increased 5hmC levels that were observed in dot blot experiments. More detailed analyses revealed that 76–78% of gene promoters, 84–85% of gene bodies and 88–90% of CGIs were covered by at least one 5hmC site in TET1-overexpressing and control cells. Upon TET1 overexpression we observed a strong increase of 5hmC-dense (>50 reads) promoters, gene bodies and CGIs (Fig. S5).
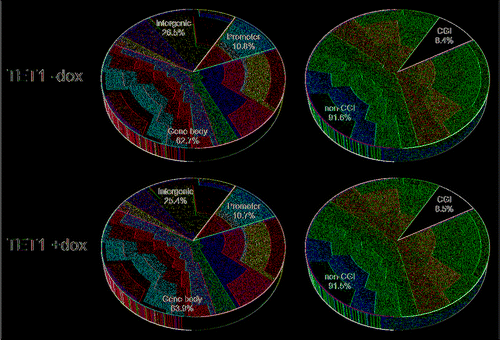
For further comparisons, we averaged the sequencing results from the replicate cell lines and applied a threshold of 5 reads for positive 5hmC identification per CpG site, which is based on Zymo Research's experience for robust 5hmC identification. Using this threshold, we determined a 3-fold increase of 5hmC-positive sites and a 6-fold increase of total 5hmC read numbers upon TET1 overexpression. We adapted the region definitions so that the same promoter, gene and CGI definitions were applied to the RRHP and HumanMethylation450 BeadChip data sets. Overexpressing cells showed a distinct shift toward increased 5hmC levels at most of the 778,332 identified 5hmC sites (), including promoters, gene bodies, CGIs, and intergenic regions (Fig. S6). Despite the overall increase of 5hmC, the relative read distribution among these genetic elements and regions did not remarkably change between TET1-overexpressing and control cells indicating that TET1 overexpression induced genome-wide 5mC oxidation without a distribution bias ().
Figure 5. TET1 overexpression leads to increased 5hmC levels at most 5hmC sites. Two T-REx-293-TET1 cell lines in uninduced and induced state were subjected to RRHP. Shown are averaged read counts reflecting 5hmC abundance in TET1-overexpressing (TET1 +dox) and control cells (TET1 -dox). CpG sites with less than 5 reads were considered zero. The black line illustrates a perfect positive correlation. ρ = Pearson correlation coefficient.
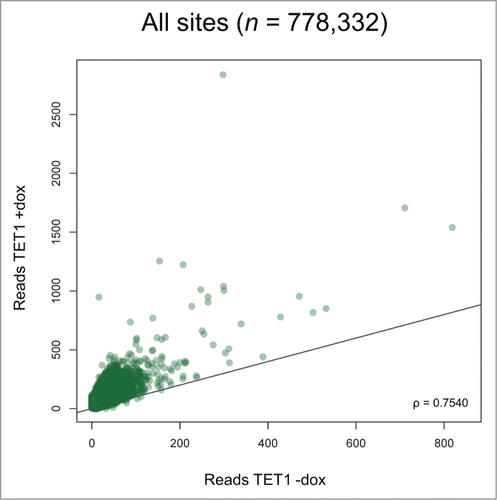
Figure 6. TET1 overexpression does not change the relative 5hmC distribution among genetic elements. Presented are 5hmC read distributions for different genetic elements and regions in control (TET1 -dox) and TET1-overexpressing cells (TET1 +dox). CpG sites with 5 or more reads were counted.
TET1-mediated 5mC oxidation is linked to endogenous 5hmC levels
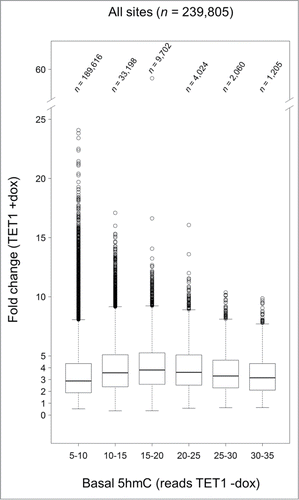
To examine whether TET1-mediated oxidation is linked to pre-existing, endogenous 5hmC levels, we mapped the fold changes that occurred after TET1 overexpression to 5hmC read levels in control cells. There was a trend indicating that CpG sites that were hydroxymethylated in some cells before overexpression (read class 15–20) were most susceptible to hydroxymethylation after TET1 overexpression (). This preference was true for all genomic regions analyzed including promoters, gene bodies, CGIs, and intergenic regions (Fig. S7).
Figure 7. TET1-mediated 5mC oxidation is associated with endogenous 5hmC levels. Endogenous 5hmC read levels in control cells (reads TET1 -dox) are compared to the fold changes of 5hmC that occurred after TET1 overexpression (TET1 +dox). Sites with basal 5hmC levels corresponding to 15–20 reads showed the highest increase. Only CpG sites with 5 or more reads in TET1-overexpressing and control cells were considered. Boxes mark the interquartile range with whiskers indicating the 1.5 × interquartile range. Outliers beyond the whiskers are plotted.
TET1 oxidates promoter 5mC depending on gene expression levels
A vast majority of 5hmC sites (525,937) occurred de novo upon TET1 overexpression, and most of these sites (89–93%) were covered by <20 reads in all genomic regions analyzed. However, in all genetic elements there were some de novo 5hmC hotspots with ≥20 and up to 119 reads. As the calculation of a fold change increase is not possible for de novo sites, we generated 2 separate lists of top 500 5hmC-gaining gene promoters, one depending on the highest de novo 5hmC increase (Table S21) and one depending on the highest fold change increase if endogenous 5hmC existed at a given promoter (Table S22). Gene ontology analyses did not reveal any over- or under-represented biological processes among the top fold change 5hmC-gaining promoters, but identified an overrepresentation of genes belonging to the basic category “biological regulation” among the top de novo 5hmC-gaining promoters (Table S23).
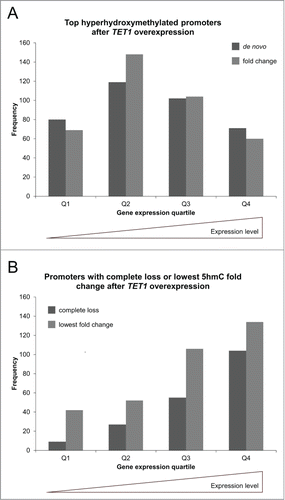
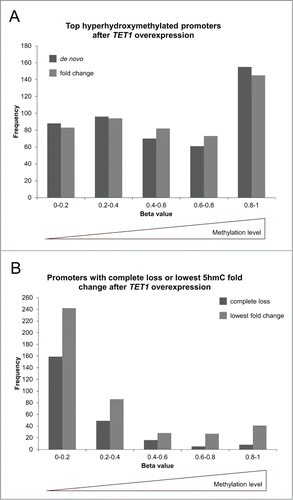
Comparison of both top 500 lists to gene expression levels revealed that while genes of all expression levels showed de novo and fold change increases of 5hmC, there was a bias toward genes with medium expression levels in both groups (). Genome-wide, there were a total of 9,900 CpG sites that completely lost 5hmC after TET1 overexpression. These sites were distributed across all genetic elements and formerly had low levels of 5hmC so that they do not seem to be preferred TET1 targets. We identified 257 promoters that were characterized by such a complete loss of 5hmC. We compared the 257 promoters that showed a complete 5hmC loss and the 500 promoters with the lowest fold changes (mean 1.03-fold 5hmC increase) to respective gene expression levels. In contrast to the top 5hmC-gaining promoters that showed a bias toward genes with medium expression levels, there were very few unexpressed and lowly expressed genes present and continuously increasing numbers of genes toward high expression levels ().
Figure 8. TET1 oxidates promoter 5mC depending on gene expression levels. The promoters showing the highest de novo or fold change increase of 5hmC (A) and those promoters characterized by a complete loss or lowest fold change of 5hmC upon TET1 overexpression (B) are grouped according to gene expression quartiles of uninduced control cells. Comparisons between expression and 5hmC methylation were only performed for genes with identical gene symbol annotations in both data sets (top de novo promoters: n = 372, top fold change promoters: n = 381, complete loss promoters: n = 195, lowest fold change promoters: n = 334). Q1 – Q4: gene expression quartiles ranging from lowest to highest expression levels.
TET1 oxidates 5mC preferably at highly methylated promoters
Next, we compared the top 5hmC-gaining promoters to their basal, endogenous methylation levels as determined by the HumanMethylation450 BeadChip experiments. While both, the de novo and the fold change lists of top 5hmC-gaining promoters, were composed of promoters from all endogenous methylation levels, there was a strong enrichment of highly methylated promoters (). In contrast, those promoters that were characterized by the lowest fold change increase or even a reduction of 5hmC levels after TET1 overexpression were strongly enriched of unmethylated and lowly methylated promoters ().
Figure 9. TET1 oxidates 5mC preferably at highly methylated promoters. The promoters showing the highest de novo or fold change increase of 5hmC (A) and those promoters characterized by a complete loss or lowest fold change of 5hmC upon TET1 overexpression (B) are grouped according to their basal, endogenous methylation levels as determined by the HumanMethylation450 BeadChip experiments. Comparisons between 5hmC and HumanMethylation450 data were only performed for genes with identical gene symbol annotations in both data sets (top de novo promoters: n = 470, top fold change promoters: n = 477, complete loss promoters: n = 237, lowest fold change promoters: n = 424).
Little overlap among top-ranked differentially methylated and hydroxymethylated promoters
As 5hmC has been proposed to act as an intermediate in TET-induced DNA demethylation, we asked to which extent the 500 top-ranked, mostly demethylated promoters identified after TET1 overexpression were also among the top-ranked 5hmC-gaining (de novo or fold change) promoters. Of the top 500 differentially methylated promoters identified by the BeadChip experiments, 18 promoters were among the top 500 de novo or fold change 5hmC-gaining promoters (Table S24). Furthermore, only 14 of these 18 promoters showed decreased methylation accompanied with 5hmC increase.
Motif discovery
Using the HOMER software suite,Citation36 we performed a de novo motif search to look for enriched sequence motifs in proximity (±200 bp) of the top 5,000 CpG sites that showed a methylation decrease after TET1 overexpression or a methylation increase after TET knockdown. In addition, analyses were carried out for the top 5,000 de novo and fold change 5hmC-gaining CpG sites identified by RRHP. The HOMER software employs a differential motif discovery algorithm comparing the top 5,000 target regions to the respective background regions (i.e., the sequence context of all CpG sites covered by BeadChip or RRHP analyses, respectively) to determine motif enrichment. Two motifs were significantly enriched after TET1 overexpression. In contrast, TET triple knockdown showed enrichment of 27 motifs, but did not include those motifs identified after TET1 overexpression. The surrounding sequences of the top de novo 5hmC-gaining CpG sites were enriched for 7 sequence motifs. Here, the top-ranked motif was also identified as top-ranked among the group of fold change 5hmC-gaining sites, which showed a total of 17 enriched motifs in their proximity. These motifs may serve as binding sites for transcription factors that recruit TET enzymes and initiate DNA demethylation. All results from the motif search are provided in Table S25.
Discussion
In the present study, we show that altering TET dioxygenase levels within physiological range can affect DNA methylation dynamics in HEK293 cells. Overexpression of TET1 strongly increased global 5hmC levels and was accompanied by mild DNA hypomethylation of promoters, gene bodies, and CGIs. Conversely, the simultaneous knockdown of the 3 TET enzymes led to decreased global 5hmC levels and mild DNA hypermethylation of above-mentioned regions. Single-nucleotide 5hmC profiling revealed that TET1 overexpression induced 5mC oxidation without a distribution bias among genetic elements and structures, such as promoters, gene bodies, CGIs, and intergenic regions but that this oxidation was related to endogenous 5hmC levels. Moreover, our results support the current view that the effects of TET1 overexpression on gene expression are mostly unrelated to its catalytic activity.
TET1 overexpression led to DNA hypomethylation of promoters, gene bodies, and CGIs, but, as the experiments were performed in dividing cells, we cannot say whether this was caused by active and/or passive replication-dependent DNA demethylation pathways. While the hypomethylated regions showed a wide range from low to high endogenous methylation levels, there was a higher preference for demethylating those promoters and gene bodies with intermediate methylation levels in contrast to the preferred demethylation of already sparsely methylated CGIs. In a similar experimental approach, Jin and colleaguesCitation30 studied the consequences of TET1 overexpression in HEK293T cells and observed only minimal effects on global DNA methylation. More specifically, TET1 overexpression caused significant DNA demethylation only in CGIs with low endogenous methylation levels, which is where we identified the preferred TET1-induced demethylation among CGIs. In contrast to the DREAM method applied by Jin et al., the HumanMethylation450 BeadChips we used for methylation quantification measured about a tenfold more CpG sites. We analyzed the methylation data on the region level mostly with multiple evaluated CpG sites per region and applied the combined rank method of the RnBeads software package to identify top-ranking, differentially methylated regions. This might be a more sensitive approach for detecting subtle methylation changes. The fact that the methylation changes we observed were small and TET1 overexpression did not induce massive, genome-wide demethylation could partly be due to the CXXC domain inherent to the TET1 enzyme. This domain has been shown to preferentially target TET1 to CpG-dense, hypomethylated regions where the substrate 5mC is rare and 5hmC production and demethylation activities are consequently limited.Citation30 This condition is applicable to the majority of CGIs,Citation37 where we and Jin and colleagues discovered TET1-induced demethylation. In the scenario of overexpression, excess TET1 protein might also bind and demethylate target regions of lower priority such as higher methylated or less CpG-dense regions. This would explain why we also detect demethylation in CGIs with medium and high degrees of methylation as well as in gene bodies.
In the vertebrate genome, the majority of gene promoters is associated with CGIs.Citation38 However, among the top 1,000 differentially methylated gene promoters identified upon TET1 overexpression only a minority of about 28% was associated with CGIs. Promoter regions in this study were defined as the regions 1.5 kb upstream and 0.5 kb downstream of transcription start sites, so that existing CGIs influenced the methylation status of promoter regions, but regions flanking CGIs also contributed to the calculation of the methylation average. These conditions may explain why TET1 overexpression caused demethylation preferably at lowly methylated CGIs but at promoter regions with medium endogenous methylation levels.
The triple knockdown of the TET enzymes caused DNA hypermethylation of promoters, gene bodies and CGIs. Similar to TET1 overexpression, the affected regions also showed a wide range of basal methylation levels, but there was a clear focus on regions with a higher degree of endogenous methylation. This prominent focus was consistently found among promoters, gene bodies and CGIs and in contrast to TET1 overexpression, 52% of gene promoters were associated with CGIs. Although we cannot specifically distinguish between functions of individual TET enzymes, this finding points to a general role of preventing highly methylated regions from further methylation.
Although endogenous TET levels are low in HEK293 cells and TET1 was only moderately overexpressed, both TET1 overexpression and TET triple knockdown caused methylation changes. However, there are only small reciprocal effects among their top-ranking target regions. This might be related to the overexpression of one TET enzyme which is compared to the knockdown of all 3 known TET enzymes and to the different base line methylation levels at which overexpression and knockdown showed their main effects. In both experiments, we identified marginally up- and downregulated genes, but there was very little overlap as only 2 genes were deregulated in the TET1-overexpressing and TET triple knockdown cell lines (ARRDC4, HOXA13). The transcriptional changes observed in both experiments were not associated with DNA methylation changes of the top-ranked differentially methylated gene promoters. It could be that important methylation changes occurred at promoter-distal regulatory regions where a previous report detected high levels of 5hmC and suggested active DNA demethylation events.Citation39 However, the network of TET-interacting proteins might also contribute to the discrepancy between the observed methylation and gene expression changes and to the limited amount of reciprocal effects. Since the discovery of the TET enzymes, plenty of TET-interacting transcription-related factors have emerged comprising transcription factors/nuclear receptors and chromatin-associated proteins involved in transcriptional activation or repression.Citation21 A strong TET interaction partner is the O-linked N-acetylglucosamine transferase (OGT)Citation40-42 and, depending on the cell context, all TET enzymes seem to interact with OGT leading to a proposed model of “hydroxymethylation independent” gene activation.Citation21 The TET enzymes associate with OGT on promoters enhancing its glycosyltransferase activity on histone H2B and the SET1/COMPASS complex, finally leading to H3K4 trimethylation and transcriptional activation.Citation21,40-42 As there are many protein targets of OGT, additional consequences of TET-mediated OGT recruitment are assumed.Citation20 TET1 and TET3, but not TET2, have been shown to recruit the SIN3A co-repressor complex to their target sites leading to transcriptional repression.Citation2,41 The transcriptional regulator PRDM14 interacts with TET1 and TET2 and enhances their recruitment to target loci promoting active DNA demethylation in embryonic stem cells.Citation43 Another example of differential TET interaction is the transcriptional repressor REST that interacts specifically with the neuronal isoform of TET3, but neither with other TET3 nor TET1 or TET2 proteins.Citation44
In contrast to the moderate TET1 overexpression in our study, Jin and colleaguesCitation30 overexpressed TET1 at very high levels and also identified up- and downregulated genes. We performed the TET triple knockdown using siRNA application for 96h in HEK293 cells, which have low endogenous TET levels, thus studying the rather immediate effects of further reduced TET levels. In contrast, Jin and colleagues performed a shRNA-mediated long-term repression of TET1 in HEK293T cells and also observed up- as well as down-regulated genes. Importantly, the authors showed that the expression changes identified after TET1 overexpression or knockdown were independent of its demethylating activity. The transcriptional up- and down-regulation and missing association with differentially methylated promoters in our overexpression and knockdown experiments are in line with these findings.
In our study, elevating or lowering TET dioxygenase levels affected promoter methylation levels with different preference depending on initial methylation levels. To investigate whether this correlates with respective gene expression levels, we compared the top-ranked differentially methylated promoters that showed a methylation decrease after TET1 overexpression or a methylation increase upon TET knockdown to quartiles of gene expression of the respective control cells. While promoter methylation levels and gene expression intensities are generally negatively correlated, this approach revealed a discrepancy between the preferred range of endogenous promoter methylation and the distribution among gene expression quartiles: Although TET1 overexpression preferentially caused demethylation of promoters with medium methylation levels, we identified an enrichment of lowly expressed genes. In contrast, TET triple knockdown preferentially led to increased methylation levels at promoters with higher degrees of methylation, but to an enrichment of moderately expressed genes.
In line with the DNA dot blot experiments, single-nucleotide 5hmC profiling determined a strong increase of genomic 5hmC levels upon TET1 overexpression. However, the relative distribution among promoters, gene bodies, intergenic regions, and CGIs did not remarkably change between TET1-overexpressing and control cells indicating that TET1 overexpression induced genome-wide 5mC oxidation without a distribution bias. Comparison of 5hmC levels before and after TET1 overexpression revealed a trend of different susceptibility to TET-induced 5mC oxidation that was linked to endogenous 5hmC content and found in promoters, gene bodies, intergenic regions, and CGIs. CpG sites that were already hydroxymethylated in a certain amount of cells before overexpression showed a higher fold change increase of 5hmC than those CpG sites that were hydroxymethylated in lower or higher amounts of cells. On the one hand, this could be explained by a state of saturation: CpG sites that were hydroxymethylated in many cells before overexpression could be hydroxymethylated in further cells, but the higher the initial numbers of hydroxymethylated cells, the more problematic it is to achieve a higher fold change when the substrate 5mC might be limiting at some point. On the other hand, CpG sites that were hydroxymethylated in lower cell numbers probably possessed a disfavored sequence context or were otherwise not easily accessible to TET1, a situation still valid during TET1 overexpression and restricting higher fold change increases.
The majority of 5hmC sites occurred de novo upon TET1 overexpression (i.e., <5 5hmC reads in control cells compared to ≥5 reads and robust 5hmC detection in TET1-overexpressing cells), and these sites were found in all genomic regions analyzed. Therefore, we generated 2 separate lists of the top 500 5hmC-gaining gene promoters, one based on the highest de novo and one based on the highest fold change increase of 5hmC. Compared to the respective gene expression levels, both lists consistently showed that while genes of all expression levels were affected, there was an enrichment of genes with medium expression levels. Further analyses revealed a discrepancy between the distribution among gene expression quartiles and endogenous promoter methylation levels as highly methylated promoters were overrepresented. This is in marked contrast to those promoters that were mostly unaffected by TET1 overexpression and characterized by the lowest fold change increases or even a reduction of 5hmC levels after TET1 overexpression. These promoters showed a completely different distribution among the quartiles of gene expression with very few unexpressed and lowly expressed genes but continuously increasing numbers of genes toward high expression levels. The finding that highly expressed genes tend to be less prone to TET1-induced oxidation can be explained by the low substrate abundance at such promoter regions as they are characterized by very low 5mC levels.
Although 5hmC is well accepted as an intermediate in DNA demethylation,Citation4 we could find only marginal reciprocal effects among the top-ranked 5hmC-gaining gene promoters and the top-ranked, mostly demethylated promoters identified after TET1 overexpression. One explanation for this marginal reciprocity could be that larger amounts of 5hmC might have already been diluted out or actively been removed from most of the top-ranked demethylated promoters. Moreover, the RRHP and BeadChip analyses evaluated mostly a few CpG sites per promoter region (RRHP average of 3.45 CpG sites/promoter; BeadChip average of 7.66 CpG sites/promoter), and not necessarily the same ones. Although it is common practice to deduce the methylation level of a promoter region from a few CpG sites analyzed, this complicates the interpretation of an overlap from both assays. It is also important to note that while the measured CpG sites in the BeadChip analyses were limited by array design and always gave back a methylation β value, the analyzed CpG sites in the RRHP analysis had to (a) lie within MspI restriction sites and (b) be hydroxymethylated to some extent as otherwise there would not have been any read counts and consequently the CpG sites would not have shown up at all (even though they might have been part of an MspI motif). Nevertheless, of the 22,394 promoter regions measured in the BeadChip experiments, a total of 12,667 promoters were also evaluated by RRHP.
TET1 has recently been reported to act as a maintenance demethylase preventing aberrant DNA methylation spreading from methylated edges into hypomethylated CGIs.Citation30 Due to the above-mentioned reduced resolution of the assays used for 5mC and 5hmC quantification, we could not specifically examine these narrow boundary areas of 5mC oxidation and DNA demethylation in the present study. However, the preferred TET1-induced demethylation of sparsely methylated CGIs is in agreement with the proposed maintenance role of TET1. The fact that the triple knockdown of the TET enzymes did not preferably lead to hypermethylation of sparsely methylated CGIs could be related to the knockdown of TET2 and TET3 which are also expressed in HEK293 cells and that might have different target regions and catalytic efficiencies. Overexpression of TET1 not only influenced 5mC and 5hmC levels of CGIs with low basal methylation levels, but also affected other regions with a wide range of endogenous methylation levels suggesting that TET1 might have other functions in addition to its maintenance demethylase activity. Although we cannot derive functions of a specific TET enzyme from the triple knockdown experiments, the observed hypermethylation of promoters, gene bodies and CGIs points to a widespread role of the TET family in regulating DNA methylation levels.
Materials and Methods
Cell culture
All cells were cultured in DMEM supplemented with 10% FCS and 1% Penicillin-Streptomycin in a humidified incubator at 37°C supplied with 5% CO2. Blasticidin, zeocin and hygromycin B were used as selective antibiotics (all Invivogen) at different stages for Flp-In™ T-REx™-293 cell lines and its derivates. Using PCR-based assays, all cell lines were tested negative for mycoplasma contamination.
Generation of inducible TET1 and GFP cell lines
Doxycycline-inducible expression cell lines were generated essentially as described in the Flp-In™ T-REx™ Core Kit Manual using the Flp-In™ T-REx™-293 cell line (both Invitrogen) which is derived from HEK293 cells. FLAG-HA-tagged TET1 cDNA was a kind gift from A. Rao and colleaguesCitation17 and cloned into the KpnI and NotI sites of pcDNA5/FRT/TO to generate pcDNA5/FRT/TO_TET1. The GFP control plasmid pcDNA5/FRT/TO_GFP and the Flp recombinase expression vector pCSFLPe were kind gifts from G. Ryffel and colleagues.Citation45 The plasmids pCSFLPe and pcDNA5/FRT/TO_TET1 (or pcDNA5/FRT/TO_GFP) were co-transfected at a 9:1 ratio using Fugene HD (Roche) and positive clones were selected for with 100 µg/ml hygromycin B. When all cells had died on a negative control, independent single-cell-derived clones (TET1 #1 - 3; GFP #1 - 3) were cultured under constant selection and tested for the absence of β-galactosidase activity as suggested by the manufacturer. T-REx-293-TET1 cells were induced for TET1 overexpression with 1 µg/ml doxycycline (Sigma-Aldrich) for 48 h. Induced T-REx-293-GFP cell lines showed strong GFP expression as determined by fluorescence microscopy (data not shown).
siRNA transfections
T-REx-293-GFP cell lines (GFP #1–3) cultured in the absence of doxycycline were transfected with combined ON-TARGETplus SMARTpool siRNAs directed against human TET1, TET2 and TET3 at a final total concentration of 50 nM (Thermo Scientific; L-014635–02, L-013776–03, L-022722–02). As each pool consisted of 4 individual siRNAs targeting a single gene, each siRNA species was present at 4.17 nM. In parallel, the same cell lines were transfected with ON-TARGETplus Non-Targeting Pool (Thermo Scientific, D-001810–10) as scrambled controls. Transfections were performed using Lipofectamine RNAiMAX (Invitrogen) according to the manufacturer's instructions. Cells were re-transfected after 48 h and harvested after 96 h.
Western blots and DNA dot blots
DNA, RNA and protein extraction was performed in parallel using the AllPrep DNA/RNA/Protein Mini Kit (Qiagen) according to the manufacturer's instructions including an optional on-column DNAse digestion during RNA purification. The protein pellet was resuspended in 5% SDS and the amount of protein quantified using the Pierce BCA Protein Assay Kit (Life Technologies). Western blot assays were carried out according to established protocols, with following primary antibodies: anti-FLAG (Stratagene, #200472), anti-TET1 (GeneTex, GTX124207) and anti-GAPDH (Cell Signaling, #2118).
For DNA dot blot assays, serial dilutions of genomic DNA samples in TE buffer were denatured in 0.4 M NaOH/10 mM EDTA at 99°C for 5 min. An equal volume of ice-cold 2M ammonium acetate solution (pH 7.0) was added, and the samples were spotted on a positively charged nylon membrane (Amersham Hybond-N+, GE Healthcare) using a Minifold dot blot system (SRC-96, Schleicher & Schuell). After washing with 2x SSC, UV-crosslinking was performed with 70,000 µJ/cm2 (UVC 500, Hoefer), and the membrane was blocked with 5% skim milk powder in TBST. Immunoblotting was performed using primary anti-5hmC (Active Motif, #39769) and HRP-conjugated anti-rabbit secondary antibodies (Thermo Scientific, #32460).
Gene expression analyses by qRT-PCR and microarray
Following RQ1 DNase digestion (Promega), total RNA was reverse-transcribed into cDNA using the GeneAmp RNA PCR Kit and random hexamers (Applied Biosystems). Relative quantitative real-time RT-PCR (qRT-PCR) was performed on a LightCycler 480 device using the Universal ProbeLibrary System and intron-spanning assays designed with the help of the ProbeFinder software (all Roche). The expression of each target gene was internally normalized to GAPDH expression and analyzed using the LightCycler 480 Software (Release 1.5.0, Version 1.5.0.39; Roche). Target gene expression relative to GAPDH expression was calculated based on the tutorial “Guide to Performing Relative Quantitation of Gene Expression Using Real-Time Quantitative PCR” (Part Number 4371095 Rev B, Applied Biosystems). Primers and probes are given in Table S26.
Whole human genome expression analyses were conducted using Affymetrix GeneChip® Human Genome U133 Plus 2.0 arrays. Using the Affymetrix GeneChip® 3′ IVT Express Kit, target preparation was performed with 200 ng RNA essentially as described in the manual. Hybridization, washing and staining of the arrays was done according to the manufacturer's recommendation on a GC Scanner 3000 (Affymetrix) with G7 update. Initially, the array images were processed in Partek GenomicsSuite using the RMA default algorithm. Statistical analyses using the ANOVA test with FDR step-up correction for multiple testing revealed no deregulated genes upon TET1 overexpression and one deregulated gene upon TET triple knockdown which prompted us to look for more subtle expression changes. To this end, the data were analyzed with the GCOS1.4 software and the MAS 5.0 statistical algorithm using Affymetrix default analysis settings to determine signals and detection calls (Present, Absent and Marginal) for each probe set. Global scaling to an average target intensity of 1000 was applied as normalization method. In pair-wise analyses, each experimental sample (TET1 overexpression or TET triple knockdown replicates) was compared to its respective baseline control (not induced or scramble-treated replicates). Based on Wilcoxon's signed rank test, the significance of each change in gene expression (change P-value) was calculated. Significantly increased (P-value <0.002) or decreased (P-value >0.998) probesets were retained. To limit the number of false positives, we restricted further target identification to those probe sets that received at least one present detection call in the treated/control pair. Finally, only probe sets were retained that showed consistent up- or down-regulation among all 3 cross comparisons of the respective overexpression or knockdown study. Probe sets were assigned to genes based on unique gene symbols.
Infinium HumanMethylation450 BeadChip analyses
DNA extracted from the TET1 overexpression and TET triple knockdown experiments (12 samples in total) was subjected to deamination and subsequent analyses on Illumina's Infinium HumanMethylation450 BeadChips according to the manufacturer's protocol (11322371 Rev. A). Data analysis was performed using the web service of the RnBeads software toolCitation46 version 0.99.15 with default settings (listed in Table S27). In RnBeads, differential methylation of promoters, gene bodies and CGIs was evaluated based on 3 criteria. Based on each criterion, each region was assigned a certain rank. From these ranks, a combined rank was inferred for a specific region by taking the maximum (i.e., worst) value among the ranks.Citation46 Based on these combined ranks, scatterplots of the 1,000 best ranking regions were generated. For further analyses, we prepared candidate lists of the 500 top-ranked CGIs and top-ranked, gene symbol-associated promoters and gene bodies. A promoter was defined as the region spanning 1.5 kb upstream and 0.5 kb downstream of the transcription start site of the corresponding gene. CGIs were annotated as associated with a certain promoter based on the overlap of CGIs and 2 kb promoter regions. For other comparisons, complete lists of promoter methylation data were generated based on gene symbol annotations. Methylation levels are represented by β values ranging from 0 (unmethylated) to 1 (fully methylated).
Reduced representation 5-hydroxymethylcytosine profiling (RRHP)
Reduced representation 5-hydroxymethylcytosine profiling was performed by Zymo Research on DNA from 2 of the 3 TET1 overexpression experiments in induced versus control state (cell lines TET1 #1 and #3). Genomic DNA was fragmented overnight at 37°C with a hydroxymethyl-insensitive enzyme, MspI, and purified using the DNA Clean and Concentrator kit (Zymo Research). Modified Illumina TruSeq P5 and P7 adapters containing 5′-CG overhangs were ligated onto the digested DNA using T4 DNA ligase (2 h at 16°C). Libraries were then strand-extended at 72°C with Taq DNA Polymerase. The adapters were designed to regenerate the 5′-CCGG site at the P5 junction while the P7 adapter generates a 5′-TCGG junction, making it insensitive to MspI digestion. Adapterized libraries were treated with ß-glucosyltransferase to label 5hmC modifications and purified using the DNA Clean and Concentrator kit. The glucosylated libraries were then subjected to an overnight MspI digestion at 37°C, cutting any fragments not containing a glucosyl-5hmC site at the P5 CCGG junction. After incubation, the libraries were size-selected from 100 bp to 500 bp and purified using the ZymoClean Gel DNA Recovery Kit (Zymo Research). The fragments were amplified using OneTaq 2X Master Mix (New England Biolabs), and the PCR conditions include an initial denaturation of 94°C for 30 sec followed by 12 cycles of 94°C for 30 sec, 58°C for 30 sec, and 68°C for 1 min. Fragments containing 5hmC were positively selected during PCR amplification with adapter-specific indexing primers whereas fragments lacking glucosylated 5hmC at the P5 junction were cleaved and, therefore, not amplified by PCR. Amplified libraries were purified using the DNA Clean and Concentrator kit, and multiplexed using equal volume of the libraries. All adapters and primers used were synthesized by Integrated DNA Technologies.
Sequence reads from RRHP libraries were first processed to trim off the low quality bases and the P7CG adapter at the 3′ end of the reads. Reads were then aligned to the hg19 reference genome using the Bowtie default parameters and the parameter “–best.” Aligned reads with the MspI tag (CCGG) were counted. Initially, gene and CGI annotations were derived from the RefSeq and CGI lists obtained from the UCSC website (http://genome.ucsc.edu/).
For a better comparison to the HumanMethylation450 data sets analyzed with the RnBeads software, we later changed the RRHP annotations according to those definitions that were employed in the RnBeads analyses (Ensembl gene definitions version 73, http://www.ensembl.org/; CGI definitions were that from UCSC; promoters were defined as the regions spanning 1.5 kb upstream and 0.5 kb downstream of transcription start sites of corresponding genes).
Statistical overrepresentation tests
To statistically determine over- or underrepresented gene ontology categories among candidate lists, PANTHER Overrepresentation Tests were performed using default settings.Citation47 Lists of gene symbols were used as input and compared to the Homo sapiens whole-genome reference list applying the Bonferroni correction for multiple testing. Details for each analysis are provided in corresponding supplementary tables.
De novo motif discovery
First, we created FASTA files containing the top 5,000 CpG sites that showed the highest methylation decrease after TET1 overexpression or highest methylation increase after TET knockdown (P-value <0.05) together with their 200 bp flanking regions. Similarly, FASTA files of the top 5hmC target regions were prepared using the top 5,000 de novo and fold change 5hmC-gaining CpG sites identified by RRHP. Appropriate background FASTA files were generated based on the sequence context of all CpG sites that were covered by the respective BeadChip or RRHP analyses. We applied the tool “findMotifs.pl” of the HOMER software suiteCitation36 (v4.7) comparing the target and background files to identify enriched de novo motifs. Sequence motifs that were annotated as possible false positive hits were excluded from the result tables.
Further bioinformatic analyses
Comparisons of deregulated transcripts identified by microarray expression profiling to the top-ranked differentially methylated gene promoters were performed on the level of annotated gene symbols. Initially, we verified that most promoter regions belonging to these transcripts were actually covered by methylation analyses. Of the 21 deregulated genes identified upon TET1 overexpression, 16 corresponding promoter regions were evaluated by the methylation BeadChips. In case of the triple knockdown experiment, 179 of the 191 deregulated genes were covered and methylation data were available. The fact that not every deregulated gene had been covered by the methylation BeadChips could be related to discrepant gene symbol annotations as well as missing methylation probe sets either due to array design per se or data preprocessing and filtering steps applied in the methylation analysis pipeline.
Gene expression data of the control cell lines from the overexpression and knockdown studies were stratified into quartiles of expression based on signal intensities. Signal values were computed with statistical algorithms implemented in the Affymetrix Microarray Suite version 5.0 during the Single Array Analyses which can be used to generate gene expression profiles and monitor gross expression characteristics (Affymetrix Statistical Algorithms Reference Guide, 701110 Rev 1). For each study, we averaged the signal values that originated from the 3 replicate cell lines per probe set. As further comparisons with (hydroxy)methylation data were based on annotated gene symbols, we retained expression data only when associated with a unique gene symbol. When multiple probe sets were associated with one gene symbol, the highest expression signal was considered. This way, expression data for more than 20,000 genes were stratified into quartiles.
Data access
GEO accession number GSE67351. Please note that the inducible T-REx-293-TET1 cell lines (TET1 #1 - #3) correspond to clonal cell lines TET1-A, -F and -G, respectively. The T-REx-293-GFP cell lines (GFP #1 - #3) correspond to 1_GFPsiRNA, 2_GFPsiRNA and 3_GFPsiRNA in TET triple knockdown and 4_GFPscr, 5_GFPscr and 6_GFPscr in control state.
Disclosure of Potential Conflicts of Interest
No potential conflicts of interest were disclosed.
1073879_Supplemental_Material.pdf
Download PDF (4.9 MB)Acknowledgments
We would like to thank Ludger Klein-Hitpass from the BioChip laboratory Essen and Walter Pulverer from the Austrian Institute of Technology for their kind help with the project. We would also like to thank Fabian Müller (Max Planck Institute for Informatics) and Zymo Research for their kind help. We thank Anjana Rao (La Jolla Institute for Allergy and Immunology) for providing the TET1 cDNA. Thanks also go to Hannah Demond for proofreading of the manuscript.
Supplemental Material
Supplemental data for this article can be accessed on the publisher's website.
Funding
This project is supported by the Deutsche Forschungsgemeinschaft (DFG) graduate research training program no. 1431: “Transcription, Chromatin Structure and DNA Repair in Development and Differentiation.” The funder had no role in study design, data collection and analysis, decision to publish, or preparation of the manuscript.
References
- Schubeler D. Function and information content of DNA methylation. Nature 2015; 517:321-6; PMID:25592537; http://dx.doi.org/10.1038/nature14192
- Williams K, Christensen J, Pedersen MT, Johansen JV, Cloos PA, Rappsilber J, Helin K. TET1 and hydroxymethylcytosine in transcription and DNA methylation fidelity. Nature 2011; 473:343-8; PMID:21490601; http://dx.doi.org/10.1038/nature10066
- Jones PA. Functions of DNA methylation: islands, start sites, gene bodies and beyond. Nat Rev Genet 2012; 13:484-92; PMID:22641018; http://dx.doi.org/10.1038/nrg3230
- Kroeze LI, van der Reijden BA, Jansen JH. Five-Hydroxymethylcytosine: An epigenetic mark frequently deregulated in cancer. Biochim Biophys Acta 2015; 1855:144-54; PMID:25579174
- Deaton AM, Bird A. CpG islands and the regulation of transcription. Genes Dev 2011; 25:1010-22; PMID:21576262; http://dx.doi.org/10.1101/gad.2037511
- Bergman Y, Cedar H. DNA methylation dynamics in health and disease. Nat Struct Mol Biol 2013; 20:274-81; PMID:23463312; http://dx.doi.org/10.1038/nsmb.2518
- Messerschmidt DM, Knowles BB, Solter D. DNA methylation dynamics during epigenetic reprogramming in the germline and preimplantation embryos. Genes Dev 2014; 28:812-28; PMID:24736841; http://dx.doi.org/10.1101/gad.234294.113
- Pogribny IP, Beland FA. DNA hypomethylation in the origin and pathogenesis of human diseases. Cell Mol Life Sci 2009; 66:2249-61; PMID:19326048; http://dx.doi.org/10.1007/s00018-009-0015-5
- Santos-Reboucas CB, Pimentel MM. Implication of abnormal epigenetic patterns for human diseases. Eur J Hum Genet 2007; 15:10-7; PMID:17047674; http://dx.doi.org/10.1038/sj.ejhg.5201727
- Denis H, Ndlovu MN, Fuks F. Regulation of mammalian DNA methyltransferases: a route to new mechanisms. EMBO Rep 2011; 12:647-56; PMID:21660058; http://dx.doi.org/10.1038/embor.2011.110
- Guo JU, Su Y, Zhong C, Ming GL, Song H. Hydroxylation of 5-methylcytosine by TET1 promotes active DNA demethylation in the adult brain. Cell 2011; 145:423-34; PMID:21496894; http://dx.doi.org/10.1016/j.cell.2011.03.022
- Hackett JA, Sengupta R, Zylicz JJ, Murakami K, Lee C, Down TA, Surani MA. Germline DNA demethylation dynamics and imprint erasure through 5-hydroxymethylcytosine. Science 2013; 339:448-52; PMID:23223451; http://dx.doi.org/10.1126/science.1229277
- Hashimoto H, Liu Y, Upadhyay AK, Chang Y, Howerton SB, Vertino PM, Zhang X, Cheng X. Recognition and potential mechanisms for replication and erasure of cytosine hydroxymethylation. Nucleic Acids Res 2012; 40:4841-9; PMID:22362737; http://dx.doi.org/10.1093/nar/gks155
- Iqbal K, Jin SG, Pfeifer GP, Szabo PE. Reprogramming of the paternal genome upon fertilization involves genome-wide oxidation of 5-methylcytosine. Proc Natl Acad Sci U S A 2011; 108:3642-7; PMID:21321204; http://dx.doi.org/10.1073/pnas.1014033108
- Ito S, Shen L, Dai Q, Wu SC, Collins LB, Swenberg JA, He C, Zhang Y. Tet proteins can convert 5-methylcytosine to 5-formylcytosine and 5-carboxylcytosine. Science 2011; 333:1300-3; PMID:21778364; http://dx.doi.org/10.1126/science.1210597
- Maiti A, Drohat AC. Thymine DNA glycosylase can rapidly excise 5-formylcytosine and 5-carboxylcytosine: potential implications for active demethylation of CpG sites. J Biol Chem 2011; 286:35334-8; PMID:21862836; http://dx.doi.org/10.1074/jbc.C111.284620
- Tahiliani M, Koh KP, Shen Y, Pastor WA, Bandukwala H, Brudno Y, Agarwal S, Iyer LM, Liu DR, Aravind L, et al. Conversion of 5-methylcytosine to 5-hydroxymethylcytosine in mammalian DNA by MLL partner TET1. Science 2009; 324:930-5; PMID:19372391; http://dx.doi.org/10.1126/science.1170116
- Valinluck V, Sowers LC. Endogenous cytosine damage products alter the site selectivity of human DNA maintenance methyltransferase DNMT1. Cancer Res 2007; 67:946-50; PMID:17283125; http://dx.doi.org/10.1158/0008-5472.CAN-06-3123
- Wossidlo M, Nakamura T, Lepikhov K, Marques CJ, Zakhartchenko V, Boiani M, Arand J, Nakano T, Reik W, Walter J. Five-Hydroxymethylcytosine in the mammalian zygote is linked with epigenetic reprogramming. Nat Commun 2011; 2:241; PMID:21407207; http://dx.doi.org/10.1038/ncomms1240
- Pastor WA, Aravind L, Rao A. TETonic shift: biological roles of TET proteins in DNA demethylation and transcription. Nat Rev Mol Cell Biol 2013; 14:341-56; PMID:23698584; http://dx.doi.org/10.1038/nrm3589
- Delatte B, Deplus R, Fuks F. Playing TETris with DNA modifications. EMBO J 2014; 33:1198-211; PMID:24825349
- Dawlaty MM, Ganz K, Powell BE, Hu YC, Markoulaki S, Cheng AW, Gao Q, Kim J, Choi SW, Page DC, et al. Tet1 is dispensable for maintaining pluripotency and its loss is compatible with embryonic and postnatal development. Cell Stem Cell 2011; 9:166-75; PMID:21816367; http://dx.doi.org/10.1016/j.stem.2011.07.010
- Li Z, Cai X, Cai CL, Wang J, Zhang W, Petersen BE, Yang FC, Xu M. Deletion of Tet2 in mice leads to dysregulated hematopoietic stem cells and subsequent development of myeloid malignancies. Blood 2011; 118:4509-18; PMID:21803851; http://dx.doi.org/10.1182/blood-2010-12-325241
- Dawlaty MM, Breiling A, Le T, Raddatz G, Barrasa MI, Cheng AW, Gao Q, Powell BE, Li Z, Xu M, et al. Combined deficiency of Tet1 and Tet2 causes epigenetic abnormalities but is compatible with postnatal development. Dev Cell 2013; 24:310-23; PMID:23352810; http://dx.doi.org/10.1016/j.devcel.2012.12.015
- Putiri EL, Tiedemann RL, Thompson JJ, Liu C, Ho T, Choi JH, Robertson KD. Distinct and overlapping control of 5-methylcytosine and 5-hydroxymethylcytosine by the TET proteins in human cancer cells. Genome Biol 2014; 15:R81; PMID:24958354; http://dx.doi.org/10.1186/gb-2014-15-6-r81
- Ito S, D'Alessio AC, Taranova OV, Hong K, Sowers LC, Zhang Y. Role of Tet proteins in 5mC to 5hmC conversion, ES-cell self-renewal and inner cell mass specification. Nature 2010; 466:1129-33; PMID:20639862; http://dx.doi.org/10.1038/nature09303
- Lorsbach RB, Moore J, Mathew S, Raimondi SC, Mukatira ST, Downing JR. TET1, a member of a novel protein family, is fused to MLL in acute myeloid leukemia containing the t(10;11)(q22;q23). Leukemia 2003; 17:637-41; PMID:12646957; http://dx.doi.org/10.1038/sj.leu.2402834
- Szwagierczak A, Bultmann S, Schmidt CS, Spada F, Leonhardt H. Sensitive enzymatic quantification of 5-hydroxymethylcytosine in genomic DNA. Nucleic Acids Res 2010; 38:e181; PMID:20685817; http://dx.doi.org/10.1093/nar/gkq684
- Zhang H, Zhang X, Clark E, Mulcahey M, Huang S, Shi YG. TET1 is a DNA-binding protein that modulates DNA methylation and gene transcription via hydroxylation of 5-methylcytosine. Cell Res 2010; 20:1390-3; PMID:21079648; http://dx.doi.org/10.1038/cr.2010.156
- Jin C, Lu Y, Jelinek J, Liang S, Estecio MR, Barton MC, Issa JP. TET1 is a maintenance DNA demethylase that prevents methylation spreading in differentiated cells. Nucleic Acids Res 2014; 42:6956-71; PMID:24875481; http://dx.doi.org/10.1093/nar/gku372
- Petterson A, Chung TH, Tan D, Sun X, Jia XY. RRHP: a tag-based approach for 5-hydroxymethylcytosine mapping at single-site resolution. Genome Biol 2014; 15:456; PMID:25248841; http://dx.doi.org/10.1186/s13059-014-0456-5
- He YF, Li BZ, Li Z, Liu P, Wang Y, Tang Q, Ding J, Jia Y, Chen Z, Li L, et al. Tet-mediated formation of 5-carboxylcytosine and its excision by TDG in mammalian DNA. Science 2011; 333:1303-7; PMID:21817016; http://dx.doi.org/10.1126/science.1210944
- Huang Y, Pastor WA, Shen Y, Tahiliani M, Liu DR, Rao A. The behaviour of 5-hydroxymethylcytosine in bisulfite sequencing. PLoS One 2010; 5:e8888; PMID:20126651; http://dx.doi.org/10.1371/journal.pone.0008888
- Booth MJ, Branco MR, Ficz G, Oxley D, Krueger F, Reik W, Balasubramanian S. Quantitative sequencing of 5-methylcytosine and 5-hydroxymethylcytosine at single-base resolution. Science 2012; 336:934-7; PMID:22539555; http://dx.doi.org/10.1126/science.1220671
- Neumann LC, Markaki Y, Mladenov E, Hoffmann D, Buiting K, Horsthemke B. The imprinted NPAP1/C15orf2 gene in the Prader-Willi syndrome region encodes a nuclear pore complex associated protein. Hum Mol Genet 2012; 21:4038-48; PMID:22694955; http://dx.doi.org/10.1093/hmg/dds228
- Heinz S, Benner C, Spann N, Bertolino E, Lin YC, Laslo P, Cheng JX, Murre C, Singh H, Glass CK. Simple combinations of lineage-determining transcription factors prime cis-regulatory elements required for macrophage and B cell identities. Mol Cell 2010; 38:576-89; PMID:20513432; http://dx.doi.org/10.1016/j.molcel.2010.05.004
- Illingworth RS, Bird AP. CpG islands–‘a rough guide’. FEBS Lett 2009; 583:1713-20; PMID:19376112; http://dx.doi.org/10.1016/j.febslet.2009.04.012
- Saxonov S, Berg P, Brutlag DL. A genome-wide analysis of CpG dinucleotides in the human genome distinguishes two distinct classes of promoters. Proc Natl Acad Sci U S A 2006; 103:1412-7; PMID:16432200; http://dx.doi.org/10.1073/pnas.0510310103
- Yu M, Hon GC, Szulwach KE, Song CX, Zhang L, Kim A, Li X, Dai Q, Shen Y, Park B, et al. Base-resolution analysis of 5-hydroxymethylcytosine in the mammalian genome. Cell 2012; 149:1368-80; PMID:22608086; http://dx.doi.org/10.1016/j.cell.2012.04.027
- Chen Q, Chen Y, Bian C, Fujiki R, Yu X. TET2 promotes histone O-GlcNAcylation during gene transcription. Nature 2013; 493:561-4; PMID:23222540; http://dx.doi.org/10.1038/nature11742
- Deplus R, Delatte B, Schwinn MK, Defrance M, Mendez J, Murphy N, Dawson MA, Volkmar M, Putmans P, Calonne E, et al. TET2 and TET3 regulate GlcNAcylation and H3K4 methylation through OGT and SET1/COMPASS. EMBO J 2013; 32:645-55; PMID:23353889; http://dx.doi.org/10.1038/emboj.2012.357
- Vella P, Scelfo A, Jammula S, Chiacchiera F, Williams K, Cuomo A, Roberto A, Christensen J, Bonaldi T, Helin K, et al. Tet proteins connect the O-linked N-acetylglucosamine transferase Ogt to chromatin in embryonic stem cells. Mol Cell 2013; 49:645-56; PMID:23352454; http://dx.doi.org/10.1016/j.molcel.2012.12.019
- Okashita N, Kumaki Y, Ebi K, Nishi M, Okamoto Y, Nakayama M, Hashimoto S, Nakamura T, Sugasawa K, Kojima N, et al. PRDM14 promotes active DNA demethylation through the ten-eleven translocation (TET)-mediated base excision repair pathway in embryonic stem cells. Development 2014; 141:269-80; PMID:24335252; http://dx.doi.org/10.1242/dev.099622
- Perera A, Eisen D, Wagner M, Laube SK, Kunzel AF, Koch S, Steinbacher J, Schulze E, Splith V, Mittermeier N, et al. TET3 is recruited by REST for context-specific hydroxymethylation and induction of gene expression. Cell Rep 2015; 11:283-94; PMID:25843715; http://dx.doi.org/10.1016/j.celrep.2015.03.020
- Erdmann S, Senkel S, Arndt T, Lucas B, Lausen J, Klein-Hitpass L, Ryffel GU, Thomas H. Tissue-specific transcription factor HNF4alpha inhibits cell proliferation and induces apoptosis in the pancreatic INS-1 β-cell line. Biol Chem 2007; 388:91-106; PMID:17214554; http://dx.doi.org/10.1515/BC.2007.011
- Assenov Y, Muller F, Lutsik P, Walter J, Lengauer T, Bock C. Comprehensive analysis of DNA methylation data with RnBeads. Nat Methods 2014; 11:1138-40; PMID:25262207; http://dx.doi.org/10.1038/nmeth.3115
- Mi H, Muruganujan A, Casagrande JT, Thomas PD. Large-scale gene function analysis with the PANTHER classification system. Nat Protoc 2013; 8:1551-66; PMID:23868073; http://dx.doi.org/10.1038/nprot.2013.092