Abstract
The importance of imprinted genes in regulating feto-placental development has been long established. However, a comprehensive assessment of the role of placental imprinted gene expression on fetal growth has yet to be conducted. In this study, we examined the association between the placental expression of 108 established and putative imprinted genes and birth weight in 677 term pregnancies, oversampled for small for gestational age (SGA) and large for gestational age (LGA) infants. Using adjusted multinomial regression analyses, a 2-fold increase in the expression of 9 imprinted genes was positively associated with LGA status: BLCAP [odds ratio (OR) = 3.78, 95% confidence interval (CI): 1.83, 7.82], DLK1 [OR = 1.63, 95% CI: 1.27, 2.09], H19 [OR = 2.79, 95% CI: 1.77, 4.42], IGF2 [OR = 1.43, 95% CI:1.31, 2.40], MEG3 [OR = 1.42, 95% CI: 1.19, 1.71], MEST [OR = 4.78, 95% CI: 2.64, 8.65], NNAT [OR = 1.40, 95% CI: 1.05, 1.86], NDN [OR = 2.52, 95% CI: 1.72, 3.68], and PLAGL1 [OR = 1.85, 95% CI: 1.40, 2.44]. For SGA status, a 2-fold increase in MEST expression was associated with decreased risk [OR = 0.31, 95% CI: 0.17, 0.58], while a 2-fold increase in NNAT expression was associated with increased risk [OR = 1.52, 95% CI: 1.1, 2.1]. Following a factor analysis, all genes significantly associated with SGA or LGA status loaded onto 2 of the 8 gene-sets underlying the variability in the dataset. Our comprehensive placental profiling of imprinted genes in a large birth cohort supports the importance of these genes for fetal growth. Given that abnormal birth weight is implicated in numerous diseases and developmental abnormalities, the expression pattern of placental imprinted genes has the potential to be developed as a novel biomarker for postnatal health outcomes.
Introduction
Abnormal fetal growth has implications for health outcomes later in life. In fact, both undergrowth and overgrowth have been associated with metabolic as well as cognitive disorders.Citation1-4 The relevance of specific imprinted genes on appropriate fetal and placental growth has been long established. These genes represent a subset of loci that are monoallelically expressed in a parent-of-origin manner and are predominately active in the placenta during fetal development.Citation5 Early studies delineating the function of imprinted genes indicated a trend in which paternally expressed genes are involved in processes that increase nutritional intake to maximize fetal growth and maternally expressed genes are involved in processes that restrict fetal growth to preserve maternal fitness.Citation6 While this hypothesis has not been entirely validated, these studies do suggest that appropriate fetal growth is dictated by the carefully-regulated balance in the expression of these genes.
Clinical manifestations of syndromic disorders resulting from mutations or deletions in imprinted genes implicate the pivotal role of imprinting on fetal growth. For example, Beckwith-Wiedemann-associated defects, resulting in either heightened activity of paternally-expressed genes or diminished activity of maternally-expressed genes, lead to overgrowth, while Silver-Russell-associated defects, resulting in either heightened activity of maternally-expressed genes or diminished activity of paternally-expressed genes, lead to undergrowth.Citation7,8
While the clinical manifestations associated with such disorders have informed our understanding of the relevance of imprinted genes on the development of the feto-placental unit, such severe disruption of gene activity occurs relatively rarely. Few studies have examined the impact of more subtle variations in the expression of imprinted genes on growth and development. From a public health perspective, such variability likely would have greater relevance by potentially contributing to common variation in growth phenotypes.
While there are approximately 100 genes currently known to be imprinted in humans, additional genes have been predicted based on computational analysis.Citation9,10,11 Furthermore, most studies have restricted their focus on assessing a few loci at a time. A widespread assessment of the role of the expression of imprinted genes on fetal growth has yet to be conducted.
Herein, we carried out a comprehensive profiling study of imprinted genes in a large collection of placenta samples from a population-representative birth cohort, the Rhode Island Child Health Study (RICHS), and investigated the association between the expression of these genes and birth weight.
Results
Participant characteristics
The demographics and clinical characteristics of the mother-infant pairs profiled for gene expression are shown in . Significant differences in maternal and infant characteristics were observed across birth weight categories. Mothers of small for gestational age (SGA) infants were more likely to be younger and were of lower socioeconomic status than mothers of infants with either appropriate for gestational age (AGA) or large for gestational age (LGA) birth weight status. A greater proportion of SGA infants were girls, non-Caucasian, and were born at early or late gestational age compared to infants who were AGA or LGA. Mothers of LGA infants were more likely to have higher body mass index (BMI) than mothers of infants who were AGA or SGA.
Table 1. Characteristics of study population (n = 677) by birth weight category
Gene expression
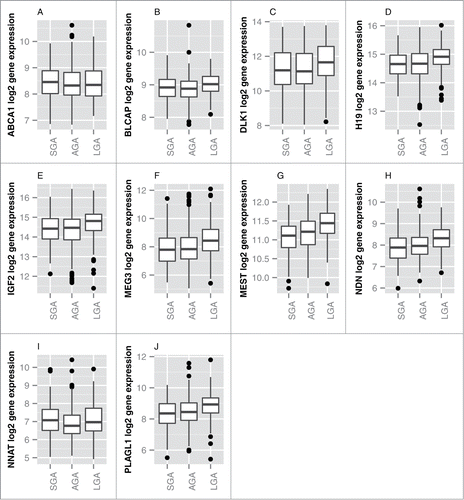
The panel of 108 established imprinted genes was informed by 2 existing databases, www.geneimprint.com and http://igc.otago.ac.nz. Thirty-six putatively imprinted genes were inferred based on computational analysis of RNAseq data from an independent placenta cohort (Andrew J. Sharp, unpublished data). Out of the 144 imprinted genes profiled in the placenta, 108 genes were considered to be consistently expressed in >50% of samples (Table S1). A false discovery rate (FDR)-corrected ANOVA analysis was first conducted to identify candidate genes related to birth weight. Based on this analysis, 10 genes were differentially expressed (q < 0.05) across birth weight categories (i.e., SGA, AGA, and LGA) (). Six of the ten genes, ABCA1, BLCAP, MEG3, MEST, NDN, and PLAGL1, were upregulated in LGA infants compared to SGA infants. Four genes, DLK1, H19, IGF2 and NNAT, were up-regulated among LGA infants compared to both SGA and AGA infants.
Figure 1. Panel of genes identified to be differentially expressed by birth weight category (FDR < 0.05). Boxes represent the first to third quartiles of each distribution, with the median indicated by the horizontal bar. The upper whisker extends to the highest point within 1.5x inter-quartile range (IQR) from the upper quartile, and the lower whisker extends to the lowest point within 1.5× IQR from the lower quartile. Outlier data points are shown as filled circles.
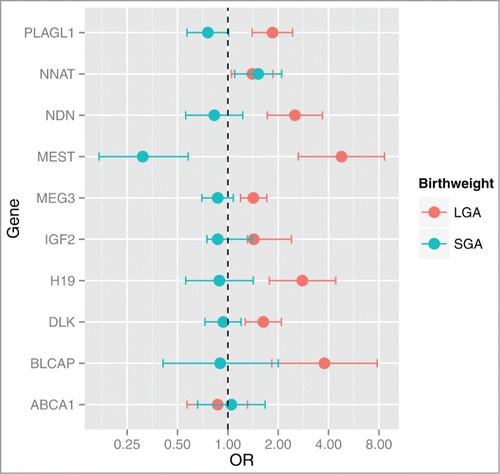
We then carried out a multinomial regression analysis of the identified genes to further assess the association between the expression of these genes and birth weight adjusted for potential confounding factors. A two-fold increase in the expression of nine genes was associated with increased odds ratio (OR) of LGA status ranging from MEST (OR = 4 .78, 95% CI: 2.64, 8.65) to NNAT (OR = 1.40, 95% CI: 1.05, 1.86), compared to AGA status, conditional on SGA status. Consistently, a two-fold increase in the expression of MEST was protective from SGA status (OR = 0.31, 95% CI: 0.17, 0.58), compared to AGA, conditional on LGA. However, an increased odds of SGA status was also observed with increased expression of NNAT (OR = 1.52, 95% CI: 1.1, 2.1) (). No evidence of effect modification due to gender or maternal pre-pregnancy BMI was observed in any of the models.
Figure 2. Odd ratios and 95% CI for SGA or LGA status for a log2 unit increase in gene expression. Multinomial regression analysis referenced against AGA status indicates that the expression levels of BLCAP, DLK1, H19, IGF2, MEG3, MEST, NDN, NNAT and PLAGL1 are positively associated with LGA status. NNAT is positively associated with SGA and MEST is negatively associated with SGA status. Odds ratios (OR) and 95% CI are shown on the x-axis for each gene's association with birth weight (y-axis).
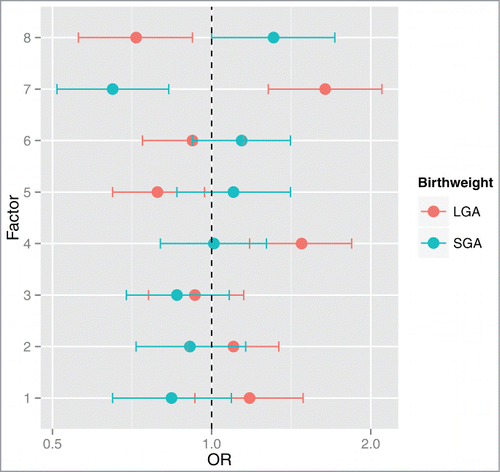
Among the 108 imprinted genes that are expressed in the profiled placentas, we observed that the expression levels of many genes were correlated with one another. To decrease the dimensionality of the dataset and consider this correlation structure in understanding the relationships between imprinted gene expression and birth weight, we conducted a factor analysis (). Eight factors were observed to underlie the structure of the data (). Multinomial regression analysis revealed 4 of these factors (Factors 4, 5, 7, and 8) were significantly associated with birth weight category (). The genes initially observed to be individually, differentially expressed by birth weight category loaded onto two out of the four factors associated with birth weight. Seven out of the ten genes, DLK1, H19, IGF2, MEG3, NDN, PLAGL1 and NNAT, loaded onto Factor 4, and two genes, MEST and BLCAP, loaded onto Factor 7.
Figure 3. Correlation plot of expression of imprinted genes in the placenta. Pairwise correlations (Pearson R-values) are depicted for gene pairs labeled on the diagonal axes. Genes were ordered according to the factors they load onto, with factors indicated along the top axis. The side legend depicts the color gradient indicating directionality, positive (blue) and negative (red), and strength of the correlation (magnitude of correlation coefficient). Gray crosses in the plot indicate correlations with a significance level above 0.05.
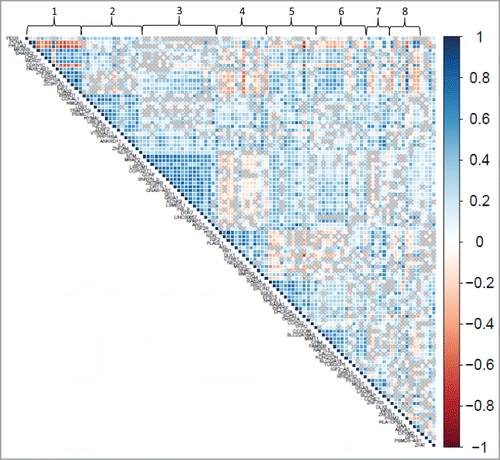
Table 2. Gene loadings of factors derived from factor analysisa
Figure 4. Odd ratios and 95% CI for SGA or LGA status for a log2 unit increase in factor scores. Multinomial regression analysis referenced against AGA status indicates that Factors 4 and 7 are positively associated with LGA status. Additionally, Factor 7 is negatively associated with SGA status and Factors 5 and 8 are negatively associated with LGA status. Odds ratios (OR) and 95% CI are shown on the x-axis for each factor's association with birth weight (y-axis).
Methylation of imprinted genes
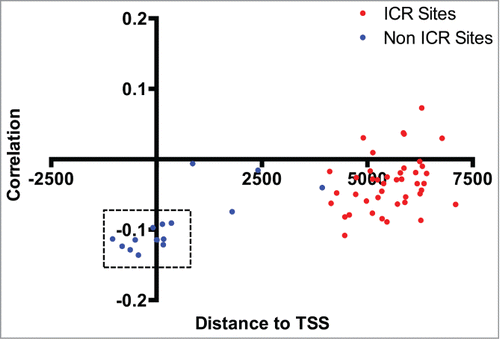
Genome-wide methylation data generated with the Illumina Infinium HumanMethylation450 BeadChip Array (450K) were available for a subset of the placenta samples examined (n = 211) from a prior study.Citation12 Using this data, we carried out secondary data analyses in the context of imprinted genes. In surveying the methylation data-set, we identified a cluster of MEST-affiliated CpG sites among the top 20 most differentially methylated regions based on birth weight. We observed increased MEST methylation among SGA infants, a finding that is consistent with the lower MEST transcript levels among SGA infants observed in our gene expression data (). Additionally, a modest inverse correlation was observed between the methylation level of these sites and MEST expression level (). Interestingly, these CpG loci are clustered around the transcription start site, outside the defined imprinting control region (ICR) for this gene. Furthermore, the methylation status of all other reported ICR sites linked to genes profiled for expression in the current study were not associated with birth weight or correlated with expression levels of the corresponding gene.
Figure 5. MEST contains differentially methylated sites based on birth weight status. Genomic coordinates of CpG loci profiled on the Illumina 450K array are provided on the x-axis and the extent of methylation (y-axis) is represented by the β value, with 1 indicating fully methylated and 0 indicating fully unmethylated. The transcription site is indicated by the dashed vertical line. Higher median MEST methylation levels are observed among SGA infants (red).
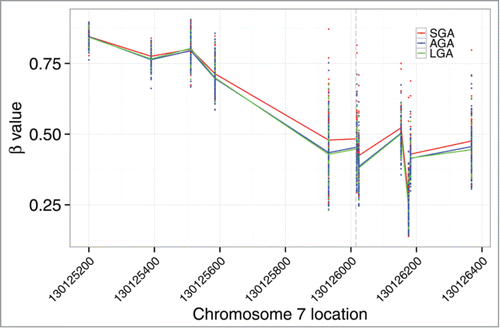
Figure 6. Correlation between MEST methylation and expression levels. Distance to the transcriptional start site (at 0) of the MEST gene (x-axis) and correlation coefficient (y-axis) for individual CpG loci profiled on the Illumina 450K array are shown, and sites in the known imprinting control region are designated as red dots. A modest correlation is observed between MEST expression level and methylation sites clustered around the transcription start site. CpG loci corresponding to sites differentially methylated by birth weight status are indicated by dashed rectangles.
Discussion
This study provides a comprehensive examination of the pattern of placental expression of imprinted genes and supports the importance of the expression of these genes in the placenta for fetal growth. The 9 imprinted genes we identified driving these phenotypes showed levels of expression that were, for the most part, positively associated with LGA status and include several genes previously implicated with birth weight. Genetic variants in H19,Citation13 methylation levels at differentially methylated regions (DMRs) of MEG3,Citation14 PLAGL1,Citation14-16 and IGF2/H19,Citation15,17 and protein levels of IGF2Citation18 have been observed to be relevant to birth weight, although the direction of the association with birth weight across these studies is not always consistent. For example, while paternally expressed IGF2 serum levels and mRNA expression levels have been positively associated with infant birth weight,Citation17,18 both positive and negative associations have been reported linking IGF2-DMR methylation with birth weight.Citation15,17,18 Such discrepancies, particularly relating DMR methylation and expression, is not uncommon in the literature and points to the importance of further clarifying the regulatory process of these genes.
In addition to validating the existing literature, we also identified novel loci associated with birth weight, including the expression levels of BLCAP, MEST, NNAT, and NDN. Notably, the strongest association we observed in our study was in relation to the expression levels of MEST, a paternally expressed gene implicated in adipogenesis, but thus far not observed to be associated with birth weight.Citation19 This gene demonstrated the strongest trends in its relationship with growth status, as increased expression was not only linked to LGA growth, but also with a protective effect on SGA status. This is in contrast to NNAT, a gene putatively linked with glucose transport in the placenta.Citation20 In our study, this gene demonstrated a U-shaped relationship to growth, where increased expression indicated risk for both LGA and SGA status, suggesting a more complicated connection to these outcomes, and the potential importance of highly coordinated regulation.
It should be noted that we did not identify certain imprinted genes, including PHLDA2, previously reported to be associated with birth weight. This is likely due to the fact that most previous studies focused on a candidate set of 5–10 genes, while our panel included over 100 genes. As a result, while PHLDA2 was observed to be differentially expressed by birth weight category (P = 0.01) in our analysis, it did not withstand more stringent FDR-correction.
Our prior work had suggested that the expression of these genes can be correlated,Citation21,22 and, often, the reliance of multiple imprinted genes on single imprinting control regions could be underlying this phenomenon, at least in some cases.Citation23 Dimension reduction using a factor analysis confirmed these observations in this larger gene set and population and revealed several important trends in the data. The 9 genes observed to be significantly associated with birth weight loaded onto 2 factors, with 7 of the identified gene targets loading onto the same factor, indicating the level of redundancy in the identified gene targets. As indicated by , the variance in this factor is most strongly correlated with H19 and NDN, suggesting these genes may be the most significant contributors to this factor. Additionally, while ABCA1 was observed to be differentially expressed based on the ANOVA analysis, it was not significantly associated with birth weight in the adjusted regression models. However, in the context of the other genes present in its factor, a significant association is observed. Similarly, one factor was observed to be associated with birth weight that contained no genes from the initial analysis, suggesting that the respective independent effects of the genes in the factor are too weak to reach significance, while an effect becomes observable in the context of the factor, representing the coordinated expression.
As correlated genes load onto common factors, the factors themselves may be indicative of common biological processes. However, distinct biological processes capable of distinguishing the functions of factor-specific gene-sets from one another are not discernable based on an Ingenuity Pathways Analysis to examine differences in pathways over-represented by genes loaded to the factors. On the other hand, known co-regulated loci are located in Factor 1 (CDKN1C/PHLDA2), and Factor 4 (H19/IGF2 and DLK1/MEG3), therefore, the inclusion of other genes within these factors may suggest additional levels of trans regulation beyond those previously described. The nature of these trans co-regulatory processes is worthy of further investigation.
DNA methylation analysis (450K) revealed that CpG sites linked to MEST are differentially methylated based on birth weight status. Additionally, correlations were observed between these sites and MEST expression. The modest strength of the correlation could suggest regions missed by the array are important or that the variability in expression is largely not mediated by DNA methylation, but through other mechanisms, such as modifications of histone complexes or posttranscriptional factors. Similarly, the largely independent associations with birth weight suggest that modifications in methylation and expression levels of these targets represent independent processes converging on a common biological pathway. For example, posttranscriptional modifications may be most indicative of eventual protein levels, while methylation levels lead to a more subtle attenuation of transcript levels but are also representative of conformational changes to the chromosome that make the region inaccessible for additional birth weight relevant factors.
This study represents the most comprehensive profiling of the expression of imprinted genes in the placenta of healthy term pregnancies. The large sample size and sampling scheme based on birth weight status ensured sufficient power to detect meaningful risk factors for birth weight. Additionally, expression was profiled in the placenta, the principal regulator of fetal development and the organ in which imprinted gene expression is most active during the in utero period. However, certain limitations were also inherent to our study design. While the over-representation of infants at the extremes of the birth weight spectrum increased our power to detect birth weight related expression differences, the sampling scheme could limit the generalizability of the findings to the general population. Additionally, while abnormal fetal development is known to result in later onset morbidities, the role of imprinting on these conditions cannot be assessed as no additional follow-up information is available in this study population at this time. Also, as measurements are obtained at term, we are unable to capture the dynamics in the expression of these genes throughout the in utero period and, therefore, are unable to identify potential critical windows of susceptibility. Finally, given our focus on global expression levels, we did not measure the loss of imprinting, reflected as change in allele-specific expression, in the current study. However, the importance of imprinted genes in fetal growth and development suggests that any perturbation in the activity of these genes may be relevant for birth outcomes, as we indeed observed in our study. Nevertheless, a more refined analysis that captures allele-specific expression levels of these genes would provide additional insights into the mechanistic implications of these genes.
In summary, we have identified a panel of known and novel imprinted genes relevant to birth weight, supporting the importance of genomic imprinting on fetal development. Given that abnormal birth weight has been implicated in altered growth trajectories and developmental abnormalities later in life, elucidating mechanisms of abnormal fetal development is of prime importance to provide insight into potential interventional endpoints. This disregulation is likely mediated by genetic as well as environmental factors. Genomic imprinting is a key pathway in facilitating placental processes to regulate fetal growth, and as imprinting is epigenetically-regulated, expression of these genes is likely susceptible to perturbations in the in utero environment, providing a plausible interface through which genes and the environment interact to impact fetal growth. Hence, placental profiling of imprinted genes, assessed at birth, has the potential to be developed as a novel biomarker for postnatal health outcomes later in life.
Materials and Methods
Study population
Women-infant pairs participating in the Rhode Island Child Health Study (RICHS) were enrolled over the course of 4 years from 2009–2013 (n = 899) following delivery at Women and Infants Hospital of Rhode Island, which performs >74% of all deliveries in Rhode Island. Infants born small for gestational age (SGA, lowest 10th percentile) and large for gestational age (LGA, highest 10th percentile), based on the 2013 Fenton growth curves were enrolled. For each SGA and LGA infant, an infant born appropriate for gestational age matched on gender, gestational age (± 3 days), and maternal age (± 2 years), was also recruited. Exclusion factors included multiple pregnancies, maternal age <18, life-threatening maternal complications, and congenital/chromosomal abnormalities of the infant. Lifestyle/demographic characteristics and exposure histories were obtained from structured chart reviews of medical records and interviewer-based questionnaires. All enrolled participants provided written consent of protocols approved by the Institutional Review Boards for Women and Infants Hospital and Dartmouth College.
Tissue collection, DNA/RNA extraction, and bisulfite modification
Placental samples suitable for expression analysis were available from 684 study subjects. Approximately 1 g of placental tissue consisting of sections from four quadrants was excised 2 cm from the cord insertion site, free of maternal decidua, within 2 hours of delivery. The biopsies were immediately placed in RNALater (Life Technologies, #AM7024) and stored at 4°C. Following a minimum of 72 hours, the tissues were blotted dry, snap-frozen in liquid nitrogen, homogenized with mortar and pestle, and stored at −80°C. DNA and RNA were extracted using QIAmp DNA mini kit (Qiagen, #51306) and RNeasy mini kit (Qiagen, #74106), respectively, following the manufacturer's protocol. Nucleic acid quantification was assessed using a Nanodrop ND-1000 instrument (Thermo Fisher, CA). RNA was aliquoted and stored at −80°C.
Gene expression profiling
Placental RNA was profiled using a custom-designed code-set containing 144 imprint-related genes (Nanostring technologies, WA). These genes include literature-established known imprinted genes (n = 108) and computationally-derived putative imprinted genes (A. Sharp, unpublished data) (n = 36). Briefly, 100 ng RNA was incubated in the presence of reporter and capture probes overnight at 65°C. Following hybridization, unbound probes were removed, and the purified complexes were aligned and immobilized on imaging cartridges using an nCounter Prep station. Cartridges were then sealed and scanned in an nCounter Digital Analyzer for code count detection.
DNA methylation analysis
DNA (500 ng) was bisulfite-modified using an EZ DNA Methylation Kit (Zymo Research, #D5002) and assessed at the Biomedical Genomics Center at the University of Minnesota (Minneapolis, MN) for epigenome-wide DNA methylation levels using the Infinium HumanMethylation450 BeadChip (450K; Illumina, CA) following standardized procedures for the genomics core. DNA samples were randomized by birth weight group across several plates for analysis. The raw data was assembled using the BeadStudio methylation software package (Illumina).
Statistical analysis
All analysis was conducted using R 3.0.2.Citation24 The NanoString Norm packageCitation25 was used to normalize nCounter data. Specifically, raw nCounter code counts were first normalized against the geometric mean of spike-in controls to account for differences in hybridization and recovery. Differences in sample content were accounted for by normalizing the data against the geometric mean of standard housekeeping genes (GAPDH, RPL19, RPLP0). Finally, the background threshold of detection was set at two standard deviations (SD) above the mean of the included negative controls. Seven samples were removed based on quality control failure, leaving a final sample size of 677 subjects.
The subsequent analysis was restricted to the subset of expressed genes, with expression defined as surpassing the background threshold in >50% of the samples. Based on this criterion, 108 of the 144 genes were determined to be expressed and included in the subsequent analyses.
Genes differentially expressed by birth weight categories were identified using LIMMA,Citation26 which employs an empirical Bayes method to fit linear models for each gene in the data set with a moderated standard error, generating a moderated F-statistic. Multiple comparisons were accounted for using the Benjamini-Hochberg based false discovery rate (FDR). The identified candidate genes were further evaluated using multinomial regression models in the nnet package.Citation27 The outcome was modeled with SGA and LGA infants referenced against AGA infants. All models were adjusted for batch, infant gender, maternal age, maternal pre-pregnancy BMI, gestational weight gain, parity, infant ethnicity, and maternal insurance. Effect modifications on the associations between imprint gene expression levels and birth weight due to infant gender and maternal pre-pregnancy BMI were assessed. To address the dimensionality of the data, multinomial regression models were also run on factor analysis-derived correlated gene-sets. Factor analysis was conducted using the psych package,Citation28 with scree plots generated using the nFactor packageCitation29 to determine the number of factors underlying the data. Based on parallel analysis for factor retention,Citation30 8 factors were observed to primarily account for the variance of the data. Correlation plots were generated using the corrplot packageCitation31 and forest plots were generated using the ggplot2 package.Citation32
For the 450K array, DNA methylation analysis, probes were removed from the analysis if they were present on the X- or Y-chromosome, previously identified as cross-hybridizing with other genomic locations or contained a single nucleotide polymorphism.Citation33 Probes identified as having detection P-values >0.01 in at least one sample were also removed. This resulted in a final data set of 336,484 autosomal probes from 336 unique samples. The data was then normalized and batch-corrected as previously described.Citation12
To determine the correlation between methylation and expression levels, the 450K data was subsetted to sites with UCSC gene annotations matching assayed imprinted genes. For each CpG site, Pearson correlation coefficients were determined between CpG site methylation and nCounter expression levels for the matching gene.
Differential methylation regions by birth weight category were identified based on a tunable kernel smoothing of the differential methylation signal,Citation34 using the DMRcate package.Citation35
Disclosure of Potential Conflicts of Interest
No potential conflicts of interest were disclosed.
1073881_Supplemental_Material.docx
Download MS Word (13.1 KB)Supplemental Material
Supplemental data for this article can be accessed on the publisher's website.
Funding
This work was supported by grants from the National Institutes of Health (R01 HD067611; R01ES022223; R01MH094609) and Mount Sinai Children's Environmental Health Center Pilot Fund. AJS is supported by NIH grants DA033660, HG006696, HD073731, and MH097018, and research grant 6-FY13–92 from the March of Dimes Foundation.
References
- Boney CM, Verma A, Tucker R, Vohr BR. Metabolic syndrome in childhood: association with birth weight, maternal obesity, and gestational diabetes mellitus. Pediatrics 2005; 115: e290-6; PMID:15741354; http://dx.doi.org/10.1542/peds.2004-1808
- Van Lieshout RJ, Boyle MH. Canadian youth born large or small for gestational age and externalizing and internalizing problems. Can J Psychiatry 2011; 56: 227-34; PMID:21507279
- Moore GS, Kneitel AW, Walker CK, Gilbert WM, Xing G. Autism risk in small- and large-for-gestational-age infants. Am J Obstet Gynecol 2012; 206: 314.e1-9
- Colman I, Ataullahjan A, Naicker K, Van Lieshout RJ. Birth weight, stress, and symptoms of depression in adolescence: evidence of fetal programming in a national Canadian cohort. Can J Psychiatry 2012; 57: 422-8; PMID:22762297
- Bartolomei MS, Ferguson-Smith AC. Mammalian genomic imprinting. Cold Spring Harb Perspect Biol 2011; 3:pii: a002592; PMID:21576252; http://dx.doi.org/10.1101/cshperspect.a002592.
- Moore T, Haig D. Genomic imprinting in mammalian development: a parental tug-of-war. Trends Genet 1991; 7: 45-9; PMID:2035190; http://dx.doi.org/10.1016/0168-9525(91)90040-W
- Choufani S, Shuman C, Weksberg R. Molecular findings in Beckwith-Wiedemann syndrome. Am J Med Genet C Semin Med Genet 2013; 163C: 131-40; PMID:23592339; http://dx.doi.org/10.1002/ajmg.c.31363
- Azzi S, Abi Habib W, Netchine I. Beckwith-Wiedemann and Russell-Silver Syndromes: from new molecular insights to the comprehension of imprinting regulation. Curr Opin Endocrinol Diabetes Obes 2014; 21: 30-8; PMID:24322424; http://dx.doi.org/10.1097/MED.0000000000000037
- Jirtle RL. geneimprint. 2012. http://www.geneimprint.com.
- Luedi PP, Dietrich FS, Weidman JR, Bosko JM, Jirtle RL, Hartemink AJ. Computational and experimental identification of novel human imprinted genes. Genome Res 2007; 17: 1723-30; PMID:18055845; http://dx.doi.org/10.1101/gr.6584707
- Barbaux S, Gascoin-Lachambre G, Buffat C, Monnier P, Mondon F, Tonanny MB, Pinard A, Auer J, Bessières B, Barlier A, et al. A genome-wide approach reveals novel imprinted genes expressed in the human placenta. Epigenetics 2012; 7: 1079-90; PMID:22894909; http://dx.doi.org/10.4161/epi.21495
- Maccani JZ, Koestler DC, Lester B, Houseman EA, Armstrong DA, Kelsey KT, Marsit CJ. Placental DNA Methylation Related to Both Infant Toenail Mercury and Adverse Neurobehavioral Outcomes. Env Heal Perspect 2015; doi:10.1289/ehp.1408561
- Adkins RM, Somes G, Morrison JC, Hill JB, Watson EM, Magann EF, Krushkal J. Association of birth weight with polymorphisms in the IGF2, H19, and IGF2R genes. Pediatr Res 2010; 68: 429-34; PMID:20639793
- Hoyo C, Daltveit AK, Iversen E, Benjamin-Neelon SE, Fuemmeler B, Schildkraut J, Murtha AP, Overcash F, Vidal AC, Wang F, et al. Erythrocyte folate concentrations, CpG methylation at genomically imprinted domains, and birth weight in a multiethnic newborn cohort. Epigenetics 2014; 9: 1120-30; PMID:24874916; http://dx.doi.org/10.4161/epi.29332
- Liu Y, Murphy SK, Murtha AP, Fuemmeler BF, Schildkraut J, Huang Z, Overcash F, Kurtzberg J, Jirtle R, Iversen ES, et al. Depression in pregnancy, infant birth weight and DNA methylation of imprint regulatory elements. Epigenetics 2012; 7: 735-46; PMID:22677950; http://dx.doi.org/10.4161/epi.20734
- Vidal AC, Murphy SK, Murtha AP, Schildkraut JM, Soubry A, Huang Z, Neelon SE, Fuemmeler B, Iversen E, Wang F, et al. Associations between antibiotic exposure during pregnancy, birth weight and aberrant methylation at imprinted genes among offspring. Int J Obes (Lond) 2013; 37: 907-13; PMID:23609933; http://dx.doi.org/10.1038/ijo.2013.47
- St-Pierre J, Hivert MF, Perron P, Poirier P, Guay SP, Brisson D, Bouchard L. IGF2 DNA methylation is a modulator of newborn's fetal growth and development. Epigenetics 2012; 7: 1125-32; PMID:22907587; http://dx.doi.org/10.4161/epi.21855
- Hoyo C, Fortner K, Murtha AP, Schildkraut JM, Soubry A, Demark-Wahnefried W, Jirtle RL, Kurtzberg J, Forman MR, Overcash F, et al. Association of cord blood methylation fractions at imprinted insulin-like growth factor 2 (IGF2), plasma IGF2, and birth weight. Cancer Causes Control 2012; 23: 635-45; PMID:22392079; http://dx.doi.org/10.1007/s10552-012-9932-y
- Voigt A, Agnew K, van Schothorst EM, Keijer J, Klaus S. Short-term, high fat feeding-induced changes in white adipose tissue gene expression are highly predictive for long-term changes. Mol Nutr Food Res 2013; 57: 1423-34; PMID:23413212; http://dx.doi.org/10.1002/mnfr.201200671
- Gu T, Su X, Zhou Q, Li X, Yu M, Ding Y, Zhao S, Li C. Molecular characterization of the Neuronatin gene in the porcine placenta. PLoS One 2012; 7: e43325; PMID:22937033; http://dx.doi.org/10.1371/journal.pone.0043325
- Lambertini L, Marsit CJ, Sharma P, Maccani M, Ma Y, Hu J, Chen J. Imprinted gene expression in fetal growth and development. Placenta 2012; 33: 480-6; PMID:22465419; http://dx.doi.org/10.1016/j.placenta.2012.03.001
- Marsit CJ, Lambertini L, Maccani MA, Koestler DC, Houseman EA, Padbury JF, Lester BM, Chen J. Placenta-imprinted gene expression association of infant neurobehavior. J Pediatr 2012; 160: 854-860.e2; PMID:22153677; http://dx.doi.org/10.1016/j.jpeds.2011.10.028
- Barlow DP, Bartolomei MS. Genomic imprinting in mammals. Cold Spring Harb Perspect Biol 2014; 6:pii: a018382; PMID:24492710; http://dx.doi.org/10.1101/cshperspect.a018382
- Team, R. C. R: A Language and Environment for Statistical Computing. 2013. http://www.r-project.org/
- Waggott DM. NanoStringNorm: Normalize Nanostring miRNA and mRNA data. R package version 1.1.17. 2014. http://cran.r-project.org/package=NanoStringNorm
- Smyth GK. in Bioinforma. Comput. Biol. Solut. Using {R} Bioconductor (Gentleman, R., Carey, V., Dudoit, R., Irizarry, W. & Huber, W.) 397-420 (Springer, 2005)
- Venables WN, Ripley BD. (Springer, 2002). http://www.stats.ox.ac.uk/pub/MASS4
- Revelle W. psych: Procedures for Psychological, Psychometric, and Personality Research. 2014. http://cran.r-project.org/package=psych
- Raiche G. an R package for parallel analysis and non graphical solutions to the Cattell scree test. 2010. http://cran.r-project.org/package=nFactors
- Hayton JC, Allen DG, Scarpello V. Factor Retention Decisions in Exploratory Factor Analysis: A Tutorial on Parallel Analysis. Organ Res Methods 2004; 7: 191-205; http://dx.doi.org/10.1177/1094428104263675
- Wei T. corrplot: Visualization of a correlation matrix. 2013. http://cran.r-project.org/package=corrplot
- Wickham H. ggplot2: elegant graphics for data analysis. 2009. http://had.co.nz/ggplot2/book
- Chen YA, Lemire M, Choufani S, Butcher DT, Grafodatskaya D, Zanke BW, Gallinger S, Hudson TJ, Weksberg R. Discovery of cross-reactive probes and polymorphic CpGs in the Illumina Infinium HumanMethylation450 microarray. Epigenetics 2013; 8: 203-9; PMID:23314698; http://dx.doi.org/10.4161/epi.23470
- Peters TJ, Buckley MJ, Statham AL, Pidsley R, Samaras K, Lord RV, Clark SJ, Molloy PL. De novo identification of differentially methylated regions in the human genome. Epigenetics Chromatin 2015; http://dx.doi.org/10.1186/1756-8935-8-6; PMID:25972926
- Peters T, Buckley M. DMRcate: Illumina 450K methylation array spatial analysis methods. (2014)
