
Abstract
Although aberrant DNA methylation within imprinted domains has been reported in a variety of neoplastic diseases, it remains largely uncharacterized in the context of carcinogenesis. In this study, we induced T-cell lymphoma in mice by employing a breeding scheme involving mouse strains, LSL-KrasG12D and MMTV-Cre. We then systematically surveyed imprinted domains for DNA methylation changes during tumor progression using combined bisulfite restriction analysis and NGS-based bisulfite sequencing. We detected hyper- or hypo-methylation at the imprinting control regions (ICRs) of the Dlk1, Peg10, Peg3, Grb10, and Gnas domains. These DNA methylation changes at ICRs were more prevalent and consistent than those observed at the promoter regions of well-known tumor suppressors, such as Mgmt, Fhit, and Mlh1. Thus, the changes observed at these imprinted domains are the outcome of isolated incidents affecting DNA methylation settings. Within imprinted domains, DNA methylation changes tend to be restricted to ICRs as nearby somatic differentially methylated regions and promoter regions experience no change. Furthermore, detailed analyses revealed that small cis-regulatory elements within ICRs tend to be resistant to DNA methylation changes, suggesting potential protection by unknown trans-factors. Overall, this study demonstrates that DNA methylation changes at ICRs are dynamic during carcinogenesis and advocates that detection of aberrant DNA methylation at ICRs may serve as a biomarker to enhance diagnostic procedures.
Introduction
DNA methylation at imprinting control regions (ICRs) ensures proper dosage of imprinted genes by restricting their expression from only one allele based upon parental origin.Citation1 This strict gene dosage control makes sense given the fact that imprinted genes have critical roles in controlling fetal growth rates, brain functions and energy regulations.Citation1,2 The biochemical functions of many imprinted gene products are also in accordance with these roles, as they tend to be clustered in signaling pathways responsible for either cell growth or death.Citation3,4,Citation5 Consequently, perturbations to the epigenetic modifications that regulate imprinted gene dosage have been implicated as factors contributing to neoplastic transformation of tumor cells.Citation6,7 Among the approximate 100 imprinted genes identified thus far, the following genes are frequently associated with cancer: Insulin-Like Growth Factor 2 (Igf2), Igf2 Receptor (Igf2r), stimulatory GTPase α (Gnas), Delta-Like 1 Homolog (Dlk1), Paternally Expressed Gene 10 (Peg10), Paternally Expressed Gene 3 (Peg3), Pleiomorphic Adenoma Gene-Like 1 (Plagl1/Zac1), Growth Factor Receptor-Bound Protein 10 (Grb10), Ubiquitin Protein Ligase E3A (Ube3A), and Mesoderm-Specific Transcript (Mest).Citation8
Imprinting control regions (ICRs) are the key cis-regulatory elements that dictate the allele-specific expression patterns for entire imprinted domains.Citation1 ICRs and their associated allele-specific DNA methylation patterns are critical for establishing and maintaining genomic imprinting.Citation9 When an ICR is hyper- or hypo-methylated, it cannot properly control expression of the multiple mRNAs in the domain by either activating ncRNA in cis or interacting with proteins that insulate promoters from distal enhancer elements.Citation10 Given the role DNA methylation plays in the proper function of ICRs, it is reasonable to predict that aberrant DNA methylation of ICRs could disrupt the imprinting of entire domains, which could then contribute to malignant transformation. Indeed, both DNA methylation and genomic imprinting are challenged in cancer.Citation11,12 Therefore, within imprinted domains, ICRs may be particularly vulnerable to aberrant DNA methylation during tumor progression. However, the timing and prevalence of DNA methylation changes at ICRs have not been systematically investigated in the context of carcinogenesis.
To test if ICRs are particularly susceptible to epigenetic insult during carcinogenesis, we first induced lymphoblastic T-cell thymic lymphoma in mice using the KrasG12D mutation under control of the Cre/LoxP system, and then systematically characterized DNA methylation changes within imprinted domains during the progression of the disease from an early stage (hyperplastic) to a late stage (neoplastic). According to the results, DNA methylation changes tend to be restricted to certain regulatory elements within imprinted domains and accumulate progressively among the imprinted domains as the disease advances toward more infiltrative states. NGS-based bisulfite sequencing also revealed that certain CpG sites tend to avoid DNA methylation changes within ICRs that show overall change. In sum, this study demonstrates that DNA methylation changes are frequent and dynamic at ICRs during lymphoblastic T-cell thymic lymphoma carcinogenesis.
Results
Oncogenic KrasG12D expression results in an infiltrative T-cell neoplasm
In this study, we challenged a subset of murine cells in vivo with the KrasG12D mutation and concomitant abrogation of PEG3 protein seeking to test Peg3 as a tumor suppressor. To accomplish this, we employed 2 floxed alleles: LSL-KrasG12D and Peg3floxed (). First, the LSL-KrasG12D allele features a floxed set of polyA termination signals inserted between the 1st and 2nd exons of the Kras locus. The 2nd exon is modified with a point mutation causing a substitution (glycine to aspartic acid) for the 12th amino acid of the KRAS protein.Citation13,14 The termination cassette prevents transcription of the oncogenic KrasG12D form until it is removed by the activity of cyclic recombinase (Cre) (). Second, the Peg3floxed allele features the 6th exon flanked by 2 loxP sites and thus is excised upon Cre-mediated recombination.Citation15,16 The PEG3 protein cannot be translated from the modified ORF of Peg3del6 due to a frame shift and subsequent nonsense mutation. Therefore, when the recombined allele (Peg3del6) is paternally transmitted, the result is the abrogation of PEG3 protein due to the introduced mutation on the paternal allele and the silencing of the maternal allele by genomic imprinting ().
Figure 1. Targeting oncogenic KrasG12D expression and PEG3 deletion to the mouse thymus. (A) Upon Cre-mediated recombination: the allele housing the KrasG12D mutation (denoted by *12D) is conditionally expressed by removal of a tandem polyA signal. The critical exon 6 (denoted by yellow coloration) of Peg3 is conditionally deleted. Blue font denotes the allele is paternally inherited and pink font denotes the allele is maternally inherited. Gray boxes denote exons. Black triangles denote loxP sites. Filled in lollipops denote a methylated CpG island. Empty lollipops denote an unmethylated CpG island. (B) Breeding schematic from mating LSL-Kras+/G12D; Peg3+/del6 mice with MMTV-Cre mice to generate KPM, KM, PM, and M cohorts. (C) Specific PCR analysis of genomic DNA isolated from thymus confirms recombinant products for each of the targeted alleles.
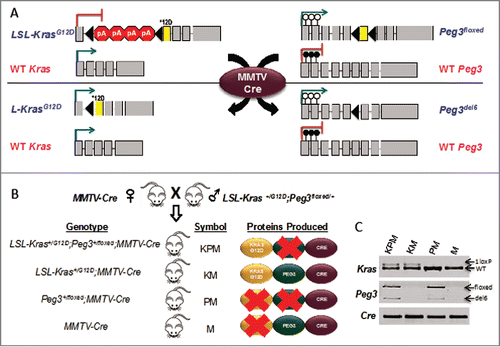
To target these mutations to various tissues/cell types in mice, we employed an allele that drives expression of Cre by the mouse mammary tumor virus long terminal repeat promoter (MMTV-Cre) ().Citation17 This allele has been shown to express Cre in many of the same cell types where both Kras and Peg3 are expressed.Citation18 The employed breeding scheme yielded 4 cohorts (). The two experimental cohorts were LSL-KrasG12D; Peg3floxed; MMTV-Cre (KPM) and LSL-KrasG12D; MMTV-Cre (KM), whereas the 2 negative control cohorts were Peg3floxed; MMTV-Cre (PM) and MMTV-Cre (M). In cells expressing MMTV-Cre, the proteins produced for each cohort are as follows: KPM (KRASG12D and Cre), KM (KRASG12D, PEG3 and Cre), PM (Cre), and M (PEG3 and Cre). Specific PCR genotyping of thymic DNA confirmed expected recombinant products for each cohort ().
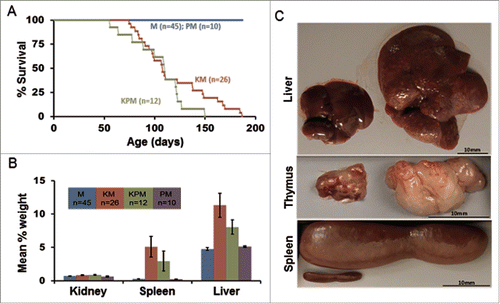
We obtained 17 litters from the breeding scheme described above, which yielded a total of 91 mice consisting of 12 KPM, 26 KM, 10 PM, and 43 M. In general, there were no obvious differences in the gross physical appearance of individuals for each cohort at birth; however, by one month of age, the coat for both KPM and KM mice appeared glossy and thin. This phenotype is thought to be the result of sebaceous gland hyperplasia (Fig. S1A-B). After one month of age, both KPM and KM mice started developing squamous papillomas on their mucus membranes, both oral and perianal (Fig. S1B). This is consistent with observations from previous studies of LSL-KrasG12D mice.Citation19 The squamous papillomas caused discomfort for the animals such that they experienced difficulties eating and defecating to a point that the animals of the KPM and KM cohorts often experienced significant weight loss (15% of body weight) by 2 to 4 months of age. Furthermore, within this time period, we observed that mice in both the KPM and KM cohorts started to experience labored breathing, lethargy, and signs of pain. Based on these observations, it was deemed necessary to euthanize animals showing signs of distress or significant weight loss. As a result, the survival of experimental cohorts (KPM and KM) was significantly reduced (P < 0.001) compared to that of the negative control cohorts (PM and M) such that the median survival for both experimental cohorts was approximately 90 d (). However, there was no significant difference in survival between the 2 experimental cohorts, KPM and KM (P = 0.8). These data indicate that the Peg3del6 allele in KPM mice did not have any additional effect on survival. Both negative control cohorts did not show any signs of distress, and remained healthy throughout the duration of the experiment. Furthermore, both experimental cohorts, KPM and KM, experienced significant burden due to increased size of liver (8.0 ± 1.1%, P < 0.001 and 11.3 ± 1.8, P < 0.001, mean percent of body weight, respectively), spleen (3.0 ±1.5%, P < 0.001 and 5.1 ± 1.5%, P < 0.001, mean percent of body weight, respectively), and thymus compared to those of negative control littermates (). Thymus data were not collected due to the size reduction of this organ as the negative control mice age. In KPM and KM mice, the pressure imposed by the oversized liver and spleen most likely resulted in abdominal pain, and the pressure imposed by the oversized thymus most likely caused partial lung collapse resulting in shortness of breath and lethargy. Furthermore, histopathological analyses of the liver and spleen revealed that these 2 organs had marked extramedullary hematopoiesis accompanied, in the spleen, by lymphohistiocytic proliferation in the white pulp (Fig. S1C-F). In summary, expression of KrasG12D was primarily responsible for the observed phenotypes and expression of Peg3del6 did not enhance or contribute to these phenotypes.
Figure 2. Gross features of mice expressing the KrasG12D mutation. (A) Kaplan-Meier comparative survival analysis of KM, KPM, PM, and M cohorts. Median survival of KPM and KM mice was significantly less than PM and M cohorts (P< 0.001, log-rank test, for each pairwise combination). (B) Organ weight profiles of KPM, KM, PM, and M cohorts. Spleen and liver percent of body weight was significantly increased in KPM and KM cohorts (P < 0.001, pairwise t-test). (C) Images of hepatomegaly, enlarged thymus, and splenomegaly.
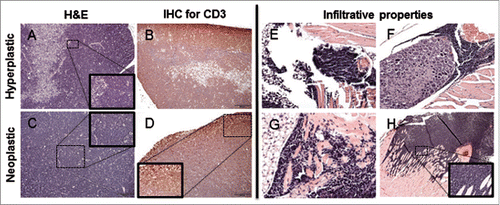
The mice expressing KrasG12D developed an infiltrative thymic neoplasm. One-month-old mice had marked expansion of the cortex by a heterogeneous cell population composed of small and large lymphocytes (). Older, 3-month-old mice had the thymic architecture completely effaced by dense sheets of neoplastic lymphoid cells morphologically consistent with lymphoblast ().Citation19,20,Citation21,22 Furthermore, neoplastic cells were CD3 positive and PAX5 negative (). Neoplastic cells variably infiltrated the adjacent adipose tissue, the dorsal root ganglia, the myocardium at the base of the heart, the wall of the ventral (sternum) and dorsal thorax, and the ventral neck musculature ().
Figure 3. Histological thymic alterations in KM mice. (A) The cortex is expanded by a heterogeneous (hyperplastic) lymphoid cell population, with retention of the normal thymic architecture in a 1-month-old KM mouse. (B) The architecture of the hyperplastic thymus in a 1-month-old KM mouse is maintained, with the majority of CD3 immunopositive cells in the cortex. (C) The normal architecture of the thymus is completely effaced by a lymphoid round cell neoplasm in a 2.5-month-old KM mouse. (D) Neoplastic lymphoid cells effacing the thymus in a 2.5-month-old KM mouse are diffusely CD3 immunopositive, consistent with T-cell origin of the neoplasm. (E-G) H&E staining of nearby tissues. (E) Neoplastic cells invade adjacent adipose tissue. (F) Neoplastic cells encircling ganglia. (H) Neoplastic cells invade the myocardium at the base of the heart (G) Neoplastic cells invade the musculature of the sternum. All insets show to neoplastic cells at 400X.
The percent of mice developing lymphoblastic T-cell thymic lymphoma was similar for both experimental cohorts, KPM and KM, each at 40%. This could be explained by the fact that anti-PEG3 staining in control and experimental mice was negative, suggesting that PEG3 is not produced in any cell type within the thymus (Fig. S2C and E). Because previous studies have suggested that Yin-yang 1 (YY1) may be a suppressor of Peg3 expression, we also performed anti-YY1 staining; however, similar to the anti-PEG3 staining, YY1 was not detected in any cell population within the thymus (Fig. S2D and F). Thus, these data indicate that the KrasG12D mutation is sufficient to initiate the development of an infiltrative T-cell neoplasm within the mouse thymus, and that the Peg3del6 mutation does not enhance the latency of KrasG12D-induced T-cell lymphoma.
DNA methylation changes at ICRs during progression of KrasG12D-induced lymphoblastic T-cell thymic lymphoma
For DNA methylation analyses, 15 experimental samples of the thymus (12 from KM mice and 3 from KPM mice) were selected: 5 hyperplastic, 5 atypically hyperplastic and 5 neoplastic lesions, as determined from clinical and pathological observations. The DNA methylation profiles of the experimental tissue samples were compared to those of negative control samples from the M cohort. Combined Bisulfite Restriction Analysis (COBRA) was used to initially screen for DNA methylation differences.Citation23 This series of analyses derived the following observations. First, significant changes in DNA methylation were more frequently observed within ICRs than the promoters of Tumor Suppressor Genes (TSG). For example, 5 ICRs (Ig, Peg10, Peg3, Nespas, and Grb10) were significantly hypermethylated, whereas only 2 TSG promoters (Mgmt and Fhit) were significantly hypermethylated, in the most advanced tumor sample (). The most affected was the Ig-ICR, showing significant hypermethylation in 73% of the samples. In contrast, hypermethylation within promoters of the most affected TSGs, Mgmt and Fhit, was only detected in 20% of the samples. Collectively, 60% of DNA from lymphoblastic T-cell thymic lymphoma displayed aberrant DNA methylation in 2 or more ICRs, whereas only 6% of these DNA displayed aberrant DNA methylation in 2 or more TSG promoters ().
Figure 4. Signature of aberrant DNA methylation in KrasG12D-induced lymphoblastic thymic T-cell lymphoma. Heat map summary of the quantified COBRA data for all ICRs tested in 15 thymic samples. Based on P values from pairwise T-test, each locus tested in the thymic samples was determined to be hypermethylated (red), hypomethylated (green), or not changed (gray). The gradation of yellow in the sample # column depicts progression of the disease state from hyperplastic (white) to atypically hyperplastic to neoplastic (yellow).
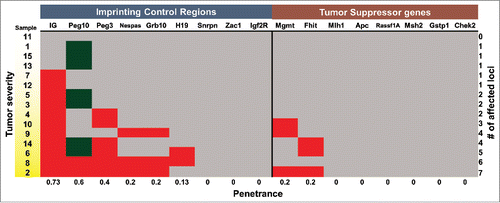
Second, the majority of changes observed in ICRs were hypermethylation. Only the Peg10-ICR displayed either hyper- or hypo-methylation among 60% of the samples. In this case, the frequency of hypermethylation was 0.13, whereas the frequency of hypomethylation was 0.47. Interestingly, hypomethylation of the Peg10-ICR was the only detectable change in 3 out of the 5 hyperplastic samples (). Thus, these data indicate that aberrant DNA methylation in the Peg10-ICR may be one of the first detectable changes in lymphoblastic T-cell thymic lymphoma.
Third, several tumor samples displayed both hyper- and hypo-methylation in the tested ICRs. In sample 6, the mean percent methylation of the Peg10-ICR reduced to 29 ± 4% (P = 0.006), yet mean percent methylation drastically increased to 84 ± 2% (P < 0.001) in the Ig-ICR and 87 ± 6% (P < 0.001) in the Peg3-ICR (; Fig. S3). These coexisting hyper- and hypo-methylation data indicate that changes within ICRs are not the result of global changes to the methylome toward hypermethylation at CpG islands; rather, these changes are the result of discrete events. In summary, these data demonstrate that aberrant DNA methylation within ICRs is precocious and dynamic in T-cell lymphoma. The complete set of mean percent methylation graphs for each ICR and DMR with significant changes is available (; Fig. S3).
Figure 5. Distal enhancer regions may prove to be effective biomarkers. A-B: Aberrant DNA methylation comparison of the Peg3-ICR and the Peg3-ECR18. A: COBRA of the Peg3-ICR. B: COBRA of the Peg3-ECR18. Unmethylated DNA is denoted with a U. Methylated DNA is denoted with a M. Stars represent significant increases in DNA methylation compared to normal DNA (denoted by the letter N). Experimental samples are numbered 1–15. Red represents hypermethylation, gray represents no change, and blue represents normal/control levels.
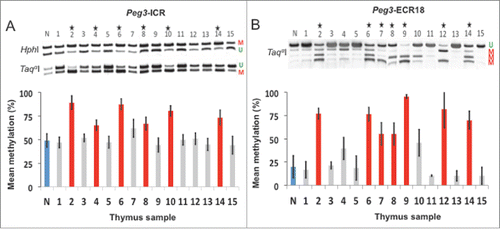
DNA methylation changes at distal enhancer within imprinted domains during progression of KrasG12D-induced lymphoblastic T-cell thymic lymphoma
We also surveyed DNA methylation in other regulatory regions within imprinted domains. First, we measured DNA methylation changes at distal enhancers, since these elements are known to be vulnerable during carcinogenesis.Citation24 For this test, we measured the DNA methylation levels of a putative enhancer found within the Peg3 domain, termed ECR18.Citation25 According to the results, the Peg3-ICR displayed significant hypermethylation in 6 out of 15 samples (#2, 4, 6, 8, 10, and 14), and Peg3-ECR18 displayed significant hypermethylation in 7 out of 15 samples (#2, 6, 7, 8, 9, 12 and 14). Interestingly, sample #7 displayed similar methylation levels at both the Peg3-ICR (62 ± 9%) and Peg3-ECR18 (55 ± 12%). However, the change in methylation was only significant for Peg3-ECR18 due to the low level of methylation at the enhancer region and 50% methylation at the ICR in normal tissue. Furthermore, the Peg3-ECR18 displayed significant hypermethylation in samples #9 and #12 while the ICR remained unaffected suggesting that the enhancer region acquired DNA methylation changes before the ICR.
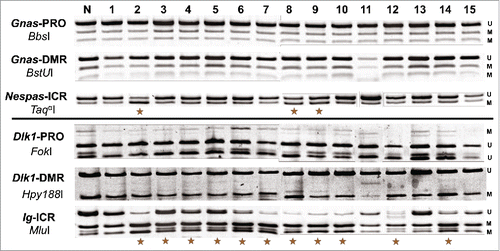
Second, we also surveyed the DNA methylation levels of the differentially methylated region (DMR) and promoter for the 2 imprinted genes, Gnas and Dlk1 (). Interestingly, neither the DMR nor the promoter for either gene displayed any changes in DNA methylation. However, the ICRs for both genes frequently experienced significant changes. The ICR for the Gnas domain, Nespas-ICR, was hypermethylated in 3 out of 15 samples and the ICR for the Dlk1/Gtl2 domain, Ig-ICR, was hypermethylated in 11 out of 15 samples (). These data demonstrate that ICRs are more sensitive to DNA methylation changes than DMRs or promoters. Taken together, these results demonstrate that ICRs and enhancer elements are both more sensitive to DNA methylation changes than DMRs or promoters, and that changes in methylation within enhancer elements may be more readily detectable.
Figure 6. Aberrant DNA methylation is targeted to ICRs within imprinted domains. Images generated from COBRA analysis of 3 regulatory regions within the Gnas and Dlk1/Gtl2 domains. For each domain, the ICR, a nearby DMR and a nearby promoter were measured. Unmethylated DNA is denoted with a U, while methylated DNA is denoted with an M. The enzymes used to digest each amplicon are presented under the name of each PCR product.
Bisulfite sequencing revealed hypermethylation-resistant CpG sites within ICRs
We also performed NGS-based bisulfite sequencing for a subset of the PCR products to get a more holistic view of DNA methylation changes. PCR products were selected from 7 experimental samples (4 KM and 3 KPM) and one control sample (N). Results from the Peg3-ICR are displayed as a representative set (). Inspection of the sequencing results allowed for the following observations. First, sequencing results were mostly consistent with the results generated by COBRA, confirming that there was a correlation between DNA methylation levels and the degree of tumor progression in the tested samples (). In the hyperplastic sample (#13), the DNA methylation pattern was consistent with the pattern in the control sample (N), where approximately one half of the heat map was red (denoting methylated CpG sites) and the other half was blue (denoting unmethylated CpG sites). This is the typical pattern generated by normal levels of DNA methylation due to ICRs being methylated on one allele and unmethylated on the other. However, the normal pattern was no longer present in neoplastic samples such as # 2, representing the most advanced tumor. This sample was hypermethylated to such an extent that mean methylation was nearly 84%, which rendered the portion of the heat map representing the unmethylated allele virtually non existent ().
Figure 7. Bisulfite NGS reveals not all CpG are equally vulnerable to DNA methylation changes. Heat maps generated by BiQ analyzer HT showing DNA methylation at each CpG (Nos. One–16) within bisulfite PCR products. Results from the Peg3-ICR are shown as a representative set. Each column represents a CpG within the bisulfite PCR product and each row represents a sequencing read. The positions of the restriction sites utilized in COBRA are indicated below the heat map of the control sample (N) with triangles (black for TaqαI and purple for HphI). Mean methylation (%) and number of reads are presented above each map. Below the heat maps is a UCSC genome browser view of putative CSEl containing CpGs # 4–7. Sequences are highlighted based on matching the consensus motif of the SP1 transcription factor. An expansion of CSE1 is proposed based on the most hypermethylation resistant CpG, # 3, being contained in a highly conserved region that matched very well with the SP1 binding motif and was not included in putative CSE1.
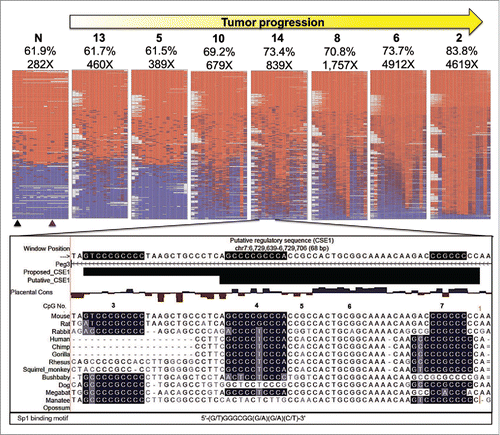
Second, certain CpG sites were resistant to DNA methylation change. Within the amplicon for the Peg3-ICR, this trend was evident by a subset of CpG sites maintaining the normal half red and half blue pattern even though other CpG sites were methylated in 90% or more of sequencing reads. The CpG sites particularly maintaining the normal pattern were # 3, 4, 7, 12, and 13 (). Inspection of the sequences surrounding these resistant CpGs indicated that these sites are part of potential regulatory sequences. CpG Nos. Three,4 and 7 are part of the GC-box motif, 5′ – GGGCGG – 3′, and CpGs # 12 and 13 are part of the palindrome, 5′ – CGATCG – 3′. Two of the CpGs # 4 and 7 are within a putative conserved sequence element (CSE1) that is known to attract an unknown repressive protein complex to the Peg3-ICR.Citation26,27 Interestingly, another conserved GC-box motif happens to be localized just outside CSE1, yet this is the motif housing the most resistant CpG site # 3 based on its methylation status most evident in the heat map for sample # 2 (). Overall, this series of analyses demonstrated that DNA methylation changes expand during tumor progression and that certain CpG sites might be protected from DNA methylation changes potentially due to the binding of unknown transcription factors.
Discussion
Analyses of many human cancers suggest that the methylation status of genomic imprinting is challenged during carcinogenesis and that loss of imprinting (LOI) contributes to neoplastic transformations.Citation12 However, the context (i.e., the causative genomic mutation) in which DNA methylation changes occur within imprinted domains can rarely be determined. Furthermore, it may not be possible to determine which mutation, the genomic or the epigenomic, is established first in sporadic human tumors. Further complicating matters, DNA methylation signatures within imprinted domains vary from one tumor type to the next.Citation8 Therefore, it is necessary to survey DNA methylation of imprinted domains in various tumor types in which the causative genomic mutation is known. Here, we induced lymphoblastic T-cell thymic lymphoma in mice using the KrasG12D oncogene and systematically surveyed for aberrant DNA methylation within imprinted domains. With this study, we show that DNA methylation in imprinted domains is frequently challenged in T-cells expressing KrasG12D () and that DNA methylation changes do not occur equally within an imprinted domain. Rather, these changes occur most frequently at ICRs (or “control DMRs”) and enhancers () of imprinted domains. Furthermore, we found that certain evolutionarily conserved sequence elements that attract DNA binding proteins are resistant to DNA methylation changes (). Overall, the ICRs of the Peg10, Dlk1/Gtl2, and Peg3 domains experienced the most notable DNA methylation changes in T-cell lymphoma ().
Aberrant DNA methylation within the Peg10 and Dlk1/Gtl2 domains has also been reported in human B-cell leukemias and malignancies.Citation8 The consistency of these 2 domains experiencing changes in both B-cell and T-cell neoplasms has several implications. First, detecting DNA methylation changes cannot be used to determine the cell type responsible for lymphocytic tumors. However, detection of aberrant DNA methylation within imprinted domains may provide insight into the severity of a disease. For instance, while the only detectable changes in hyperplastic tumors occurred in the Peg10 and Dlk1/Gtl2 domains, changes were frequently detected within several other domains such as Peg3 in neoplastic tumors (). Thus, detection of aberrant DNA methylation in imprinted domains other than Peg10 and Dlk1/Gtl2 suggests lymphocytes have already undergone neoplastic transformation. Second, because the Peg10 and Dlk1/Gtl2 domains experience detectable changes in hyperplastic tumors, changes in these domains may contribute to neoplastic transformation. If this does prove to be the case, then specific therapeutic modalities may be designed to restore normal DNA methylation settings within these domains. Lastly, neither the causative genomic mutation nor the specific cell type may be directly responsible for changes in DNA methylation. Rather, distinct DNA methylation signatures are likely established based on whether or not the epimutation provides a selective advantage for a given tumor cell.
ICRs contain a variety of DNA sequence elements that have been linked to hyper- and hypo-methylation trends, which are notorious for increasing cancer heterogeneity.Citation28,29 These sequence elements include tandem repeats, CpG islands, and ncRNA promoters, all of which often co-exist within an ICR.Citation1 For instance, while CpG islands tend to attract hypermethylation, tandem repeat sequences frequently become hypomethylated.Citation28 Thus, any given ICR has the potential to either gain or lose methylation. This phenomenon is showcased quite nicely by our analysis of the Peg10-ICR. The Peg10-ICR was hypomethylated in 7 samples and hypermethylated in 2 samples among the 9 T-cell neoplasms that displayed DNA methylation changes within this region. PEG10 has been derived from retrotransposons, which may account for the frequent hypomethylation. At the same time, the ICR of the Peg10 domain contains a CpG island, which may account for the hypermethylation. Therefore, the unusual clustering of various sequence elements within ICRs may be what first attracts DNA methylation changes. Most often, the changes that occur at ICRs will not contribute to disease progression. However, when certain epimutations at ICRs do contribute to the carcinogenesis of a particular tumor cell type, they can be selected for and propagated by rapidly dividing tumor cells until the epimutation is fixed in what now can be considered an evolved population of tumor cells.
DNA methylation changes are primarily restricted to ICRs within an imprinted domain. Invasive breast cancer frequently displays aberrant DNA methylation within several imprinted domains and loss of imprinting does not necessarily accompany DNA methylation changes.Citation30 However, it is still unclear whether the observed methylation changes could be the result of shifting DNA methylation boundaries or specific DNA methylation changes contained within imprinted domains.Citation30 According to the results of our analyses of the Dlk1/Gtl2 and Gnas domains, the ICRs of these domains frequently experienced aberrant DNA methylation, but regions outside of the ICRs (i.e., nearby DMRs and promoter regions) were not affected (). Therefore, we believe that DNA methylation changes are not the result of shifting DNA methylation pattern. Rather, aberrant DNA methylation is confined to certain regions of imprinted domains, particularly ICRs.
ICRs are unusually sensitive to DNA methylation changes during carcinogenesis, but there may be other regions of the genome that are just as sensitive. While surveying the Peg3 domain, we observed that an evolutionarily conserved region (ECR18), a putative enhancer for the Peg3 domain, was hypermethylated at a similar frequency even though it is 200 kb upstream from the Peg3-ICR (). Although this observation implies that enhancer regions may also be unusually sensitive to DNA methylation changes during carcinogenesis, further investigations into several other enhancer regions are needed to confirm this preliminary observation. However, this observation is consistent with recent reports that demonstrated DNA methylation of transcriptional enhancers is associated with cancer predisposition.Citation31 It will certainly be interesting to further investigate how changes in DNA methylation at enhancer regions can impact nearby gene expression profiles within tumor cells and how such changes contribute to carcinogenesis. If enhancer regions do prove to be particularly vulnerable to DNA methylation changes in tumor cells, they could make excellent biomarkers given their ubiquitous distribution in the genome.
Bisulfite sequencing analyses revealed that DNA methylation changes are not only variable among ICRs, but also variable within a single ICR. For instance, while the sequencing results were consistent with the COBRA results, they also revealed an unexpected pattern in tumor cells. Certain CpG sites remained unaffected even though neighboring CpG sites experienced extensive hypermethylation. Upon close inspection of the immediate sequences surrounding the resistant CpG sites, we noticed that these sites are within the GC-box motif, 5′ - GGGCGG - 3′ (). There are 2 possibilities that may be responsible for this trend. First, certain CpG sites remain unaffected due to the binding of unknown transcription factors, which may have a role in genomic imprinting or transcription of imprinted genes within the region. Second, the unaffected CpGs may simply be within DNA segments that are less accessible to the DNA methyltransferase machinery due to nucleosome occupancy. Since the only observed resistant sites were part of well-known consensus sequences, we favor the first scenario that these CpG are shielded from DNA methylation because of being bound by proteins. However, we plan to further investigate this hypothesis in the near future.
Previously, we have identified a conserved sequence element (CSE1) within the Peg3 domain. According to the results, an unknown protein complex binds to CSE1, and this complex is predicted to be a strong repressor for the expression of Peg3.Citation26,27 Upon close inspection of the CpG sites (Nos. Four–7) of the Peg3-ICR amplicon, which are localized within putative CSE1, we realized CpGs sites Nos. Four and 7 are part of a well-known motif, the GC-box. Oddly, there was a CpG site (# 3) immediately outside the 42-bp putative CSE1 sequence that is also part of a GC-box motif. Interestingly, this CpG site was most resistant to DNA methylation and is highly conserved among placental mammals (). Furthermore, when we included the slightly degenerate sequences surrounding the core sequence of the GC box, we noticed a surprising trend: these evolutionarily conserved sequences fit very well with the consensus sequence, 5′ - (G/T)GGGCGG(G/A)(G/A)(C/T) - 3′, known to be bound by the SP1 transcription factorCitation32 (). The CpG sites within this consensus sequence resisting DNA methylation change is consistent with a previous study which reported that the SP1 protein protects CpG islands from de novo DNA methylation.Citation33 Although this observation suggests SP1 as a possible candidate protein binding to this region, further testing is required to support the hypothesis that SP1 binds to CSE1 and subsequently regulates Peg3 expression. Nonetheless, the current results suggest that the previously defined region of CSE1 may need expansion to include the outlying GC-box as a conserved cis-regulatory module ().
To our knowledge, this is the first study to challenge murine cells with a potent oncogenic mutation and then systematically survey imprinted domains for aberrant DNA methylation. The results from the DNA methylation analyses of this study demonstrate that the DNA methylation status of ICRs is unstable and that aberrant DNA methylation accumulates among several ICRs during carcinogenesis of lymphoblastic T-cell thymic lymphoma. Whether the observed DNA methylation changes within ICRs directly contribute to the development of a tumor cell population or are merely the result of the accumulation of changes over time in the tumor cell methylome is still unknown and requires further investigation. However, considering that the function of many imprinted gene products is frequently associated with physiological cellular processes such cell growth and death and how sensitive imprinted genes dosage is to these physiological processes, it is likely that changes within ICRs for a subset of imprinted genes such as Peg10, Dlk1, Gnas, and Peg3 could alter gene expression and tip the scales such that a tumor cell population could gain a competitive edge and proliferate with fewer checks and boundaries.
Materials and Methods
Mouse strains. Three mouse stains were maintained for the duration of the experiment. Two publically available mouse strains, B6.129-Krastm4Tyj/Nci (LSL-KrasG12D) and STOCK Tg(MMTV-Cre)4Mam/J (MMTV-Cre), were purchased from Jackson Laboratories.Citation13,14,Citation15 The third strain, Peg3floxed, was generated in the lab.Citation16,17 The order of breeding was carried out as follows: first, the Peg3floxed allele was bred with the LSL-KrasG12D model to generate double heterozygous mice. Next, male double heterozygous mice for Peg3floxed and LSL-KrasG12D were bred with female homozygous MMTV-Cre mice. This breeding scheme yielded progeny with 4 different genotypes: KPM, KM, PM, and M (). All experiments were performed in accordance with National Institutes of Health guidelines for care and use of animals, and also approved by the Louisiana State University Institutional Animal Care and Use Committee (IACUC), protocol #13–061.
Genotyping. All litters were weaned 21 d post partum and littermates were separated by gender based on comparing the relative distance of the genitalia from the perianal membrane. No more than 5 littermates were housed in a single cage. Littermates were identified through varying positions of a hole punch on the left ear. Genomic DNA from a right ear clip was used for PCR genotyping. Ear clips were lysed overnight at 60°C in a solution with tail lysis buffer (100 mM Tris-HCl pH 8.1, 5 mM EDTA, 200 mM NaCl, 0.2% SDS) supplemented with Proteinase K (NEB, Cat. # P8107S). Lysates were diluted at 1:60 with nanopure water. Two microliter of diluted lysate was directly added to Maxime PCR Premix tubes (intron, Cat. # 25167) followed by 1 μl of primer at the concentration of 10 pM and nanopure water to bring the reaction to 20 μl. The following specific primer sets were used for each of the following mouse strains: Peg3FlpKo/Del6: Peg3 5arm 5′ – CCCTCAGCAGAGCTGTTTC-CTGCC - 3′ and Peg3 LoxR 5′ – TGAACTGATGGCGAGCTCAGACC – 3′ and Peg3 rev 5′ –ACCCCATTCTCATCAGCTCCAGAG – 3′; MMTV-Cre: MMTV-Cre F 5′ –CTGATCTGAGCTCTGAGTG – 3′ and MMTV-Cre R 5′ –CATCACTCGTTGCATCGACC – 3′; LSL-KrasG12D: Kras F1 5′ – GTCTTTCCCCAGCACAGTGC – 3′ and Kras Fcass 5′ –AGCTAGCCACCATGGCTTGAGTAAGTCTGCA - 3′; L-KrasG12D: Kras F1 5′ –GTCTTTCC-CCAGCACAGTGC – 3′ and Kras R1 5′ - CTCTTGCCT-ACGCCAC CAGCTC – 3′. Genotyping PCR conditions for 33 cycles were as follows: denaturation at 95°C for 30 seconds, annealing at 60°C for 30 seconds, and extension at 72°C for 1 minute.
Histology and Immunohistochemistry. Mice were sacrificed by CO2 asphyxiation in accordance with the rules and regulations set forth by the IACUC either when showing signs of distress or when reaching 15% weight loss (weight measurements were taken every 3 d for mice expressing the KrasG12D mutation). A full necropsy was performed on all mice. Tissues were fixed in 10% neutral buffered formalin (Thermo Scientific, Cat. # 5725) for at least 48 hours, and then transferred to 70% ethanol for storage. Tissues were trimmed and embedded in paraffin, sectioned, and stained with hematoxylin and eosin (H&E). Sections were evaluated by a board-certified veterinary pathologist (IML). Samples of oral, anal and foot pad masses and any other tissue that appeared grossly abnormal were also placed in lysis buffer containing Proteinase K for subsequent DNA extraction and analyses. The standard method was used for immunohistochemistry. Briefly, paraffin blocks were sectioned at 5 μm and deparaffinized (3 xylene changes, 5 min each; 3 washes with 100% ethanol, 4 min each; one wash with 95% EtOH, 4 min; one dH2O rinse; and one buffer rinse). Slides were soaked in 3% H2O2/dH2O for 10 min to quench endogenous peroxidase activity, and were incubated with normal goat blocking serum for 30 min. Antigen-retrieval was performed with a Biocare Decloaker for 20 min in DAKO citrate buffer pH 6. Primary antibodies were diluted with the DAKO antibody diluent, and were applied at room temperature for 30 minutes for anti-CD3 (Santa Cruz Biotechnology, Cat. # sc-1127), anti-PAX5 (Santa Cruz Biotechnology, Cat. # sc-1974) and anti-Peg3,Citation17 and one hour for anti-YY1 (Santa Cruz Biotechnology, Cat. # sc-7341). The following primary antibody dilutions were used: anti-CD3 (1:350), anti-PAX5 (1:300), anti-Peg3 (1:50), and anti-YY1 (1:100). Biotinylated anti-goat in rabbit and biotinylated anti-rabbit in goat secondary antibodies were diluted with the DAKO antibody diluent and applied to the slides. Slides were counterstained with Hematoxylin. Staining was performed on a DAKO Autostainer Link 48.
DNA methylation analyses: COmbined Bisulfite Restriction Analysis (COBRA) and Next Generation Sequencing (NGS). Genomic DNA was purified from mediastinal tissue samples by spin column recovery (Genomic DNA clean and concentrator-25, Zymo Research, Cat. # D4065). Purified genomic DNA (500 ng) from each mediastinal lesion was bisulfite-converted using a commercial kit (EZ DNA methylation kit, Zymo Research, Cat. # D5002). The converted DNA was used for PCR amplification. The detailed information regarding the sequences and genomic position for each oligonucleotide set has been presented as Table S1. The amplified PCR products from bisulfite-converted DNA were digested with restriction enzymes, separated on a 2% agarose gel, and the relative amount of each digested DNA fragment was measured based on its band density as described below. QuantityOne software was used to export gel electrophoresis images as lossless tiff files (Gel Doc system, BioRad). Tiff files were then processed as 8-bit grayscale using ImageJ softwareCitation34 in the following manner: 1) data was inverted; 2) background was subtracted using default setting; 3) brightness/contrast was adjusted by selecting the auto adjust command one time; 4) bands in each lane were selected individually using the rectangular tool; 5) density plots were then generated for each rectangular selection; 6) each density peak was gated at the base of the peak at a location higher then background signals using the line drawing tool; and 7) the area under each peak was automatically generated by the software using the wand tool. Area results were exported into an Excel spreadsheet where all subsequent analyses were performed. DNA Methylation values (%) were calculated using the following formula: 100*[(area of peak from digested DNA/s)/(area of peak from digested band/s + area of peak from undigested DNA)]. ANOVA (single factor) statistical analysis was performed on the percent methylation results for each locus screened. If the P value from the ANOVA analysis was less than or equal to 0.05, then subsequent pair wise t-test (2 sample assuming equal variance) was performed comparing each tumor sample to normal tissue for each locus. Three independent trials starting from bisulfite conversion to restriction digestion were repeated to derive the average DNA methylation levels of each locus within 95% confidence intervals.
Sequencing of the individual bisulfite PCR products was performed using a NGS platform (PGM2, Ion Torrent, Life Technologies). Briefly, bisulfite PCR products for each locus from each trial were pooled for 7 representative thymic lesions, and for one control thymus. End repair was performed using a commercially available module (NEBNext End Repair Module, Cat. # E6050S). End-repaired bisulfite PCR products were then visualized by electrophoresis, size-selected, and extracted using a commercially available kit (Gel DNA recovery kit, Zymo Research, Cat. # D4001). Barcoded adapters were ligated to each thymic lesion's pooled bisulfite PCR products by the activity of 2 enzymes in concert (Bst 2.0 WarmStart, NEB, Cat. # M0538S and T4 DNA ligase, NEB, M0202S). The adapter ligation reactions were visualized with gel electrophoresis, and the products were extracted using the Zymo kit referenced above. PCR with primers specific for the adapters was used to enrich for the PCR products that had the proper adapter orientation. The enriched PCR products were then submitted to the genomics core facility at Louisiana State University (LSU) for sequencing. The raw sequence reads were processed in the following manner. Briefly, Sequence reads smaller than 100 bp in length were discarded. The remaining sequences were first sorted by bar code for each thymic lesion, and then sorted by the primer sequences specific for each PCR product such that forward and reverse reads were sorted into the same directory. The BiQ Analyzer HT tool was used to further process the sorted sequences such that reads with greater than or equal to 80% bisulfite conversion and 50% sequence identity were analyzed to calculate DNA methylation levels for each locus.Citation35 The bioinformatics pipeline used for this process is available upon request.
Survival analyses and organ weight profiles. For each animal, date of birth and date of necropsy were recorded and compared by Kaplan Meyer survival analyses of the 4 cohorts using GraphPad Prism Version 4.0 software. However, for ease of formatting, Microsoft Excel was used to generate the survival curve graph. Upon necropsy, each animal's body, liver, spleen and right kidney weights were measured using a thermo scientific digital scale with 0.001 g accuracy. Data was imported into Microsoft Excel and was processed in the following manner. Each organ's percent of body weight was calculated mean % weight = 100*(weight of organ/total body weight). For each cohort, mean percent weight of kidney, spleen and liver was calculated and plotted with 95% confidence intervals. ANOVA (single factor) was used to compare the percent weights of each organ type among the 4 cohorts. If the P-value from the ANOVA analysis was less than or equal to 0.05, then subsequent pairwise t-tests (2 sample assuming equal variance) were performed to compare each cohort to one another for each organ type.
Disclosure of Potential Conflicts of Interest
No potential conflicts of interest were disclosed.
Ethics Statement
All the experiments related to mice were performed in accordance with National Institutes of Health guidelines for care and use of animals, and also approved by the Louisiana State University Institutional Animal Care and Use Committee (IACUC), protocol #13–061.
Author Contributions
CLB designed and executed the breeding experiments for the study, conducted all necropsies, performed all molecular and statistical analyses, and wrote the paper. IML performed the histopathological analyses and contributed to writing the paper. SL performed COBRA of the TSGs and designed the protocol for NGS-based bisulfite sequencing. JK provided the original concept of the study, supervised the study, and contributed to writing the paper. All authors read and approved the final manuscript.
Supplementary Material
Supplemental data for this article can be accessed on the publisher's website.
Supplemental.zip
Download Zip (17.5 MB)Acknowledgments
We would like to thank the members of the histology core facility at the Louisiana Animal Disease Diagnostic Laboratory (LADDL) for their help with processing and embedding the tissues, and in particular Del Phillips for her help with immunohistochemistry; Scott Herke at the LSU genomics core facility for his help with sequencing; and members of Joomyeong Kim Lab, Hana Kim and Arundhati Bakshi, for their thoughtful feedback and discussion on the manuscript.
Related Research Data
References
- Bartolomei MS, Ferguson-Smith AC. Mammalian genomic imprinting. Cold Spring Harb Perspect Biol 2011; 3:pii:a002592; PMID:21576252; http://dx.doi.org/10.1101/cshperspect.a002592
- Barlow DP, Bartolomei MS. Genomic imprinting in mammals. Cold Spring Harb Perspect Biol 2014; 6:pii:a018382; PMID:24492710; http://dx.doi.org/10.1101/cshperspect.a018382
- Relaix F, Wei XJ, Li W, Pan J, Lin Y, Bowtell DD, Sassoon DA, Wu X. Pw1/Peg3 is a potential cell death mediator and cooperates with Siah1a in p53-mediated apoptosis. Proc Natl Acad Sci USA 2000; 97(5):2105-10; PMID:10681424; http://dx.doi.org/10.1073/pnas.040378897
- Reik W, Davies K, Dean W, Kelsey G, Constância M. Imprinted genes and the coordination of fetal and postnatal growth in mammals. Novartis Found Symp 2001; 237:19-31; discussion 31-42; http://dx.doi.org/10.1002/0470846666.ch3
- Rezvani G, Lui JC, Barnes KM, Baron J. A set of imprinted genes required for normal body growth also promotes growth of rhabdomyosarcoma cells. Pediatr Res 2012; 71(1):32-8; PMID:22289848; http://dx.doi.org/10.1038/pr.2011.6
- Lim DH, Maher ER. Genomic imprinting syndromes and cancer. Adv Genet 2010; 70:145-75; PMID:20920748; http://dx.doi.org/10.1016/B978-0-12-380866-0.60006-X
- Uribe-Lewis S, Woodfine K, Stojic L, Murrell A. Molecular mechanisms of genomic imprinting and clinical implications for cancer. Expert Rev Mol Med 2011; 13:e2; PMID:21262060; http://dx.doi.org/10.1017/S1462399410001717
- Monk D. Deciphering the cancer imprintome. Brief Funct Genomics 2010; 9(4):329-39; PMID:20551091; http://dx.doi.org/10.1093/bfgp/elq013
- Bartolomei MS. Genomic imprinting: employing and avoiding epigenetic processes. Genes Dev 2009; 23(18):2124-33; PMID:19759261; http://dx.doi.org/10.1101/gad.1841409
- Spahn L, Barlow DP. An ICE pattern crystallizes. Nat Genet; 2003 35:11-2; PMID:12947402; http://dx.doi.org/10.1038/ng0903-11
- Plass C, Soloway PD. DNA methylation, imprinting and cancer. Eur J Hum Genet 2002; 10(1):6-16; PMID:11896451; http://dx.doi.org/10.1038/sj.ejhg.5200768
- Jelinic P, Shaw P. Loss of imprinting and cancer. J Pathol 2007; 211(3):261-8; PMID:17177177; http://dx.doi.org/10.1002/path.2116
- Jackson EL, Willis N, Mercer K, Bronson RT, Crowley D, Montoya R, Jacks T, Tuveson DA. Analysis of lung tumor initiation and progression using conditional expression of oncogenic K-ras. Genes Dev 2001; 15:3243-8; PMID:11751630; http://dx.doi.org/10.1101/gad.943001
- Johnson L, Mercer K, Greenbaum D, Bronson RT, Crowley D, Tuveson DA, Jacks T. Somatic activation of the K-ras oncogene causes early onset lung cancer in mice. Nature 2001; 410:1111-6; PMID:11323676; http://dx.doi.org/10.1038/35074129
- Kim J, Frey WD, He H, Kim H, Ekram MB, Bakshi A, Faisal M, Perera BP, Ye A, Teruyama R. Peg3 mutational effects on reproduction and placenta-specific gene families. PLoS One 2013; 8(12):e83359; PMID:24391757; http://dx.doi.org/10.1371/journal.pone.0083359
- Perera BP, Teruyama R, Kim J. Yy1 gene dosage effect and bi-allelic expression of Peg3. PloS one 2015; 10(3):e0119493; PMID:25774914; http://dx.doi.org/10.1371/journal.pone.0119493
- Wagner K, Wall RJ, St-Onge L, Gruss P, Wynshaw-Boris A, Garrett L, Li M, Furth PA, Hennighausen L. Cre-mediated gene deletion in the mammary gland. Nuc Acids Res 1997; 25: 4323-30; PMID:9336464; http://dx.doi.org/10.1093/nar/25.21.4323
- Wagner KU, McAllister K, Ward T, Davis B, Wiseman R, Hennighausen L. Spatial and temporal expression of the Cre gene under the control of the MMTV-LTR in different lines of transgenic mice. Transgenic Res 2001; 10(6):545-53; PMID:11817542; http://dx.doi.org/10.1023/A:1013063514007
- Chan IT, Kutok JL, Williams IR, Cohen S, Kelly L, Shigematsu H, Johnson L, Akashi K, Tuveson DA, Jacks T, et al. Conditional expression of oncogenic K-ras from its endogenous promoter induces a myeloproliferative disease. J Clin Invest 2004; 113:528-38; PMID:14966562; http://dx.doi.org/10.1172/JCI20476
- Kong G, Du J, Liu Y, Meline B, Chang YI, Ranheim EA, Wang J, Zhang J. Notch1 gene mutations target KRAS G12D-expressing CD8+ cells and contribute to their leukemogenic transformation. J Biol Chem; 2013 288(25):18219-27; PMID:23673656; http://dx.doi.org/10.1074/jbc.M113.475376
- Pearse G. Histopathology of the thymus. Toxicol Pathol 2006; 34(5):515-47; PMID:17067942; http://dx.doi.org/10.1080/01926230600978458
- Ward JM. Lymphomas and leukemias in mice. Exp Toxicol Pathol 2006; 57(5-6):377-81; PMID:16713211; http://dx.doi.org/10.1016/j.etp.2006.01.007
- Xiong Z, Laird PW. COBRA: a sensitive and quantitative DNA methylation assay. Nucleic Acids Res 1997; 25:2532-4; http://dx.doi.org/10.1093/nar/25.12.2532
- Aran D, Sabato S, Hellman A. DNA methylation of distal regulatory sites characterizes dysregulation of cancer genes. Genome Biol 2013; 14(3):R21; PMID:23497655; http://dx.doi.org/10.1186/gb-2013-14-3-r21
- Thiaville MM, Kim H, Frey WD, Kim J. Identification of an evolutionarily conserved cis-regulatory element controlling the Peg3 imprinted domain. PLoS One 2013; 8:e75417; PMID:24040411; http://dx.doi.org/10.1371/journal.pone.0075417
- Kim J, Kollhoff A, Bergmann A, Stubbs L. Methylation-sensitive binding of transcription factor YY1 to an insulator sequence within the paternally expressed imprinted gene, Peg3. Hum Mol Genet 2003; 12(3):233-45; PMID:12554678; http://dx.doi.org/10.1093/hmg/ddg028
- Kim JD, Yu S, Choo JH, Kim J. Two evolutionarily conserved sequence elements for Peg3/usp29 transcription. BMC Mol Biol 2008; 10; 9:108; http://dx.doi.org/10.1186/1471-2199-9-108
- Ehrlich M. DNA methylation in cancer: too much, but also too little. Oncogene 2002; 21(35):5400-13; PMID:12154403; http://dx.doi.org/10.1038/sj.onc.1205651
- Sharma S, Kelly TK, Jones PA. Epigenetics in cancer. Carcinogenesis 2010; 31(1):27-36; PMID:19752007; http://dx.doi.org/10.1093/carcin/bgp220
- Barrow TM, Barault L, Ellsworth RE, Harris HR, Binder AM, Valente AL, Shriver CD, Michels KB. Aberrant methylation of imprinted genes is associated with negative hormone receptor status in invasive breast cancer. Int J Cancer 2015; 137(3):537-47; PMID:25560175; http://dx.doi.org/10.1002/ijc.29419
- Aran D, Hellman A. DNA methylation of transcriptional enhancers and cancer predisposition. Cell 2013; 154(1):11-3; PMID:23827668; http://dx.doi.org/10.1016/j.cell.2013.06.018
- Nagaoka M, Shiraishi Y, Sugiura Y. Selected base sequence outside the target binding site of zinc finger protein Sp1. Nucleic Acids Res 2001 29(24):4920-9; PMID:11812820; http://dx.doi.org/10.1093/nar/29.24.4920
- Brandeis M, Frank D, Keshet I, Siegfried Z, Mendelsohn M, Nemes A, Temper V, Razin A, Cedar H. Sp1 elements protect a CpG island from de novo methylation. Nature 1994; 371(6496):435-8; PMID:8090226; http://dx.doi.org/10.1038/371435a0
- Schneider CA, Rasband WS, Eliceiri KW. NIH Image to ImageJ: 25 years of image analysis. Nat Methods 2012; 9(7):671-675; PMID:22930834; http://dx.doi.org/10.1038/nmeth.2089
- Lutsik P, Feuerbach L, Arand J, Lengauer T, Walter J, Bock C. BiQ Analyzer HT: locus-specific analysis of DNA methylation by high-throughput bisulfite sequencing. Nuc Acids Res 2011; 39:W551-6;PMID:21565797; http://dx.doi.org/10.1093/nar/gkr312.