
ABSTRACT
High-grade non-muscle invasive bladder cancer (HG-NMIBC) is a clinically unpredictable disease with greater risks of recurrence and progression relative to their low-intermediate-grade counterparts. The molecular events, including those affecting the epigenome, that characterize this disease entity in the context of tumor development, recurrence, and progression, are incompletely understood. We therefore interrogated genome-wide DNA methylation using HumanMethylation450 BeadChip arrays in 21 primary HG-NMIBC tumors relative to normal bladder controls. Using strict inclusion-exclusion criteria we identified 1,057 hypermethylated CpGs within gene promoter-associated CpG islands, representing 256 genes. We validated the array data by bisulphite pyrosequencing and examined 25 array-identified candidate genes in an independent cohort of 30 HG-NMIBC and 18 low-intermediate-grade NMIBC. These analyses revealed significantly higher methylation frequencies in high-grade tumors relative to low-intermediate-grade tumors for the ATP5G2, IRX1 and VAX2 genes (P<0.05), and similarly significant increases in mean levels of methylation in high-grade tumors for the ATP5G2, VAX2, INSRR, PRDM14, VSX1, TFAP2b, PRRX1, and HIST1H4F genes (P<0.05). Although inappropriate promoter methylation was not invariantly associated with reduced transcript expression, a significant association was apparent for the ARHGEF4, PON3, STAT5a, and VAX2 gene transcripts (P<0.05). Herein, we present the first genome-wide DNA methylation analysis in a unique HG-NMIBC cohort, showing extensive and discrete methylation changes relative to normal bladder and low-intermediate-grade tumors. The genes we identified hold significant potential as targets for novel therapeutic intervention either alone, or in combination, with more conventional therapeutic options in the treatment of this clinically unpredictable disease.
Introduction
Bladder cancer is the ninth most common cancer worldwide.Citation1 The majority of bladder cancers are transitional cell carcinomas (TCC), of which 70–80% are non-muscle invasive (NMIBC) at presentation.Citation2 Poorly differentiated ‘high-grade’ (HG)-NMIBC is a clinically important sub-type, accounting for approximately 10–15% of all NMIBCs at presentation.Citation3,4 These high-grade tumors are typically more aggressive than their low- and intermediate-grade counterparts, manifest by higher rates of recurrence and progression to invasive and metastatic disease despite intensive and prolonged intravesical treatment.Citation5,6
The majority of NMIBCs are thought to be consequent to, and represent initiation and progression from, a complex interplay between sporadic, environmental, and heritable risk factors, including those that impact upon genetic and epigenetic pathways. NMIBCs and muscle invasive bladder cancers (MIBCs) have been shown to develop independently (‘the two pathway model’) on the basis of gain of function fibroblast growth factor receptor 3 (FGFR3) mutations in NMIBC, and loss of function mutations in retinoblastoma 1 (RB1) and tumor protein 53 (p53) in MIBC,Citation7-10 and have been shown to evolve from different cell types.Citation11,12 However, the molecular pathways responsible for the evolution, outgrowth and progression of HG-NMIBC have not been subject to comprehensive study or investigation; indeed, it is currently unclear whether HG-NMIBCs arise as a discrete disease entity, whether they represent step-wise progression from low-intermediate-grade NMIBC tumors, or whether they sit at a molecular crossroads between NMIBC and MIBC.Citation7,11,13 This uncertainty is illustrated by the findings that high-grade tumors harbor abnormalities in common with low-intermediate-grade NMIBC, such as mutations of FGFR3 and/or rat sarcoma viral oncogene homolog (RAS) pathway genes,Citation14,15 but also display extensive genetic instability and compromised regulation of vital cellular processes more in keeping with MIBC.Citation14,16
Epigenetic modifications are frequently implicated in the development of human malignancies, and in these cases, are typically apparent as inappropriate gene promoter CpG island DNA methylation, histone tail modification(s), aberrant expression of micro- and long non-coding-RNAs and, less frequently, loss of gene body/intergenic methylation.Citation17,18 These heritable modifications, or epimutations, impact upon gene expression either alone or in combination, and promote tumor evolution and/or progression by suppressing the expression of growth inhibiting and/or apoptosis promoting genes, and less frequently by leading to relaxed control of expression of growth promoting genes.Citation17,19,20
Epigenetic modifications and associated gene silencing have been shown in NMIBC, and specific patterns of DNA methylation, histone modifications and microRNA expression have been reported as associated with tumor growth characteristics, patient/clinical outcomes and with field defect phenomena.Citation21,22 However, the majority of these reports have described epigenetic changes in heterogeneous populations of NMIBC, with an abundance of low- and intermediate-grade tumors relative to high-grade tumors. With the exception of our recent candidate-gene studyCitation23 and a single report investigating the Myopodin A gene,Citation24 HG-NMIBCs have not been considered as a discrete entity for the investigation of epigenetic modifications.
In this study, we interrogated DNA methylation on a genome-wide scale using methylation BeadChip-array technology, in a unique cohort of HG-NMIBCs. Through comparisons with methylation levels and gene-expression in low-intermediate-grade tumors, we extend the current understanding of bladder cancer tumorigenesis and identify potential epigenetic mechanisms implicated in the development of high-grade NMIBC, and those that might represent novel therapeutic drug-targets.
Results
Technical validation of array by pyrosequencing
Subsequent to array processing, normalization, and peak-based correction (see patients and methods), a technical validation was performed by comparing array-derived β-values with pyrosequencing-derived methylation values. Across 120 data-points (5 CpGs, 24 samples) encompassing a broad range of array β-values, a strong positive correlation was found between the methylation values (Spearman's rank correlation r = 0.912, P< 0.00001; Supplemental Figure S1).
In-house filtering criteria
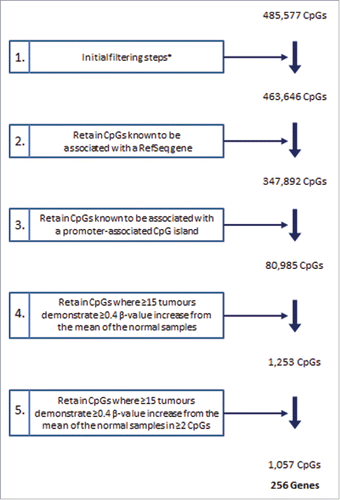
CpGs showing differential methylation in HG-NMIBC relative to normal bladder controls were identified following a series of stringent filtering criteria, as described previously and shown in .Citation25,26 On the basis of these criteria, a total of 1,057 CpGs, representing 256 genes, were identified as hypermethylated (β-value increase ≥0.4) in 15 or more of the 21 high-grade tumors, relative to their mean values in the normal bladder controls.
Figure 1. Array filtering steps. Summary of the steps implemented for the identification of CpGs hypermethylated in HG-NMIBC. The initial filtering steps (*) included exclusion of non-significant probe data, probes with missing data and probes located on allosomes. RefSeq (National Center for Biotechnology Information Reference Sequence Database). CpG island based upon the UCSC genome browser definition from Gardiner-Garden and Frommer.Citation78
Hierarchical clustering analyses
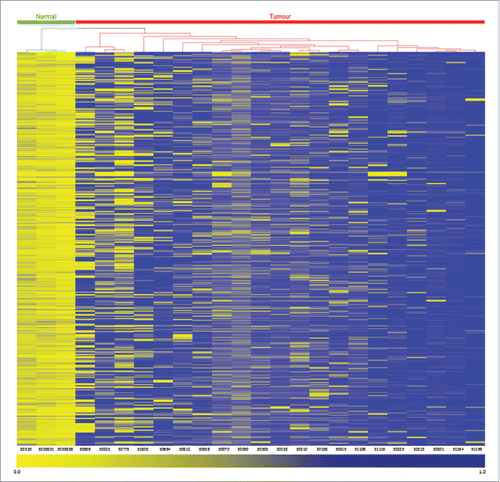
The filtered dataset was next subject to unsupervised hierarchical cluster analysis (): the high-grade tumors cluster independently from the normal bladder control samples. In these cases, methylation is barely detectable within the normal bladder samples, whereas 15 or more of the high-grade tumors show inappropriate methylation across all 1,057 CpG dinucleotides, spanning 256 gene-promoter-associated CpG islands (Supplemental Table S2).
Figure 2. Unsupervised hierarchical clustering analysis of the 1,057 gene promoter-associated hypermethylated CpGs in HG-NMIBC. Heatmap and dendrogram of differentially methylated gene promoter-associated CpG sites identified by array analysis. The dendrogram above the heatmap separates normal bladder (green bar, n = 3) and high-grade-NMIBC bladder tumors (red bar, n = 21). Each row represents an individual CpG locus, and each column represents a normal control or tumor sample (listed beneath the heatmap). The color scale beneath the heatmap represents methylation status: unmethylated is yellow (β-value = 0.0), and fully methylated is blue (β-value = 1.0).
Independent validation by pyrosequencing
We next selected 25 genes for independent validation by pyrosequencing on the basis of their frequent methylation in the discovery cohort that comprised 21 high-grade tumors. These analyses revealed similar frequencies and mean levels of methylation as those apparent from the BeadChip array for 24 of the 25 genes. As further confirmation, we extended the pyrosequencing analyses to an independent investigation cohort of 30 HG-NMIBC tumors. Similar frequencies and mean levels of methylation between the discovery and investigation cohorts reinforced our confidence in the array-derived data (Supplemental Table S3). At this stage, and to assess for potential confounders, we assessed associations between patient demographic data and methylation patterns across these 25 genes, using separate multivariate models. No correlations were identified in these analyses, suggesting demographic factors did not significantly impact upon the methylation patterns identified (data not shown).
Differential subtype-specific promoter methylation in NMIBC
We next determined methylation across the 25 genes described above in HG-NMIBC relative to that apparent in low-intermediate-grade tumors and in comparison to normal bladder controls (Supplemental Table S4). Similar to other groups,Citation27,28 we displayed these methylation data, across the high-grade and low-intermediate-grade tumors and normal controls, by heatmap (). This demonstrated heterogeneous patterns of methylation across the 51 high- and 18 low-intermediate-grade tumors relative to the normal bladder controls. Gene-specific differences in methylation were apparent between the high-grade tumors and their low-intermediate-grade counterparts on visual inspection. Closer examination of these data showed that the differences appeared to impact on either the relative frequency and/or the mean levels of methylation between these tumor subtypes. As examples of these differences, the ten most differentially methylated genes are shown in .
Figure 3. Heatmap for 25 hypermethylated gene promoter-associated CpG islands. Pyrosequencing validation of 25 gene promoter-associated CpG islands, identified as frequently differentially methylated in high-grade tumors by 450 K BeadChip-array analysis. As indicated above the heatmap, the four normal bladder controls are presented to the left-side of the heatmap, followed by 18 low-intermediate-grade tumors, and 51 high-grade tumors (the combined discovery and investigation cohorts). Each row represents the promoter-associated CpG island of the indicated gene, and each color block the mean level of methylation across the island. The color scale beneath the heatmap represents methylation status: unmethylated is green (0.0% methylation), and fully methylated is red (100.0% methylated).
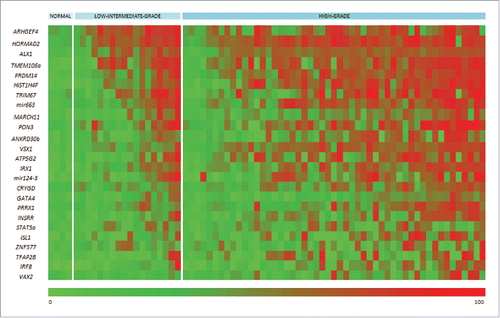
Table 1. Genes showing the greatest methylation increase in high-grade relative to low-intermediate-grade NMIBC tumors. Top ten genes showing an increase in frequency of methylation (left side of table), and/or an increase in mean level of methylation (right side of table) in high-grade tumors relative to low-intermediate-grade tumors. For the left side of the table, the number and proportion of tumors methylated are displayed for the low-intermediate- and high-grade cohorts, with P-value (Fishers exact, P<0.05 significant). For the right side of the table, the mean level of methylation across the low-intermediate- and high-grade tumor cohorts are displayed with P-value (Student's T-Test, P<0.05 significant). Statistically significant P-values are displayed in bold.
Methylation frequencies in high- and low-intermediate-grade tumors
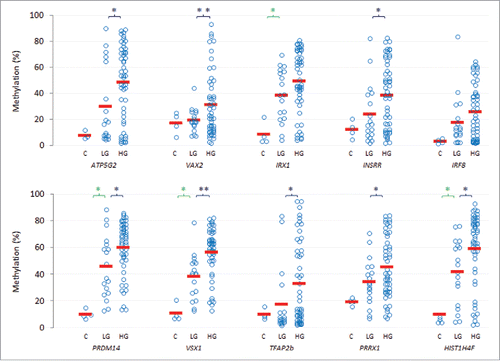
For ten of the genes we took forward for further analyses (ATP5G2, HIST1H4F, INSRR, IRF8, IRX1, PRDM14, PRRX1, TFAP2b, VAX2 and VSX1), there was a higher frequency of methylation in high-grade tumors vs. low-intermediate grade tumors (). Moreover, the increases were statistically significant for the ATP5G2, VAX2 and IRX1 genes (P<0.05), and approached significance for the INSRR, IRF8, PRDM14 and VSX1 genes.
Mean levels of methylation in high- and low-intermediate-grade tumors
The mean levels of methylation in the high-grade tumors were next assessed by pyrosequencing (right-sided panel of, and ); for eight of the ten genes, mean levels of methylation were significantly greater in high-grade tumors relative to their low-intermediate-grade counterparts. In addition, and as low-intermediate-grade tumors were not subject to array analyses relative to normal bladder, further pairwise testing was performed. This analysis identified significant differences between mean levels of methylation in the low-intermediate-grade tumors and normal bladder in four of the ten genes assessed. The range, distribution and mean levels of methylation are shown in , and show for each of the genes, a stepwise trend toward increasing methylation from normal bladder to low-intermediate and high-grade tumors.
Figure 4. Mean levels of methylation in high-grade tumors relative to low-intermediate-grade tumors and normal bladder. Top ten genes showing an increase in mean level of methylation (solid red bar) in high-grade tumors (HG, n = 51) relative to low-intermediate-grade tumors (LG, n = 18) and in comparison to normal bladder controls (C, n = 4). Each individual control or tumor sample is shown as an unfilled blue circle. Significant differences in the mean levels of methylation between the low-intermediate- and high-grade tumors, or between control and low-intermediate-grade tumors, are indicated by *, P<0.05, or **, P<0 .005 (Student's T-test).
Methylation-associated changes in gene expression
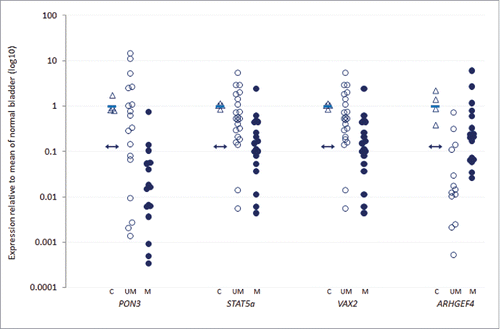
Across the high-grade NMIBC tumors, sufficient sample was available for gene expression analyses for 17 of the 25 genes. With the exception of the ARHGEF4 gene, promoter-associated CpG island methylation was negatively correlated with transcript expression for all genes assessed (data not shown). Furthermore, the presence of promoter methylation was significantly correlated with reduced transcript expression for the PON3, STAT5a and VAX2 genes (Spearman's correlation coefficients −0.60, −0.50 and −0.48 respectively, all P<0.05). Conversely, promoter methylation was significantly positively correlated with gene transcript expression for the ARHGEF4 gene (Spearman's correlation coefficient 0.62, P<0.05). shows the expression levels for these four genes across the high-grade tumors.
Figure 5. Association of methylation with gene transcript expression in HG-NMIBC. Tumor transcript expression in unmethylated (UM, unfilled circles) and methylated (M, filled circles) high-grade tumors, relative to normal bladder control (C, unfilled triangles) for the 4 genes showing significant Spearman's correlation coefficients between promoter methylation and gene expression (PON3, STAT5a, VAX2 and ARHGEF4; P = 0.0006, P = 0.005, P = 0.013 and P = 0.0007, respectively). The double-headed arrow represents the threshold for 3-fold reduced expression relative to the mean of the normal controls (solid blue bar); expression at or below this threshold signifies reduced expression in tumor samples.
Gene Ontology analysis of inappropriately methylated genes
Gene Ontology analyses of the 256 differentially methylated genes identified ‘over-representation’ of multiple categories of biological processes, molecular functions and pathways. In particular, highly significant over-representation was identified for specific biological processes, including regulation of RNA polymerase II activity and DNA transcription, and for pathways involving cell adhesion and PI3K-Akt signaling (Supplemental Table S5).
Discussion
In common with most other tumor types, bladder cancers harbor epigenetic aberrations, which are frequently apparent as inappropriate DNA methylation.Citation8,22,29 However, reports are limited and largely confined to heterogeneous patient cohorts of NMIBC or MIBC;Citation30 despite their clinical importance, high-grade NMIBC tumors are rarely investigated as a discrete entity in the context of disease and/or subtype-specific epigenetic modifications.Citation23 To address this, we performed genome-wide analyses of DNA methylation using BeadChip array technology in high-grade NMIBC, comprising a discrete cohort of tumors recruited at initial presentation. This analysis, the first ‘450 K array’ interrogation in bladder cancer, revealed multiple and novel frequently differentially methylated genes in these tumors relative to normal bladder. Through pyrosequence analysis of sodium bisulphite converted DNA, we extended our analyses to include independent cohorts of high- and low-intermediate-grade tumors. These investigations confirmed the array-derived data for the high-grade tumors, and showed them as harboring significantly increased frequencies and/or mean levels of gene-specific methylation relative to low-intermediate-grade tumors. Moreover, for some of the genes investigated, a significant inverse correlation between promoter methylation and gene expression levels was apparent and suggests their potential as targets for therapeutic intervention.Citation29,31,32
Initially we performed a technical validation of the discovery cohort data by pyrosequence analysis of converted DNA.Citation25,33,34 In common with previous reports and across multiple genes, these analyses confirmed and reinforced the array-derived data.Citation34,35,36 These analyses also showed that for the majority of regions investigated, methylation extended to include contiguous promoter-associated CpG sites. On the basis of previous reports from our own and other groups,Citation37,38 we employed stringent criteria (β-value differences ≥0.4) to identify differentially methylated genes across multiple CpG sites; such criteria are more consistently associated with bona fide changes in methylation, and are more likely to show associations with gene expression.Citation37,39,40,41
The analysis of the discovery cohort of high-grade NMIBC identified 1,057 CpGs, across 256 gene-promoter-associated CpG islands. Cluster analysis and heat map display of these regions revealed extensive and frequent differential methylation in the tumors relative to normal bladder controls. As our study represents the first 450 K analysis of high-grade bladder cancer a direct ‘like-for-like’ comparisons of our findings with those of other groups was not possible; however, the number of differentially methylated sites we identified appeared to be lower than those previously reported in other tumor types.Citation42,43 Potential explanations for these findings are the tumor type per se and/or the stringency of our inclusion-exclusion criteria and definition of differential methylation.Citation44
For the genes identified, we performed gene ontology and KEGG pathway analyses. In these cases, we identified significant over-representation of genes in processes and pathways previously reported by other groups as subject to epigenetically mediated dysregulation in tumor development. For example, these included transcription and cell signaling and adhesion,Citation45-47 suggesting possible similar roles in high-grade bladder tumors, and their validity as targets for further investigation.
We next extended our investigation of multiple novel genes to an independent cohort of high-grade tumors, and a cohort of low-intermediate-grade tumors for comparison. Similar frequencies and mean levels of methylation, as determined by pyrosequence analysis, were apparent within the discovery and investigation cohorts of high-grade tumors, suggesting our approach for the identification of candidates by array analysis was robust. Interestingly, many of the genes identified as novel and differentially methylated were also inappropriately methylated in low-intermediate-grade tumors. However, and despite the absence of genes as being exclusively associated with either high- or low-intermediate-grade tumors, the frequency and mean levels of gene-promoter methylation in the high-grade tumors were significantly higher than in the low-intermediate-grade tumors. Indeed, similar observations with respect to differences in the frequencies of methylation between high- and low-grade bladder tumors were first suggested by Ibragimova et al.Citation47 Similar subtype and/or grade-associated differences have been reported in other tumor types including, pituitary, breast, and colon cancer subtypes.Citation37,48,49 In our analysis of NMIBC it remains unclear whether the increase in frequency and/or mean levels of methylation in the more aggressive tumors represents a more rapid accumulation of epigenetic changes during tumor progression, or reflects distinct epigenetic pathways of tumor development and outgrowth.Citation50,51 Our findings may therefore reflect either of the described scenarios in the more aggressive (high-grade) tumors and suggests that these tumors are either consequent to progression from low-intermediate-grade tumors, or are the progeny of aberrations in distinct epigenetic pathways within these NMIBC subtypes. Moreover, the identification of different patterns of methylation between tumors represents an important area for future investigation. In this case, methylation may hold promise as an ‘at diagnosis’ biomarker of long-term tumor outcome, similar to that described in colorectal, breast and lung cancers.Citation52-54
Although many of the novel genes we identified have not been previously reported in bladder cancer, their inappropriate methylation, accompanied with gene-silencing, has been reported in the context of other tumor types and suggests potential roles as tumor suppressor genes.Citation55,56,57 To determine associations between methylation and gene expression, we confined our studies to genes showing frequent and/or high mean levels of methylation. For the majority of gene-transcripts we investigated, promoter methylation was negatively correlated with reduced transcript expression, although not significantly so (data not shown). However, as described by our own and other groups, this may reflect a passenger-driver phenomenon where, in the ‘passenger’ context, gene expression is not directly influenced by the observed epigenetic modification(s).Citation58,59 However, for four of 17 transcripts we examined, significant correlations between methylation and transcript expression were apparent. In these cases, and for the PON3, STAT5a and VAX2 genes, promoter methylation was significantly associated with reduced gene expression, while the converse was true for the ARHGEF4 gene. Such associations are similar to those described previously in multiple other cancers and in NMIBC.Citation20,21,43 Indeed, for two of these genes, PON3 and STAT5a, previous studies in mice and cell-line models have described potential tumor suppressor roles.Citation60,61 If this is the case, then these genes may represent important targets for further studies of functional the significance of methylation and reduced expression in a bladder tumor context, including in vitro investigations of demethylating agents designed to restore gene expression.
In summary, we have presented the first comprehensive genome-wide DNA methylation analysis of NMIBC in a unique cohort of high-grade tumors. The study has reported an increase in the frequency and/or mean levels of methylation at gene promoter-associated CpG islands in high-grade tumors relative to their low-intermediate-grade tumor counterparts, which in some cases is associated with reduced gene expression. These findings suggest that epigenetic modifications, alone or in combination with other aberrations, are causal in the development and/or progression of this tumor type. Further studies are required to assess the functional significance of epigenetic changes in HG-NMIBC; however, we suggest that the genes identified hold significant potential as targets for novel therapeutic interventions alone, or in combination, with conventional therapeutic options in the treatment of this clinically unpredictable disease.
Patients and methods
Human tissue samples
Primary tumor and normal bladder tissues used were provided by the Bladder Cancer Prognosis Program (BCPP, National Research Ethics Service East Midlands - Derby 06/MRE04/65.),Citation62 the University of Birmingham Human Biomaterials Resource Center (National Research Ethics Service (North West 5): 09/H1010/75), and the University Hospitals of North Midlands NHS Trust (National Research Ethics Service (South Central – Oxford C): 12/SC/0725). All samples were confirmed histologically as normal bladder urothelium (control, n = 4), G3pT1 TCC (high-grade: discovery cohort n = 21, investigation cohort n = 30), and G1/2 pTa/1 TCC (low-intermediate-grade: n = 18). As previously described,Citation23 patients received repeat bladder tumor resection (TURBT), cystectomy and/or intra-vesical therapy as recommended by European Association of Urology guidelines.Citation63 All samples (details are provided in Supplemental Table S1) were stored at −80°C prior to nucleic acid extraction, as described below.
DNA extraction and bisulphite modification
Genomic DNA was extracted from tumor and control tissues using a standard phenol-chloroform procedure,Citation64 then bisulphite-converted using the EZ DNA Methylation Gold kit (Zymo Research) as we have previously described.Citation37 Bisulphite-conversion of DNA was confirmed in all cases by successful PCR using primers specific to bisulphite-converted DNA (primer sequences in Supplemental Table S6). To increase the relative amount and stability of bisulphite-converted DNA, whole-genome amplification (WGA) was performed as previously described.Citation37
Illumina HumanMethylation450 BeadChip array analyses
Bisulphite-converted DNA from 21 bladder tumors and three normal controls was hybridized to Infinium-based HumanMethylation450 (450K) BeadChip arrays (Illumina, San Diego, CA, USA) to quantify DNA methylation at approximately 480,000 CpG positions across the genome, representing more than 21,000 RefSeq genes. In this case, normal bladder was used as control for consistency with previous array analyses,Citation35,47,65 and also to permit comparisons with earlier reports of non-muscle invasive bladder cancer. Arrays were processed according to the manufacturer's instructions (performed by Barts and the London Genome Center, UK), as described by us previously.Citation66
Raw array data were processed using GenomeStudio software and the bioinformatical platform ‘NIMBL’, as we Citation67,68 and othersCitation69 have described. For each probe, the methylation status was reported as a methylation ‘β-value’, where ‘β’ is defined as the ratio of the methylated signal intensity over the summed intensity of the methylated and unmethylated signals + 100.Citation40 β-values range from 0 (unmethylated) to 1 (fully methylated). NIMBL was used to perform ‘peak-based’ correction, to adjust for potential differences in array probe-type sensitivity previously reportedCitation33; all comparative analyses of high-grade tumors to normal bladder controls, were performed on peak-based corrected β-values, as described by us previously.Citation68
Each array passed quality control assessment based upon the performance of internal controls and the distribution of β-values across all array CpGs. As previously described,Citation68 and represented by step 1 of , we excluded all CpGs for which any of the 24 samples displayed: (i) probe detection P-values >0.05 (unreliable probe data), or (ii) missing β-values (preventing analyses of all samples). We also excluded all CpG loci on allosomes (reducing confounding gender-based methylation differences). We used a series of stringent filtering criteria, shown in and described in the Results section, to identify inappropriate methylation, defined as a β-value difference ≥0.4, in tumor samples relative to the mean of the normal bladder controls.
Unsupervised hierarchical clustering using average linkage criteria was performed using Genesis software (v1.7.6).Citation70 Gene Ontology (GO) analyses were performed using http://geneontology.org/ and http://gather.genome.duke.edu/, and Kyoto Encyclopaedia of Genes and Genomes (KEGG) analyses with http://www.genome.jp/kegg/ online platforms, respectively. Bonferroni correctionCitation71 was employed in all GO and KEGG pathway analyses.
Technical validation of methylation Beadchip array data
Five CpG loci encompassing a broad range of β-values derived from 450 K array analyses were assessed by pyrosequencing (described below), using identical samples, to independently validate the array data (β-values vs. methylation %). Correlation between the methods was assessed across a total of 120 CpGs using Spearman's rank correlation, as shown in Supplemental Figure S1. Primer sequences are provided in Supplemental Table S6.
Pyrosequencing™ of sodium bisulphite-converted DNA
Validation of array data (discovery cohort) and further quantitative assessment of methylation in the independent (investigation) tumor cohort were performed by pyrosequencing of sodium bisulfite-converted DNA, as previously described by us,Citation66 using a PyroMark Q24 Pyrosequencer, PyroMark Q24 Software 2.0 and PyroMark Gold Q24 Reagents. Dependent on the specific gene, and the density of CpGs within their promoter-associated CpG island, between five and nine consecutive CpG sites were assessed. Promoter methylation was defined in tumors if the mean level of methylation across the assessed CpG island was greater either than four standard deviations (4SD), or 20% above, the mean of the normal controls.Citation37 The number of tumors methylated for any given gene describes the frequency of methylation, whereas the mean percentage methylation per se of all of the CpGs surveyed within a gene describes the mean level of methylation.
Quantitative RT-PCR
Total RNA was extracted from control and tumor samples using a standard guanidinium thiocyanate-phenol-chloroform protocol.Citation72 cDNA (cDNA) was synthesized as described previously.Citation73 Thermal cycling using SYBR Green was as previously described,Citation74 with target genes normalized to glyceraldehyde-3-phosphate dehydrogenase (GAPDH) as the endogenous control gene (Supplemental Table S6). Relative quantification of transcript expression was performed using the 2−ΔΔCT method,Citation75 as previously described.Citation76 Reduced transcript expression in a tumor was defined where expression was at least 3-fold lower than the mean level of expression observed in control samples; the converse was true for increased transcript expression.Citation37,38,77
Non-array informatics and statistics
STATA (version 8, Stata Corporation, College Station, TX) was used to analyze methylation and gene expression data in tumor and normal cohorts using Fisher's exact tests (frequency of methylation), Student's t-tests (mean level of methylation), and Spearman correlation coefficients (associations between methylation and gene expression). P-values <0.05 were considered statistically significant.
Ethics committee approvals
East Midlands - Derby: 06/MRE04/65.
The University of Birmingham Human Biomaterials Resource Center (National Research Ethics Service (North West 5): 09/H1010/75.
The University Hospitals of North Midlands NHS Trust (National Research Ethics Service (South Central – Oxford C): 12/SC/0725.
Reagents
EZ DNA Methylation Gold kit, Zymo Research, D5005
HumanMethylation450 BeadChip arrays, Illumina, WG-314-1003
PyroMark Gold Q24 Reagents, Qiagen, 970802
SYBR III brilliant green, Agilent, 600882
Disclosure of potential conflicts of interest
No potential conflicts of interest were disclosed.
KEPI_A_1154246_s02.zip
Download Zip (62.1 KB)Acknowledgments
We would like to thank Dr Kim Haworth and Dr Kiren Yacqub-Usman for their support of the laboratory work.
We would like to thank all the West Midlands Consultant Urologists and their units involved with BCPP, as well as the BCPP research nurses and Margaret Grant, Deborah Bird, Jennifer Barnwell, Duncan Nekeman and Eline van Roekel.
References
- Ferlay J, Soerjomataram I, Dikshit R, Eser S, Mathers C, Rebelo M, Parkin DM, Forman D, Bray F. Cancer incidence and mortality worldwide: sources, methods and major patterns in GLOBOCAN 2012. Int J Cancer J Int Du Cancer 2015; 136:E359-86; PMID:26712904; http://dx.doi.org/10.1002/ijc.29210
- Kirkali Z, Chan T, Manoharan M, Algaba F, Busch C, Cheng L, Kiemeney L, Kriegmair M, Montironi R, Murphy WM, et al. Bladder cancer: epidemiology, staging and grading, and diagnosis. Urology 2005; 66:4-34; PMID:16399414; http://dx.doi.org/10.1016/j.urology.2005.07.062
- Sylvester RJ, van der Meijden AP, Oosterlinck W, Witjes JA, Bouffioux C, Denis L, Newling DW, Kurth K. Predicting recurrence and progression in individual patients with stage Ta T1 bladder cancer using EORTC risk tables: a combined analysis of 2596 patients from seven EORTC trials. Eur Urol 2006; 49:466-5; discussion 75–7; PMID:16442208; http://dx.doi.org/10.1016/j.eururo.2005.12.031
- Boustead GB, Fowler S, Swamy R, Kocklebergh R, Hounsome L. Section of Oncology B. Stage, grade and pathological characteristics of bladder cancer in the UK: British Association of Urological Surgeons (BAUS) urological tumour registry. BJU Int 2014; 113:924-30; PMID:24447825; http://dx.doi.org/10.1111/bju.12468
- Cambier S, Sylvester RJ, Collette L, Gontero P, Brausi MA, van Andel G, Kirkels WJ, Silva FC, Oosterlinck W, Prescott S, et al. EORTC Nomograms and Risk Groups for Predicting Recurrence, Progression, and Disease-specific and Overall Survival in Non-Muscle-invasive Stage Ta-T1 Urothelial Bladder Cancer Patients Treated with 1–3 Years of Maintenance Bacillus Calmette-Guerin. Eur Urol 2016; 69(1):60-9; PMID:26210894; http://dx.doi.org/10.1016/j.eururo.2015.06.045
- Vedder MM, Marquez M, de Bekker-Grob EW, Calle ML, Dyrskjot L, Kogevinas M, Segersten U, Malmstrom PU, Algaba F, Beukers W, et al. Risk prediction scores for recurrence and progression of non-muscle invasive bladder cancer: an international validation in primary tumours. PloS One 2014; 9:e96849; PMID:24905984; http://dx.doi.org/10.1371/journal.pone.0096849
- Knowles MA. Molecular pathogenesis of bladder cancer. Int J Clin Oncol 2008; 13:287-97; PMID:18704628; http://dx.doi.org/10.1007/s10147-008-0812-0
- Dudziec E, Goepel JR, Catto JW. Global epigenetic profiling in bladder cancer. Epigenomics 2011; 3:35-45; PMID:22126151; http://dx.doi.org/10.2217/epi.10.71
- Van Batavia J, Yamany T, Molotkov A, Dan H, Mansukhani M, Batourina E, Schneider K, Oyon D, Dunlop M, Wu XR, et al. Bladder cancers arise from distinct urothelial sub-populations. Nat Cell Biol 2014; 16:982-91; PMID:25218638; http://dx.doi.org/10.1038/ncb3038
- Bakkar AA, Wallerand H, Radvanyi F, Lahaye JB, Pissard S, Lecerf L, Kouyoumdjian JC, Abbou CC, Pairon JC, Jaurand MC, et al. FGFR3 and TP53 gene mutations define two distinct pathways in urothelial cell carcinoma of the bladder. Cancer Res 2003; 63:8108-12; PMID:14678961
- Van Batavia J, Yamany T, Molotkov A, Dan H, Mansukhani M, Batourina E, Schneider K, Oyon D, Dunlop M, Wu XR, et al. Bladder cancers arise from distinct urothelial sub-populations. Nat Cell Biol 2014; 16:982-91, 1–5; PMID:25218638; http://dx.doi.org/10.1038/ncb3038
- Bryan RT, Ward DG. Words of wisdom. Bladder cancers arise from distinct urothelial sub-populations. Eur Urol 2015; 67:590-1; PMID:25760413; http://dx.doi.org/10.1016/j.eururo.2014.11.058
- McConkey DJ, Lee S, Choi W, Tran M, Majewski T, Lee S, Siefker-Radtke A, Dinney C, Czerniak B. Molecular genetics of bladder cancer: Emerging mechanisms of tumor initiation and progression. Urologic Oncol 2010; 28:429-40; PMID:20610280; http://dx.doi.org/10.1016/j.urolonc.2010.04.008
- Castillo-Martin M, Domingo-Domenech J, Karni-Schmidt O, Matos T, Cordon-Cardo C. Molecular pathways of urothelial development and bladder tumorigenesis. Urologic Oncol 2010; 28:401-8; PMID:20610278; http://dx.doi.org/10.1016/j.urolonc.2009.04.019
- Knowles MA, Hurst CD. Molecular biology of bladder cancer: new insights into pathogenesis and clinical diversity. Nat Rev Cancer 2015; 15:25-41; PMID:25533674; http://dx.doi.org/10.1038/nrc3817
- Majewski T, Lee S, Jeong J, Yoon DS, Kram A, Kim MS, Tuziak T, Bondaruk J, Lee S, Park WS, et al. Understanding the development of human bladder cancer by using a whole-organ genomic mapping strategy. Lab Invest; J Tech Methods Pathol 2008; 88:694-721; PMID:18458673; http://dx.doi.org/10.1038/labinvest.2008.27
- Sharma S, Kelly TK, Jones PA. Epigenetics in cancer. Carcinogenesis 2010; 31:27-36; PMID:19752007; http://dx.doi.org/10.1093/carcin/bgp220
- Baylin SB, Jones PA. A decade of exploring the cancer epigenome - biological and translational implications. Nat Rev Cancer 2011; 11:726-34; PMID:21941284; http://dx.doi.org/10.1038/nrc3130
- Dawson MA, Kouzarides T. Cancer epigenetics: from mechanism to therapy. Cell 2012; 150:12-27; PMID:22770212; http://dx.doi.org/10.1016/j.cell.2012.06.013
- Kanwal R, Gupta S. Epigenetic modifications in cancer. Clin Genetics 2012; 81:303-11; PMID:22082348; http://dx.doi.org/10.1111/j.1399-0004.2011.01809.x
- Wolff EM, Chihara Y, Pan F, Weisenberger DJ, Siegmund KD, Sugano K, Kawashima K, Laird PW, Jones PA, Liang G. Unique DNA methylation patterns distinguish noninvasive and invasive urothelial cancers and establish an epigenetic field defect in premalignant tissue. Cancer Res 2010; 70:8169-78; PMID:20841482; http://dx.doi.org/10.1158/0008-5472.CAN-10-1335
- Catto JW, Azzouzi AR, Rehman I, Feeley KM, Cross SS, Amira N, Fromont G, Sibony M, Cussenot O, Meuth M, et al. Promoter hypermethylation is associated with tumor location, stage, and subsequent progression in transitional cell carcinoma. J Clin Oncol 2005; 23:2903-10; PMID:15753461; http://dx.doi.org/10.1200/JCO.2005.03.163
- Kitchen MO, Bryan RT, Haworth KE, Emes RD, Luscombe C, Gommersall L, Cheng KK, Zeegers MP, James ND, Devall AJ, et al. Methylation of HOXA9 and ISL1 Predicts Patient Outcome in High-Grade Non-Invasive Bladder Cancer. PloS One 2015; 10:e0137003; PMID:26332997; http://dx.doi.org/10.1371/journal.pone.0137003
- Alvarez-Mugica M, Cebrian V, Fernandez-Gomez JM, Fresno F, Escaf S, Sanchez-Carbayo M. Myopodin methylation is associated with clinical outcome in patients with T1G3 bladder cancer. J Urol 2010; 184:1507-13; PMID:20723929; http://dx.doi.org/10.1016/j.juro.2010.05.085
- Glossop JR, Nixon NB, Emes RD, Haworth KE, Packham JC, Dawes PT, Fryer AA, Mattey DL, Farrell WE. Epigenome-wide profiling identifies significant differences in DNA methylation between matched-pairs of T- and B-lymphocytes from healthy individuals. Epigenetics 2013; 8:1188-97; PMID:24005183; http://dx.doi.org/10.4161/epi.26265
- de Araujo E, Marchi FA, Rodrigues TC, Vieira HC, Kuasne H, Achatz MI, Moredo LF, de Sa BC, Duprat JP, Brentani HP, et al. Genome-wide DNA methylation profile of leukocytes from melanoma patients with and without CDKN2A mutations. Exp Mol Pathol 2014; 97:425-32; PMID:25236571; http://dx.doi.org/10.1016/j.yexmp.2014.09.009
- Stefansson OA, Moran S, Gomez A, Sayols S, Arribas-Jorba C, Sandoval J, Hilmarsdottir H, Olafsdottir E, Tryggvadottir L, Jonasson JG, et al. A DNA methylation-based definition of biologically distinct breast cancer subtypes. Mol Oncol 2015; 9:555-68; PMID:25468711; http://dx.doi.org/10.1016/j.molonc.2014.10.012
- Sanchez-Vega F, Gotea V, Petrykowska HM, Margolin G, Krivak TC, DeLoia JA, Bell DW, Elnitski L. Recurrent patterns of DNA methylation in the ZNF154, CASP8, and VHL promoters across a wide spectrum of human solid epithelial tumors and cancer cell lines. Epigenetics 2013; 8:1355-72; PMID:24149212; http://dx.doi.org/10.4161/epi.26701
- Besaratinia A, Cockburn M, Tommasi S. Alterations of DNA methylome in human bladder cancer. Epigenetics 2013; 8:1013-22; PMID:23975266; http://dx.doi.org/10.4161/epi.25927
- Bryan RT, Kirby R, Mostafid H. Does the nonurologic scientific community understand urothelial bladder cancer? Europ Urol 2014; 66:601-2; PMID:24821580; http://dx.doi.org/10.1016/j.eururo.2014.04.010
- Kelly TK, De Carvalho DD, Jones PA. Epigenetic modifications as therapeutic targets. Nat Biotechnol 2010; 28:1069-78; PMID:20944599; http://dx.doi.org/10.1038/nbt.1678
- Issa JP, Kantarjian HM. Targeting DNA methylation. Clin Cancer Res 2009; 15:3938-46; PMID:19509174; http://dx.doi.org/10.1158/1078-0432.CCR-08-2783
- Dedeurwaerder S, Defrance M, Calonne E, Denis H, Sotiriou C, Fuks F. Evaluation of the Infinium Methylation 450 K technology. Epigenomics 2011; 3:771-84; PMID:22126295; http://dx.doi.org/10.2217/epi.11.105
- Roessler J, Ammerpohl O, Gutwein J, Hasemeier B, Anwar SL, Kreipe H, Lehmann U. Quantitative cross-validation and content analysis of the 450 k DNA methylation array from Illumina, Inc. BMC Res Notes 2012; 5:210; PMID:22546179; http://dx.doi.org/10.1186/1756-0500-5-210
- Reinert T, Modin C, Castano FM, Lamy P, Wojdacz TK, Hansen LL, Wiuf C, Borre M, Dyrskjot L, Orntoft TF. Comprehensive genome methylation analysis in bladder cancer: identification and validation of novel methylated genes and application of these as urinary tumor markers. Clin Cancer Res 2011; 17:5582-92; PMID:21788354; http://dx.doi.org/10.1158/1078-0432.CCR-10-2659
- Bediaga NG, Acha-Sagredo A, Guerra I, Viguri A, Albaina C, Ruiz Diaz I, Rezola R, Alberdi MJ, Dopazo J, Montaner D, et al. DNA methylation epigenotypes in breast cancer molecular subtypes. Breast Cancer Res 2010; 12:R77; PMID:20920229; http://dx.doi.org/10.1186/bcr2721
- Duong CV, Emes RD, Wessely F, Yacqub-Usman K, Clayton RN, Farrell WE. Quantitative, genome-wide analysis of the DNA methylome in sporadic pituitary adenomas. Endocrine-Related Cancer 2012; 19:805-16; PMID:23045325; http://dx.doi.org/10.1530/ERC-12-0251
- Kim YJ, Yoon HY, Kim JS, Kang HW, Min BD, Kim SK, Ha YS, Kim IY, Ryu KH, Lee SC, et al. HOXA9, ISL1 and ALDH1A3 methylation patterns as prognostic markers for nonmuscle invasive bladder cancer: array-based DNA methylation and expression profiling. Int J Cancer J Int Du Cancer 2013; 133:1135-42; PMID:23436614; http://dx.doi.org/10.1002/ijc.28121
- Schubeler D. Function and information content of DNA methylation. Nature 2015; 517:321-6; PMID:25592537; http://dx.doi.org/10.1038/nature14192
- Bibikova M, Barnes B, Tsan C, Ho V, Klotzle B, Le JM, Delano D, Zhang L, Schroth GP, Gunderson KL, et al. High density DNA methylation array with single CpG site resolution. Genomics 2011; 98:288-95; PMID:21839163; http://dx.doi.org/10.1016/j.ygeno.2011.07.007
- Barrera V, Peinado MA. Evaluation of single CpG sites as proxies of CpG island methylation states at the genome scale. Nucleic Acids Res 2012; 40:11490-8; PMID:23066096; http://dx.doi.org/10.1093/nar/gks928
- Naumov VA, Generozov EV, Zaharjevskaya NB, Matushkina DS, Larin AK, Chernyshov SV, Alekseev MV, Shelygin YA, Govorun VM. Genome-scale analysis of DNA methylation in colorectal cancer using Infinium HumanMethylation450 BeadChips. Epigenetics 2013; 8:921-34; PMID:23867710; http://dx.doi.org/10.4161/epi.25577
- Karlsson A, Jonsson M, Lauss M, Brunnstrom H, Jonsson P, Borg A, Jonsson G, Ringner M, Planck M, Staaf J. Genome-wide DNA methylation analysis of lung carcinoma reveals one neuroendocrine and four adenocarcinoma epitypes associated with patient outcome. Clin Cancer Res 2014; 20:6127-40; PMID:25278450; http://dx.doi.org/10.1158/1078-0432.CCR-14-1087
- Nagase H, Ghosh S. Epigenetics: differential DNA methylation in mammalian somatic tissues. FEBS J 2008; 275:1617-23; PMID:18331347; http://dx.doi.org/10.1111/j.1742-4658.2008.06330.x
- Cavallaro U, Christofori G. Cell adhesion and signalling by cadherins and Ig-CAMs in cancer. Nat rev Cancer 2004; 4:118-32; PMID:14964308; http://dx.doi.org/10.1038/nrc1276
- Jones PA, Baylin SB. The epigenomics of cancer. Cell 2007; 128:683-92; PMID:17320506; http://dx.doi.org/10.1016/j.cell.2007.01.029
- Ibragimova I, Dulaimi E, Slifker MJ, Chen DY, Uzzo RG, Cairns P. A global profile of gene promoter methylation in treatment-naive urothelial cancer. Epigenetics 2014; 9:760-73; PMID:24521710; http://dx.doi.org/10.4161/epi.28078
- Li Y, Li S, Chen J, Shao T, Jiang C, Wang Y, Chen H, Xu J, Li X. Comparative epigenetic analyses reveal distinct patterns of oncogenic pathways activation in breast cancer subtypes. Hum Mol Genetics 2014; 23:5378-93; PMID:24871326; http://dx.doi.org/10.1093/hmg/ddu256
- Gyparaki MT, Basdra EK, Papavassiliou AG. DNA methylation biomarkers as diagnostic and prognostic tools in colorectal cancer. J Mol Med 2013; 91:1249-56; PMID:24057814; http://dx.doi.org/10.1007/s00109-013-1088-z
- Guo M, Ren J, House MG, Qi Y, Brock MV, Herman JG. Accumulation of promoter methylation suggests epigenetic progression in squamous cell carcinoma of the esophagus. Clin Cancer Res 2006; 12:4515-22; PMID:16899597; http://dx.doi.org/10.1158/1078-0432.CCR-05-2858
- Kaneda A, Matsusaka K, Sakai E, Funata S. DNA methylation accumulation and its predetermination of future cancer phenotypes. J Biochem 2014; 156:63-72; PMID:24962701; http://dx.doi.org/10.1093/jb/mvu038
- Yagi K, Akagi K, Hayashi H, Nagae G, Tsuji S, Isagawa T, Midorikawa Y, Nishimura Y, Sakamoto H, Seto Y, et al. Three DNA methylation epigenotypes in human colorectal cancer. Clin Cancer Res 2010; 16:21-33; PMID:20028768; http://dx.doi.org/10.1158/1078-0432.CCR-09-2006
- Fackler MJ, Umbricht CB, Williams D, Argani P, Cruz LA, Merino VF, Teo WW, Zhang Z, Huang P, Visvananthan K, et al. Genome-wide methylation analysis identifies genes specific to breast cancer hormone receptor status and risk of recurrence. Cancer Res 2011; 71:6195-207; PMID:21825015; http://dx.doi.org/10.1158/0008-5472.CAN-11-1630
- Sandoval J, Mendez-Gonzalez J, Nadal E, Chen G, Carmona FJ, Sayols S, Moran S, Heyn H, Vizoso M, Gomez A, et al. A prognostic DNA methylation signature for stage I non-small-cell lung cancer. J Clin Oncol 2013; 31:4140-7; PMID:24081945; http://dx.doi.org/10.1200/JCO.2012.48.5516
- Bennett KL, Karpenko M, Lin MT, Claus R, Arab K, Dyckhoff G, Plinkert P, Herpel E, Smiraglia D, Plass C. Frequently methylated tumor suppressor genes in head and neck squamous cell carcinoma. Cancer Res 2008; 68:4494-9; PMID:18559491; http://dx.doi.org/10.1158/0008-5472.CAN-07-6509
- Snellenberg S, Cillessen SA, Van Criekinge W, Bosch L, Meijer CJ, Snijders PJ, Steenbergen RD. Methylation-mediated repression of PRDM14 contributes to apoptosis evasion in HPV-positive cancers. Carcinogenesis 2014; 35:2611-8; PMID:25233927; http://dx.doi.org/10.1093/carcin/bgu197
- Morris MR, Ricketts CJ, Gentle D, McRonald F, Carli N, Khalili H, Brown M, Kishida T, Yao M, Banks RE, et al. Genome-wide methylation analysis identifies epigenetically inactivated candidate tumour suppressor genes in renal cell carcinoma. Oncogene 2011; 30:1390-401; PMID:21132003; http://dx.doi.org/10.1038/onc.2010.525
- Kalari S, Pfeifer GP. Identification of driver and passenger DNA methylation in cancer by epigenomic analysis. Adv Genetics 2010; 70:277-308; PMID:22624715; http://dx.doi.org/10.1016/B978-0-12-380866-0.60010-1
- De Carvalho DD, Sharma S, You JS, Su SF, Taberlay PC, Kelly TK, Yang X, Liang G, Jones PA. DNA methylation screening identifies driver epigenetic events of cancer cell survival. Cancer Cell 2012; 21:655-67; PMID:22624715; http://dx.doi.org/10.1016/j.ccr.2012.03.045
- Schweikert EM, Devarajan A, Witte I, Wilgenbus P, Amort J, Forstermann U, Shabazian A, Grijalva V, Shih DM, Farias-Eisner R, et al. PON3 is upregulated in cancer tissues and protects against mitochondrial superoxide-mediated cell death. Cell Death Differ 2012; 19:1549-60; PMID:22441669; http://dx.doi.org/10.1038/cdd.2012.35
- Sultan AS, Xie J, LeBaron MJ, Ealley EL, Nevalainen MT, Rui H. Stat5 promotes homotypic adhesion and inhibits invasive characteristics of human breast cancer cells. Oncogene 2005; 24:746-60; PMID:15592524; http://dx.doi.org/10.1038/sj.onc.1208203
- Zeegers MP, Bryan RT, Langford C, Billingham L, Murray P, Deshmukh NS, Hussain S, James N, Wallace DM, Cheng KK. The West Midlands Bladder Cancer Prognosis Programme: rationale and design. BJU Int 2010; 105:784-8; PMID:19751260; http://dx.doi.org/10.1111/j.1464-410X.2009.08849.x
- Babjuk M, Burger M, Zigeuner R, Shariat SF, van Rhijn BW, Comperat E, Sylvester RJ, Kaasinen E, Bohle A, Palou Redorta J, et al. EAU guidelines on non-muscle-invasive urothelial carcinoma of the bladder: update 2013. European Urol 2013; 64:639-53; PMID:23827737; http://dx.doi.org/10.1016/j.eururo.2013.06.003
- Blin N, Stafford DW. A general method for isolation of high molecular weight DNA from eukaryotes. Nucleic Acids Res 1976; 3:2303-8; PMID:987581; http://dx.doi.org/10.1093/nar/3.9.2303
- Lauss M, Aine M, Sjodahl G, Veerla S, Patschan O, Gudjonsson S, Chebil G, Lovgren K, Ferno M, Mansson W, et al. DNA methylation analyses of urothelial carcinoma reveal distinct epigenetic subtypes and an association between gene copy number and methylation status. Epigenetics 2012; 7:858-67; PMID:22705924; http://dx.doi.org/10.4161/epi.20837
- Fryer AA, Emes RD, Ismail KM, Haworth KE, Mein C, Carroll WD, Farrell WE. Quantitative, high-resolution epigenetic profiling of CpG loci identifies associations with cord blood plasma homocysteine and birth weight in humans. Epigenetics 2011; 6:86-94; PMID:20864804; http://dx.doi.org/10.4161/epi.6.1.13392
- Wessely F, Emes RD. Identification of DNA methylation biomarkers from Infinium arrays. Front Genetics 2012; 3:161; PMID:22936948; http://dx.doi.org/10.3389/fgene.2012.00161
- Glossop JR, Emes RD, Nixon NB, Haworth KE, Packham JC, Dawes PT, Fryer AA, Mattey DL, Farrell WE. Genome-wide DNA methylation profiling in rheumatoid arthritis identifies disease-associated methylation changes that are distinct to individual T- and B-lymphocyte populations. Epigenetics 2014; 9:1228-37; PMID:25147922; http://dx.doi.org/10.4161/epi.29718
- Sen A, Heredia N, Senut MC, Hess M, Land S, Qu W, Hollacher K, Dereski MO, Ruden DM. Early life lead exposure causes gender-specific changes in the DNA methylation profile of DNA extracted from dried blood spots. Epigenomics 2015; 7:379-93; PMID:26077427; http://dx.doi.org/10.2217/epi.15.2
- Sturn A, Quackenbush J, Trajanoski Z. Genesis: cluster analysis of microarray data. Bioinformatics 2002; 18:207-8; PMID:11836235; http://dx.doi.org/10.1093/bioinformatics/18.1.207
- Khatri P, Draghici S. Ontological analysis of gene expression data: current tools, limitations, and open problems. Bioinformatics 2005; 21:3587-95; PMID:15994189; http://dx.doi.org/10.1093/bioinformatics/bti565
- Chomczynski P, Sacchi N. Single-step method of RNA isolation by acid guanidinium thiocyanate-phenol-chloroform extraction. Analytical Biochem 1987; 162:156-9; PMID:2440339; http://dx.doi.org/10.1016/0003-2697(87)90021-2
- Dudley KJ, Revill K, Whitby P, Clayton RN, Farrell WE. Genome-wide analysis in a murine Dnmt1 knockdown model identifies epigenetically silenced genes in primary human pituitary tumors. Mol Cancer Res 2008; 6:1567-74; PMID:18922972; http://dx.doi.org/10.1158/1541-7786.MCR-08-0234
- Al-Azzawi H, Yacqub-Usman K, Richardson A, Hofland LJ, Clayton RN, Farrell WE. Reversal of endogenous dopamine receptor silencing in pituitary cells augments receptor-mediated apoptosis. Endocrinol 2011; 152:364-73; PMID:21177832; http://dx.doi.org/10.1210/en.2010-0886
- Livak KJ, Schmittgen TD. Analysis of relative gene expression data using real-time quantitative PCR and the 2(−Delta Delta C(T)) Method. Methods 2001; 25:402-8; PMID:11846609; http://dx.doi.org/10.1006/meth.2001.1262
- Kitchen MO, Yacqub-Usman K, Emes RD, Richardson A, Clayton RN, Farrell WE. Epidrug mediated re-expression of miRNA targeting the HMGA transcripts in pituitary cells. Pituitary 2015; 18(5):674-84; PMID:25557289; http://dx.doi.org/10.1007/s11102-014-0630-5
- Raponi M, Zhang Y, Yu J, Chen G, Lee G, Taylor JM, Macdonald J, Thomas D, Moskaluk C, Wang Y, et al. Gene expression signatures for predicting prognosis of squamous cell and adenocarcinomas of the lung. Cancer Res 2006; 66:7466-72; PMID:16885343; http://dx.doi.org/10.1158/0008-5472.CAN-06-1191
- Gardiner-Garden M, Frommer M. CpG islands in vertebrate genomes. J Mol Biol 1987; 196:261-82; PMID:3656447; http://dx.doi.org/10.1016/0022-2836(87)90689-9