
ABSTRACT
A high consumption of trans fatty acids (TFAs) is associated with an increased risk of cardiovascular diseases (CVDs). High-density lipoproteins (HDLs) have many cardioprotective properties and transport functional microRNAs (miRNAs) to recipient cells. We hypothesized that dietary TFAs modify the HDL-carried miRNA profile, therefore modulating its cardioprotective properties. We assessed whether consumption of dietary TFAs modifies HDL-carried miR-223-3p and miR-135a-3p concentration and the inter-relationship between diet-induced changes in HDL-carried miRNA concentration and CVD risk markers. In a double blind, randomized, crossover, controlled study, 9 men were fed each of 3 experimental isoenergetic diets: 1) High in industrial TFA (iTFA; 3.7% energy); 2) High in TFA from ruminants (rTFA; 3.7% energy); 3) Low in TFA (control; 0.8% energy) for 4 weeks each. HDLs were isolated by ultracentrifugation and miRNAs were quantified by RT-qPCR. Variations in HDL-miR-223-3p concentration were negatively correlated with variations in HDL-cholesterol after the iTFA diet (rs = 0.82; P = 0.007), and positively correlated with variations in C-reactive protein concentration after the rTFA diet (rs = 0.75; P = 0.020). Variations in HDL-miR-135a-3p concentration were positively correlated with variations in total triglyceride (TG) concentration following the iTFA diet (rs = −0.82; P = 0.007), and with variations in low-density lipoprotein (LDL)-TG concentration following the rTFA diet (rs = 0.83; P = 0.005), compared to the control diet. However, the consumption of dietary TFAs has no significant unidirectional impact on HDL-carried miR-223-3p and miR-135a-3p concentrations. Our results suggest that the variability in the HDL-carried miRNAs response to TFA intake, by being associated with variations in CVD risk factors, might reflect physiological changes in HDL functions.
KEYWORDS:
Abbreviations
| BMI | = | Body mass index |
| CRP | = | C-reactive protein |
| CV | = | Coefficient of variation |
| CVD | = | Cardiovascular disease |
| HDL | = | High density lipoprotein |
| IDL | = | Intermediate density lipoprotein |
| iTFA | = | Industrial trans fatty acid |
| LDL | = | Low density lipoprotein |
| Padj | = | P value adjusted for multiple testing (Bonferroni) |
| PapoA1 | = | P value adjusted for HDL-ApoA1 concentration |
| PCA | = | Principal component analysis |
| RC | = | Rate of change |
| rs | = | Spearman's rank correlation coefficient |
| rTFA | = | Trans fatty acid from ruminants |
| T2D | = | Type 2 diabetes |
| TC | = | Total cholesterol |
| TFA | = | Trans fatty acid |
| TG | = | Triglyceride |
| VLDL | = | Very low-density lipoprotein |
Introduction
Cardiovascular diseases (CVDs) are the main cause of death worldwide.Citation1 According to the World Health Organization, about 80% of coronary heart diseases and cerebrovascular diseases are due to behavioral risk factors, such as physical inactivity, unhealthy diet, smoking, and excessive alcohol consumption.Citation1 An unhealthy diet could lead to inflammation and metabolic disorders considered as “intermediate” CVD risk factors, namely hypertension, dyslipidemia, type 2 diabetes (T2D), and obesity.Citation2,3
Trans fatty acids (TFA) are naturally found in dairy and meat derived from ruminants (rTFA). Indeed, TFA are produced by biohydrogenation of unsaturated fatty acids in the rumen of animals like cattle and goats, by means of the bacterial metabolism.Citation4 TFA are also produced industrially by partial hydrogenation of vegetal or fish oils (iTFA), resulting in semi-solid fats (e.g., shortenings) that were commonly used in the food industry (e.g., in pastries).Citation4 Although the same isomers constitute these trans fats,Citation5 the difference in isomer proportions between TFAs from ruminant (predominantly C18:1Δ11t) or industrial origin (mainly C18:1Δ10t and C18:1Δ9t) may suggest distinct effects of TFAs on health depending on their source, although this still remains controversial.Citation4-6 Many epidemiological and intervention studies associated the consumption of TFAs with an increased risk of CVDs.Citation4,7-9 Specifically, TFA consumption has been associated with increased low-density lipoprotein-cholesterol (LDL-C) concentration and Lp(a) lipoprotein concentration, and with a decreased high-density lipoprotein-cholesterol (HDL-C) concentration.Citation9-11 Moreover, some studies have also reported a positive association of high TFA consumption with inflammation and endothelial dysfunction markers.Citation12-15 Although the detrimental effects of iTFAs on cardiovascular health are well established, there is less evidence regarding the effects of rTFAs on health,Citation4,16,17 as their dietary uptake is relatively low (0.5% of energyCitation4,11) in the North American population.
HDL-C levels have been identified as a strong and independent inverse cardiovascular risk marker.Citation18,19 However, recent therapeutic approaches targeting HDL-C have failed to reduce cardiovascular risk effectively, despite a massive increase in this lipoprotein in circulation (20% to 140%).Citation19,20 These results illustrate that the sole increase in circulating HDL-C concentration is not sufficient to prevent CVD, and therefore highlight the need to better understand the role of HDLs in cardiovascular pathophysiology. Until recently, HDL cardioprotective function was attributed almost exclusively to its role in the reverse cholesterol transport to the liver.Citation21 However, HDL anti-inflammatory, antioxidant, and anti-thrombotic properties, as well as their insulin secretagogue action also have great cardioprotective potential, although the underlying mechanisms remain essentially unknown.Citation22-26
Interestingly, Vickers et al. have recently identified HDLs as microRNA (miRNA) carriers that transport endogenous miRNAs in circulation and deliver them to recipient cells,Citation27 where miRNAs have functional capabilities.Citation28 miRNAs are short (∼22 nucleotides) noncoding single strand RNAs that regulate the expression of target genes by sequence-specific (mostly partial) hybridization to the targeted mRNA 3′UTR, blocking its translation and promoting its sequestration into processing bodies as well as its degradation (mRNA decay, accelerated by mRNA deadenylation and decapping).Citation29,30 Accordingly, we hypothesized that consumption of TFAs from different sources modifies, possibly in a different way, the HDL-carried miRNA profile, therefore modulating the risk of CVDs. Neither the exact composition of HDL-carried miRNAs nor their role in the regulation of these pathways has been characterized so far.
In this study, we assessed whether the consumption of dietary trans fats (i.e., diets rich in iTFA and rTFA) modifies the concentration of 2 of the most abundant HDL-carried miRNAs identified by Vickers et al., namely has-miR-223-3p (the most abundant miRNA in HDL from patients with familial hypercholesterolemia) and has-miR-135a-3p (the most abundant miRNA in HDL from healthy subjects).Citation27 We also assessed the inter-relationship between changes in concentration of these miRNAs and variations in blood lipids and inflammatory markers induced by diets rich in TFAs from different sources.
Results
Characteristics of subjects
presents an anthropometric and metabolic description of the study participants following each of the 3 experimental isoenergetic diets (i.e., a control diet low in TFA and diets rich in rTFA or iTFA). On average, the 9 participants were ∼37 y old, slightly overweight (mean BMI: ∼25), and normotensive.Citation31 Mean blood lipid and inflammatory marker concentrations were within normal values.Citation32,33 However, one of the participants showed an increased CRP concentration due to an infection reported during the control diet. Taking into account this potential bias, we show that the results remain overall unchanged after the exclusion of this participant from the analyses (n = 8; Supplemental Table 1). As expected, with the personalized adjustment of energy intake, the participants' mean BMI and waist girth remained overall constant between diets. TC concentration (P = 0.013), LDL-C concentration (P = 0.045), and diastolic blood pressure (P = 0.025) showed variations between the 3 diet groups. However, these differences did not remain statistically significant after Bonferroni adjustment (TC: P = 0.052; LDL-C: P = 0.180, and diastolic blood pressure: P = 0.100).
Table 1. Differences in anthropometric characteristics, blood lipid profile, inflammatory marker and miRNA concentrations of the 9 subjects following each of the 3 experimental diets1.Footnote1
HDL-miR-223-3p and miR-135a-3p concentration variations in response to each diet
Absolute quantification of miR-223-3p and miR-135a-3p was performed on pooled miRNA samples extracted from HDL fractions (n = 9) after each diet to provide an indication of the number of these miRNA copies carried by HDLs (). miRNA concentration was expressed as number of copies per microgram of ApoA1 (comparable ApoA1 concentrations between diets, ) measured in the purified HDL fraction [HDL-ApoA1 is the major (∼70%) protein constituent specific to HDLCitation34 and, to a lesser extent, to chylomicronsCitation35]. On average, we observed a much higher number of miR-223-3p copies/μg of ApoA1 than of miR-135a-3p in HDLs (2796.27 ± 606.83 vs. 11.87 ± 13.12, respectively). Interestingly, for both of these miRNAs, the number of copies increased after both TFA diets, as compared to the control diet. The miRNA concentration increased by 5.5-15.6% (i.e., up to 406 copies/μg of ApoA1) for miR-223-3p and by 225-1,700% (i.e., up to 28 copies/μg of ApoA1) for miR-135a-3p, although the number of miRNA copies for the later remains marginal. We then investigated whether HDL-miR-223-3p and HDL-miR-135a-3p responded to TFAs using relative quantification values measured in each individual sample. shows the fold changes in HDL-miR-223-3p and HDL-miR-135a-3p concentrations between each diet pairs. The variations were bidirectional [i.e., either increased or decreased between participants (individually); see Supplemental Fig. 1] and did not show significant differences between the 3 diets ().
Table 2. Differences in mean HDL-carried has-miR-223-3p and has-miR-135a-3p relative concentrations between the 3 experimental diets (n = 9).1Footnote1
Variations in HDL-miRNA concentration and HDL-related phenotypes
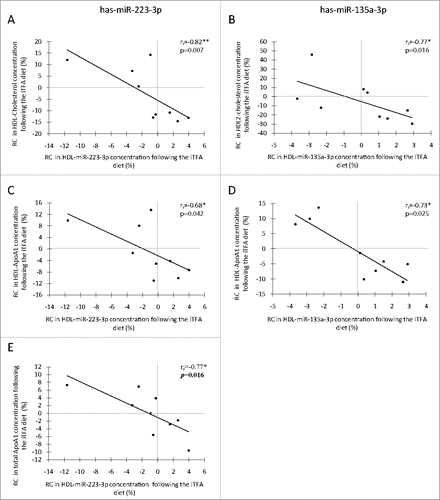
In regard to the important role of HDL in reverse cholesterol transport,Citation21 the possible associations between HDL-miRNA concentration and HDL-related phenotypes were then assessed. Indeed, rate of change (RC) in the concentration of both miRNAs was negatively correlated with RC in HDL-C (, rs =−0.82, P = 0.007 for miR-223-3p; and , rs =−0.77, P = 0.016 for miR-135a-3p), and these associations remained significant after adjustment for the HDL-ApoA1 concentration (Supplemental Table 2, rs =−0.68, PapoA1 = 0.043 and rs =−0.77, PapoA1 = 0.015, respectively). RC in the concentrations of both miRNAs was also negatively correlated with RC in HDL-ApoA1 concentration (, rs =−0.68, P = 0.042 for miR-223-3p; and , rs = −0.73, P = 0.025 for miR-135a-3p). Moreover, RC in HDL-miR-223-3p concentration and RC in total plasmatic ApoA1 concentration were negatively correlated (, rs =−0.77, P = 0.016). None of these associations remained significant after Bonferroni adjustment (Supplemental Table 2), although some of them still showed trends for associations: RC in HDL-miR-135a-3p with RC in HDL2-C (rs =−0.77, Padj = 0.060) and RC in HDL-ApoA1 (rs = −0.73, P = 0.100), and RC in HDL-miR-223-3p with total ApoA1 (rs =−0.77, P = 0.064). These correlations were specific to the iTFA diet.
Figure 1. Spearman's Rank Correlation between rate of change in HDL-carried miRNA concentrations and HDL-related phenotypes following a diet rich in TFAs (n = 9). Correlations of RC in HDL-cholesterol concentration with RC in HDL-carried has-miR-223-3p concentrations (A) and with RC in HDL-carried has-miR-135a-3p concentrations (B) following the iTFA diet. Correlations of RC in HDL-ApoA1 concentration with RC in HDL-carried has-miR-223-3p concentrations (C) and with RC in HDL-carried has-miR-135a-3p concentrations (D) following the iTFA diet. Correlation between RC in total ApoA1 concentration and RC in HDL-carried has-miR-223-3p concentrations following the iTFA diet (E). Statistical significance: *P ≤ 0.05, ** P ≤ 0.01. ApoA1: apolipoprotein A1; HDL-ApoA1: apolipoprotein A1 in the HDL fraction; iTFA: diet rich in trans fatty acids from industrial source; RC: rate of change (%).
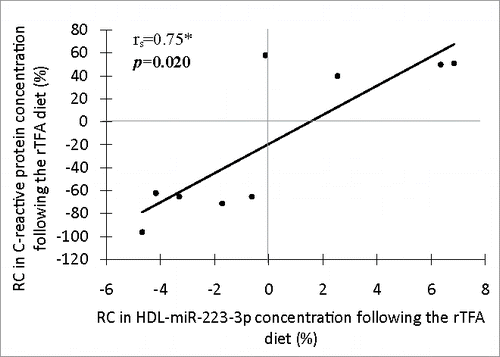
Since HDL particles have anti-inflammatory properties,Citation25 the potential associations of both HDL-miRNA concentrations with the concentration of CRP, a well-characterized marker of inflammation,Citation36 were assessed. As shown in , RC in HDL-miR-223-3p concentration and RC in CRP concentration were positively correlated (rs = 0.75; P = 0.020) following the rTFA diet in comparison with the control diet. This correlation remained significant after further adjustment for HDL-ApoA1 concentration (Supplemental Table 2; rs = 0.75; PapoA1 = 0.021). However, a trend for association was observed following Bonferroni adjustment (Supplemental Table 2; rs = 0.75; Padj = 0.084). No other correlation was observed with CRP.
Figure 2. Spearman's Rank Correlation between rate of change in HDL-carried has-miR-223-3p concentration and RC in inflammatory marker C-reactive protein concentration following the rTFA diet (n = 9). Statistical significance: *P ≤ 0.05. RC: rate of change (%); rTFA: diet rich in trans fatty acids from ruminant.
Variations in HDL-miRNA concentration related to variations in (other) blood lipid profile phenotypes after both diets
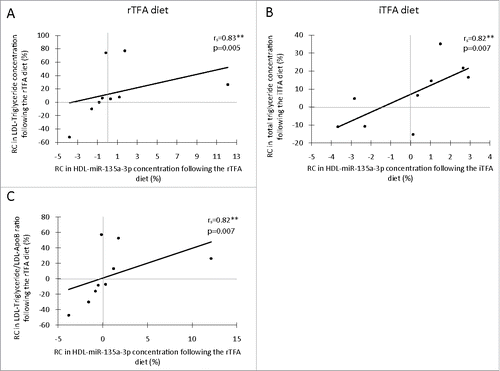
RC in HDL-miR-135a-3p concentration was correlated with the RC in LDL-TG concentration (; rs=0.83; P=0.005) following the rTFA diet, and with the RC in total TG concentration (; rs = 0.82; P = 0.007) following the iTFA diet. Both associations remained significant after adjustment for HDL-ApoA1 concentration (rs = 0.83; PapoA1 = 0.006 and rs = 0.68; PapoA1 = 0.043, respectively), but only the first remained significant when adjusted for multiple testing (rs = 0.83; Padj = 0.024 and rs = 0.68; Padj=0.172, respectively; Supplemental Table 2). In response to the rTFA diet, the RC in HDL-miR-135a-3p concentration was correlated with the RC in LDL-TG/LDL-apolipoproteinB (ApoB) ratio (; rs = 0.82; P = 0.007), even when the association was adjusted for the HDL-ApoA1 concentration (rs = 0.81; PapoA1 = 0.009) and for multiple testing (rs = 0.81; Padj = 0.036; Supplemental Table 2). No other significant correlation was observed.
Figure 3. Spearman's Rank Correlation between rate of change (RC; %) in HDL-carried miRNA concentration and blood lipid profile (other than HDL)-related phenotypes following a diet rich in TFAs (n = 9). Correlation between LDL-triglyceride and HDL-carried has-miR-135a-3p concentration following the rTFA diet (A), correlation between total triglyceride and HDL-carried has-miR-135a-3p concentration following the iTFA diet (B), and correlation between LDL-triglyceride/LDL-ApoB ratio and HDL-carried has-miR-135a-3p concentration following the rTFA diet (C). Significance: *P ≤ 0.05, ** P ≤ 0.01. ApoB: apolipoprotein B100 from the LDL fraction; iTFA: diet rich in trans fatty acids from industrial source; LDL-TG: triglycerides from the LDL fraction; RC: rate of change (%); rTFA: diet rich in trans fatty acids from ruminant.
Co-regulation of variations in HDL-miR-223-3p and HDL-miR-135a-3p
Finally, we assessed whether HDL-miR-223-3p and HDL-miR-135a-3p concentration variations between diets could have been co-regulated. Indeed, a trend for positive correlation was observed between the RC in HDL-miR-223-3p and RC in HDL-miR-135a-3p concentrations following the iTFA compared to the control diet, although it did not reach statistical significance (rs = 0.617; P = 0.077; data not shown). However, no correlation was observed between variations in these miRNAs concentration following the rTFA diet (rs = 0.167; P = 0.668).
Discussion
Over the last few years, the study of miRNAs as important regulators of cardiometabolic health has become a field of growing interest.Citation37,38 The demonstration that HDLs transport and deliver functional miRNAs to recipient cells raised the possibility that HDL-carried miRNAs might be involved in the regulation of the HDL physiological functions.Citation27 Although circulating miRNAs were previously found affected by diets,Citation39-41 to the best of our knowledge, this is the first study assessing the dietary impacts on HDL-carried miRNA concentrations and their inter-relationship with changes in the CVD risk profile.
miR-223 is one of the most studied and best characterized miRNAs so far.Citation42 In previous studies, miR-223-3p expression was found altered in several cardiometabolic diseases, such as obesity, insulin resistance, T2D, atherosclerosis, and inflammatory disorders.Citation27,43,44 The miR-223-3p concentration has been associated with anti-inflammatory properties [by targeting, among others, Intercellular adhesion molecule 1 (ICAM-1) and PBX/knotted 1 homeobox 1 (Pknox1) mRNAs],Citation28,45 as well as intracellular and systemic cholesterol homeostasis by repressing cholesterol biosynthesis and HDL-C uptake, and enhancing cholesterol efflux to HDLs [by targeting, among others, Scavenger receptor class B type I (SCARBI), transcription factor SP3 (SP3), 3-hydroxy-3-methylglutaryl-CoA synthase 1 (HMGCS1) and methylsterol monooxygenase 1 (SC4MOL) mRNAs].Citation46 miR-223-3p expression in human hepatocytes was found positively associated to the intracellular cholesterol concentration,Citation46 and miR-223-3p concentration was increased in HDLs of patients with familial hypercholesterolemia compared to healthy subjects.Citation27 Also, a very recent study reported a decrease in HDL-carried miR-223-3p concentration following a diet rich in proteins and that this change in HDL-miR-223-3p level was associated with diet-induced weight loss in overweight and obese men.Citation41 In the current study, we report negative correlations between variations in HDL-miR-223-3p and variations in HDL-C, HDL-ApoA1, and total ApoA1 concentrations after 4 weeks of a diet rich in iTFA. These results suggest a miR-223-3p enrichment in HDLs and that such an increase would be associated with a worsening of the cardiovascular risk profile.Citation18,47 This miR-223-3p enrichment in HDLs could reflect the intracellular response of HDL-miRNA donor-cells to maintain cholesterol homeostasis, which is supported by previous results.Citation28,45,46
Interestingly, we also report a positive correlation between RC in HDL-miR-223-3p concentration and RC in CRP concentration following the rTFA diet compared to the control diet. This result is consistent with the upregulation of miR-223-3p observed in almost, but not all, inflammatory disorders.Citation43 Recent studies in mice demonstrated that miR-223-3p has an anti-inflammatory function on macrophages (differentiation and activation pattern)Citation43,45 and endothelial cells (repression of adhesion molecules).Citation28 More importantly, Tabet et al. showed that miR-223-3p transferred from HDL to endothelial cells could mediate this effect.Citation28 The observed relationship between RC in HDL-miR-223-3p and CRP concentrations suggests that, following a diet rich in rTFA, an increase in HDL-miR-223-3p concentration would be an attempt to attenuate inflammation, although this hypothesis needs to be validated.
Currently, very little is known about the role of miR-135a-3p in cardiovascular health. A decrease in miR-135a-3p concentration has been reported in HDLs of subjects with atherosclerosis.Citation27 miR-135a-3p expression in the liver was increased in patients with liver steatosis,Citation48 while it was decreased in non-alcoholic fatty liver diseasesCitation49 and hepatitis-C virus infectionCitation48 compared to healthy individuals. In this study, we observed that the rate of change (RC) in HDL-miR-135a-3p concentration was negatively correlated with RC of HDL-related phenotypes (i.e., HDL-ApoA1 and HDL2-C) after the iTFA diet. Interestingly, miR-135a-3p has predicted target sites (no known validated target) on mRNAs of genes implicated in lipoprotein metabolism such as apolipoprotein A-II (APOA2) and cholesteryl ester transfer protein (CETP) (MicroCosm Targets, version 5), suggesting a possible role of this HDL-carried miRNA in the regulation of HDL-C metabolism. Our results also showed that RC in HDL-miR-135a-3p concentration after a diet rich in iTFA was positively associated with RC in the total TG concentration of the participants. Moreover, RC in HDL-miR-135a-3p concentration was positively correlated with RC in LDL-TG concentration after the rTFA diet compared to the control diet, even when the LDL-TG concentration was reported on ApoB concentration (i.e., LDL-ApoB, one ApoB per LDL particle).Citation50 This therefore suggests that an increase in HDL-miR-135a-3p concentration could reflect a triglyceride enrichment of LDLs following a diet rich in TFA. LDL enrichment in TGs had previously been associated with an enhanced atherogenic potential of this lipoprotein.Citation51 The positive correlation of HDL-miR-135a-3p with the participant's TG profile also suggests that the concentration of miR-135a-3p in HDL could reflect its transcription levels in the liver.Citation48 Whether HDL-miR-135a-3p could be transferred to recipient cells in sufficient amounts (i.e., relatively low concentration in HDL compared to miR-223-3p) and could regulate these putative target genes will have to be assessed in further studies.
The contrast in isomers proportion and structure of the TFAs from ruminant and industrial sources as well as their distinct consequences on cardiovascular health raise the hypothesis that their biological effects may also be different.Citation4-6 Accordingly, a recent study from Krogager et al. showed that an exposition to either elaedic or trans-vaccenic acids (major iTFA and rTFA isomers, respectively) in hepatocytes resulted in altered expression levels of almost specific subsets of proteins mainly involved in cholesterol and lipid metabolism.Citation52 Interestingly, we reported distinct associations between RC in miRNA concentration and RC in CVD risk markers depending of the origin of TFAs. Indeed, the variations in miRNA concentrations following the diet rich in rTFA were most likely associated with inflammation and lipids (triglycerides) metabolism markers whereas those observed following the diet rich in iTFA were principally associated with HDL-C metabolism markers, also supporting the hypothesis that TFAs might affect health in a different way depending on their origin.
Strengths and limitations
To the best of our knowledge, this is the first documentation of the influence of diet on the HDL-carried miRNA profile, and subsequent effect on risk factors for CVDs. The double blind, randomized, crossover, controlled design of the nutritional approach is a clear strength of this study, as it reduced the potential for biases (e.g., selection bias) and confounding between groups.Citation53 The diets' composition (similar menus, caloric amount and macronutrient composition, except for the concentration and origin of TFAs), nutritional follow-up (with all meals provided for the complete duration of each diet), and high compliance to the diets (>99%) were also among the strengths of this study. Moreover, the extensive phenotyping of the participants allowed more detailed analyses on the association between the participants' lipoprotein metabolism markers and HDL-miRNA concentrations. HDL purity (i.e., exempt from exosome or LDL) was confirmed to avoid the presence of miRNAs from other lipoproteins or circulating vesicles in our samples. Absolute quantification of HDL-carried has-miR-223-3p and has-miR-135a-3p was performed.
This study has also limitations. Despite a strong study design, the small sample size (n = 9) limited our capacity to detect effects of the diet on the HDL-miRNA concentration and the participants' metabolic profile smaller than correlation critical r ≥ 0.66 and Wilcoxon Signed critical t ≥ 2.33 (i.e., lack of statistical power; a posteriori analysis, GPower3.1 software). Indeed, the reported P-values could be considered borderline significant, although the reported correlation coefficients are very high (0.67 < r < 0.83). Exploratory studies often require a more flexible approach for design and analyses,Citation54 so we presented here both raw results and those adjusted for multiple testing analysis. Also, an alternative hypothesis could be that, according to the observed variability in miRNA response to the diets, not all participants respond equally to the consumption of dietary TFAs, as this was observed for the consumption of omega-3 fatty acids.Citation55 Another important limitation of this study is that the results remain associative with only limited possibility to infer causal relationships. Nevertheless, our results provide support for further epidemiological studies with increased sample size. Functional studies are also required to confirm our findings and hypotheses.
Conclusion
In summary, this was the first study assessing the effects of a diet rich in TFA on the HDL-carried miRNA concentration. Although this randomized control trial had limited sample size, we report relatively strong associations between variations in HDL-carried miR-223-3p and miR-135a-3p concentration and an overall worsening of the CVD risk profile (HDL-C, ApoA1, LDL-TG, total TG or CRP concentration). The difference in the impacts of the different dietary TFA (rTFA vs. iTFA) also supports the hypothesis that they might affect health in a different way depending on their origin.
Subjects and methods
Subjects
Thirty-eight healthy men were recruited in the Québec city area (Québec, Canada) and completed a nutritional trial at the Institute of Nutrition and Functional Foods (INAF, Québec, Canada; Supplemental Fig. 2).Citation11 Exclusion criteria were: age <18 or >65 years, body mass index (BMI) <18 or >35, smokers, presence of endocrine disorders (e.g., dyslipoproteinemia) and metabolic diseases, the use of any medication, alcohol consumption >2 drinks/day and changes in body weight before the experiment.Citation11 From this relatively large sample, 9 subjects who also participated in a lipoprotein kinetics analysis were selected for this study. Written informed consent was obtained from all subjects at the beginning of the study, in accordance with the Declaration of Helsinki. The Clinical Research Ethic Committee of the Laval University and the Chicoutimi Hospital Ethics Committee approved this project.
Diets and study design
A detailed description of the nutritional trial has been provided previously.Citation11 Briefly, the participants were fed each of 3 experimental isoenergetic diets: high in iTFA (10.2 g / 2,500 kcal, 3.7% daily energy); high in rTFA (10.2 g / 2,500 kcal, 3.7% daily energy); and a diet low in TFA of any source (control; 2.2 g / 2,500 kcal, 0.8% daily energy). All diets were similar in caloric amount and macronutrient composition, except for the concentration and origin (i.e., industrial or ruminant) of the TFAs.Citation11 The energy intake has been matched to each participant's energy requirement to minimize body weight fluctuation during the study. Diets were randomly attributed to participants, following a double blind, randomized, crossover, controlled design.Citation11 Each diet lasted 4 weeks, with a 3 weeks or more wash-out period between them. All meals were provided to the participants for the complete duration of each diet, thus allowing controlling for daily energy intake and macronutrient composition of diets. As previously reported,Citation11 compliance to the diets was >99%.
Anthropometric and blood pressure measurement
The participants' anthropometric characteristics (e.g., waist, weight, height) were measured at the end of each experimental diet (day 26) using standardized procedures.Citation56 The BMI was calculated as weight (kg)/[height (m)]2. Blood pressure was also measured as previously described.Citation11
Plasma lipids and inflammatory markers' measurement
Fasting (12 h) blood samples were obtained at the end of each diet period (day 26) from the antecubical vein into vacutainer tubes containing EDTA for each participant. The lipoproteins were separated by sequential ultracentrifugation according to their respective density: very low-density lipoprotein (VLDL; density (ρ) = 0.95-1.006 g/mL), intermediate density lipoprotein (IDL; ρ = 1.006-1.019 g/mL), low-density lipoprotein (LDL; ρ = 1.019-1.063 g/mL), and high-density lipoprotein (HDL; ρ = 1.063-1.21 g/mL).Citation57 The HDL2 (ρ = 1.063-1.125 g/mL) and HDL3 (ρ = 1.125-1.21 g/mL) subfractions were then separated by ultracentrifugation at a density of 1.125 g/mL.Citation58 Briefly, lipoproteins were isolated from 5 ml of plasma on a density gradient of NaBr, in a Beckman Optima XL-100 K ultracentrifuge (Beckman Coulter Canada). All ultracentrifugation steps were performed at the parameters indicated in Supplemental Table 3, in a 50.4 Ti fixed-angle rotor (Beckman Coulter, catalog # 347299). A NaBr solution (ρ = 1.478 g/ml) was added to the plasma (and, subsequently, to the bottom fraction isolated from the precedent ultracentrifugation step) in a quick seal tube (Beckman Coulter, catalog # 344619) to achieve the appropriate density for the isolation of the lipoprotein of interest (e.g., 1.006 g/ml to isolate VLDLs (top fraction: ρ < 1.006 g/ml)). Tubes were then filled with a NaBr solution of the same density as the previously adjusted lipoproteins-NaBr solution, and carefully mixed. After ultracentrifugation, the top and bottom fractions were separated by the tube slicing technique on a centritube slicer (Beckman Coulter, catalog # 347960). The total cholesterol (TC) and triglyceride (TG) concentrations in plasma and lipoprotein fractions were enzymatically measured on a Roche/Hitachi Modular P chemistry analyzer (Roche Diagnostics, Mannheim, Germany), according to a standardized procedure.Citation59 The plasma LDL-C concentration was calculated using the Friedewald formula.Citation60,61 The apolipoprotein A1 (ApoA1) concentration in plasma and in the HDL fraction was measured by a standardized electroimmunoassay.Citation11,62 The C-reactive protein (CRP) concentration in plasma was quantified by immunonephelometry (Behring Nephelometer BN-100; Behring Diagnostic, Westwood, Mass, USA).
HDL purification efficiency and purity
The efficiency of the isolation of the HDL by sequential ultracentrifugation was assessed. The HDL recovery rate was estimated based on the ApoA1 concentration in the HDL fraction as compared to the plasma. On average, ultracentrifugation of plasma allowed a modest HDL recovery rate (35.71 ± 2.79%), which may be attributed, at least partially, to the high number of ultracentrifugation steps performed prior to HDL isolation (i.e., exacerbating the loss of ApoA1 previously reported during ultracentrifugal isolationCitation63,64). The HDL fraction purity was assessed using a HYDRAGEL 15 LDL/HDL CHOL Direct kit (Somagen, catalog # SEB4135; Supplemental Fig. 3). Briefly, this technique allows the separation of the lipoproteins (chylomicrons, VLDL, LDL and HDL) using electrophoresis on an alkaline (pH: ∼8.9) buffered agarose gel and semi-automated HYDRASYS instrument system (Sebia Inc., Norcross, GA). Cholesterol concentration of the HDL and LDL bands after migration was then quantified using densitometry (HYRYS densitometer and PHORESIS software, Sebia Inc.). Relative concentrations (percentage) of the LDL and HDL lipoproteins were then assessed in plasma (control) and HDL fraction for each participant. In this study, the 27 post-diet HDL fractions were analyzed using this technique and showed a very high purity (mean HDL content: 98.0 ± 2.39%).
Finally, the co-purification of exosomes (ρ = 1.10–1.18 g/mL) and HDL (ρ = 1.063-1.21 g/mL) was also assessed using anti-CD63 (i.e., specific exosomal antigen protein) ExoELISATM kit (MJS Biolynx, catalog # SYEXOELCD63A1).Citation65 No CD63 has been detected in the HDL fraction, whereas significant amounts were observed in plasma (1.87 × 10⁸ particles/µL; Supplemental Fig. 4).
RNA extraction
HDL-carried miRNAs were extracted from 250 µl of purified HDLs using the mirVanaTM PARISTM kit (Life Technologies, catalog # AM1556) following the manufacturer's standard procedure (i.e., total RNA isolation procedure). RNAse-free water and material were used, including decontaminated surfaces and pipettes using RNAseZap wipes (ThermoFisher Scientific, catalog# AM9786). mirVana Paris kit allows inactivation of RNAses (i.e., contains a high concentration of guanidinium thiocyanate, a strong chaotropic denaturant) and miRNAs extracted using this kit have been shown to be very stable when stored at −70°C for at least 1 y.Citation66 For use as an external control for miRNA expression profiling, 1.6 × 10⁸ copies (2 µl) of miRNeasy Serum/Plasma Caenorhabditis elegans (cel)-miR-39-3p mimic Spike-in Control (Qiagen, catalog # 219610) were added to the HDL samples before miRNA extraction. miRNAs were eluted in 75 µl of elution solution (mirVanaTMPARISTM kit, Life Technologies).
miRNA concentration measurement
cDNA (cDNA) was generated using has-miR-223-3p, has-miR-135a-3p and cel-miR-39-3p specific stem-loop RT primers from the TaqMan Small RNA Assays [catalog # 4427975; hsa-miR-223-3p (MIMAT0000280): assay # 002295; hsa-miR-135a-3p (MIMAT0004595): assay # 002232; cel-miR-39-3p (MIMAT0000010): assay # 000200], and TaqMan MicroRNA Reverse Transcription Kit (Life Technologies, catalog # 4366596). The stem-loop structure of the RT primer allows the detection of mature miRNAs only, without detection of miRNA precursors or genomic DNA.Citation67 The reverse transcription step was performed in a 15 μl reaction containing 5 μl of RNA sample, in agreement with the manufacturer's recommendations. The real-time quantitative PCR (RT-qPCR) step was performed in a 20 μl reaction containing 10 μl of 2x TaqMan Universal MasterMix II No UNG (Life Technologies, catalog # 4440040) and 1.3 μl of cDNA, following the standard procedure. The reactions were run and analyzed on an Applied Biosystems 7,500 Real Time PCR System (Life Technologies). All samples were run in duplicate and showed low coefficients of variation (CV: 0.23 ± 0.19%) between replicates. HDL-miR-223-3p and HDL-miR-135a-3p concentrations were quantified relatively to the exogenous control cel-miR-39 [miR-223-3p (or miR-135a-3p)/cel-miR-39 cycle threshold (Ct) ratio (1/x) values]. cel-miR-39-3p concentration in HDL fraction (Ctmean ± SD) was constant between diets (rTFA: 20.80 ± 1.06; iTFA: 20.79 ± 0.81; control diet: 21.01 ± 0.76; χ2 = 0.222; P = 0.895).
The absolute quantification of HDL-miR-223-3p and HDL-miR-135a-3p in pools of 9 post-diet samples was performed using standard curves generated from a synthetic, HPLC-purified, 5′phosphorylated RNA oligonucleotides with identical sequence to the mature has-miR-223-3p and has-miR-135a-3p respectively (Integrated DNA Technologies, Toronto, ON, Canada).Citation68 Briefly, 9 serial 2-fold dilutions, from a concentration of 60,200 copies/μl to 235 copies/μl of synthetic hsa-miR-223-3p and from a concentration of 2,408 copies/μl to 9.4 copies/μl of synthetic has-miR-135a-3p, respectively, were made using RNase-free water. RT-qPCR of the standard curve dilutions were performed in parallel with the experimental samples [a pool of samples (n=9) for each diet], on an Applied Biosystems 7,500 Real Time PCR System (Life Technologies). Each sample was run in triplicate and showed low coefficients of variation between replicates (has-miR-223-3p: 0.20 ± 0.14%; has-miR-135a-3p: 1.29 ± 0.76%). Each dilution of the standard curve was also run in triplicate and showed low coefficients of variation (has-miR-223-3p: 0.30 ± 0.18%; has-miR-135a-3p: 1.31 ± 1.13%) between replicates. PCR efficiency (E) was calculated from the standard curve data as follow: E = (101/slope)-1, and was shown in the acceptable range for both has-miR-223-3p (E = 92.2%; r2 = 0.986) and has-miR-135a-3p (E = 106.8%; r2 = 0.996).Citation69
Statistical analyses
The stability of the cel-miR-39-3p concentration between diets was confirmed using a Friedman's test. The fold changes in HDL-miRNA concentration between diets were calculated using the ΔΔCt method as follows: Fold Change = 2−ΔΔCt, where ΔΔCt = (CtmiRNA - Ctcel-miR-39)(i or r)TFA diet (CtmiRNA - Ctcel-miR-39)Control diet.Citation70 Variations in HDL-miRNA concentration (or other variable) after the iTFA and rTFA diets were expressed as percentage of difference observed after the control diet [i.e., rate of change (RC) value] as follows: RC (%) = 100 × (TFA diet – Control diet)/Control diet. Participants' characteristics were grouped in 4 independent categories of related tests according to principal component analysis (PCA) results (data not shown): 1) Anthropometrics and atherogenic lipoproteins and lipids; 2) Atheroprotective lipoprotein and its major protein component; 3) Blood pressure; and 4) Inflammatory marker. Differences between diets were assessed using the Friedman's test, with Bonferroni adjusted P values for multiple testing [adjusted P value (Padj) = Friedman's test P value multiplied by 4 (PCA grouping) independent tests performed. A Friedman's test was also performed to assess whether the participants' mean relative HDL-miRNA concentrations were different between the 3 experimental diets, with Bonferroni adjustment for multiple testing (Padj = Friedman's test P value multiplied by 2 miRNAs studied). The participants' mean relative HDL-miRNA concentrations difference between diet pairs was assessed using a Wilcoxon signed-rank test. Correlations were tested using the Spearman's rank correlation coefficients (rs). Partial Spearman's correlations using residuals were used to adjust the associations for HDL-ApoA1 concentration (i.e., ApoA1 concentration measured in the HDL fraction; PapoA1),Citation71 as a surrogate (proxy) of the HDL particle number.Citation72 Correlations were adjusted for multiple testing according to the PCA analysis results (Padj = Partial spearman correlation P value multiplied by 4 independent tests performed). Results were considered statistically significant at P-values ≤ 0.05 (2-sided). Statistical analyses were performed with the SPSS software (version 11.5, IBM SPSS Statistics, Chicago, Il).
Disclosure of potential conflicts of interest
No potential conflicts of interest were disclosed.
Authors contribution
LB designed miRNA study; RG, FC and PC participated to miRNA study design; BL designed nutritional trial; VD and SPG (miRNA study), and BL (nutritional trial) conducted research; VD, SPG and LB analyzed/interpreted data; VD wrote the manuscript; LB had primary responsibility for final content. All authors have contributed to this work, read, and approved the final manuscript.
KEPI_A_1176816_supplementary_data.zip
Download Zip (151 KB)Acknowledgments
We are grateful to the metabolic kitchen, nurses and laboratory staff from the Institute of Nutrition and Functional Foods (INAF) of the Department of nutrition of Université Laval for their dedicated work during the nutritional trial. We express our gratitude to Céline Bélanger, Chicoutimi Hospital, for her thoughtful revision of the manuscript.
Funding
This study was supported by the Réseau de recherche en santé cardiométabolique, diabète et obésité (CMDO) of the Fonds de recherche du Québec en santé (FRQS), the Étienne-Le Bel Clinical research center (affiliated with the hospital of Université de Sherbrooke), and the ECOGENE-21 Clinical Research Center (principal investigator: Daniel Gaudet, MD, PhD, Université de Montréal). During this research, VD was recipient of a doctoral research award from the Faculté de médecine et des sciences de la santé (FMSS) of Université de Sherbrooke, and was subsequently recipient of a doctoral research award from FRQS. During this research, SPG was recipient of a doctoral research award from the Canadian Institutes of Health Research (CIHR). LB is a junior research scholar from the FRQS, and a member of the FRQS-funded Center de recherche du CHUS (affiliated to the Center hospitalier universitaire de Sherbrooke). The clinical trial was supported by an unrestricted grant from the Dairy Farmers of Canada, by Novalait Inc., and by a grant from the Natural Sciences and Engineering Research Council of Canada. The Canadian Dairy Commission donated the low-rTFA control butter; Provigo-Loblaws donated the foods used in the clinical trial.
Related Research Data
References
- Alwan A, Armstrong T, Bettcher D, Branca F, Chisholm D, Ezzati M, Garfield R, MacLean D, Mathers C, Mendis S, et al. Global status report on noncommunicable diseases 2010. Chapter 1: Burden: mortality, morbidity and risk factors. World Health Organization (WHO) 2011:9-31
- Alwan A, Armstrong T, Bettcher D, Boerma T, Branca F, Ho JCY, Mathers C, Martinez R, Poznyak V, Roglic G, et al. Global atlas on cardiovascular disease prevention and control. Section A: Cardiovascular diseases due to atherosclerosis. In: Mendis S, Puska P, Norrving B, eds.: World Health Organization, in collaboration with the World Heart Federation and the World Stroke Organization; 2011:18-32.
- Wardhana, Surachmanto ES, Datau EA. The role of omega-3 fatty acids contained in olive oil on chronic inflammation. Acta Med Indones 2011; 43:138-43; PMID:21785178
- Brouwer IA, Wanders AJ, Katan MB. Trans fatty acids and cardiovascular health: research completed? Eur J Clin Nutr 2013; 67:541-7; PMID:23531781; http://dx.doi.org/10.1038/ejcn.2013.43
- Stender S, Dyerberg J. Influence of trans fatty acids on health. Ann Nutr Metab 2004; 48:61-6; PMID:14679314; http://dx.doi.org/10.1159/000075591
- Da Silva MS, Julien P, Perusse L, Vohl MC, Rudkowska I. Natural rumen-derived trans fatty acids are associated with metabolic markers of cardiac health. Lipids 2015; 50:873-82; PMID:26210489; http://dx.doi.org/10.1007/s11745-015-4055-3
- Willett WC. Trans fatty acids and cardiovascular disease-epidemiological data. Atheroscler Suppl 2006; 7:5-8; PMID:16713753; http://dx.doi.org/10.1016/j.atherosclerosissup.2006.04.002
- Ganguly R, Pierce GN. Trans fat involvement in cardiovascular disease. Mol Nutr Food Res 2012; 56:1090-6; PMID:22760981; http://dx.doi.org/10.1002/mnfr.201100700
- Nestel P. Trans fatty acids: are its cardiovascular risks fully appreciated? Clin Ther 2014; 36:315-21; PMID:24636816; http://dx.doi.org/10.1016/j.clinthera.2014.01.020
- Katan MB, Zock PL, Mensink RP. Trans fatty acids and their effects on lipoproteins in humans. Annu Rev Nutr 1995; 15:473-93; PMID:8527230; http://dx.doi.org/10.1146/annurev.nu.15.070195.002353
- Motard-Belanger A, Charest A, Grenier G, Paquin P, Chouinard Y, Lemieux S, Couture P, Lamarche B. Study of the effect of trans fatty acids from ruminants on blood lipids and other risk factors for cardiovascular disease. Am J Clin Nutr 2008; 87:593-9; PMID:18326596
- Baer DJ, Judd JT, Clevidence BA, Tracy RP. Dietary fatty acids affect plasma markers of inflammation in healthy men fed controlled diets: a randomized crossover study. Am J Clin Nutr 2004; 79:969-73; PMID:15159225
- Mozaffarian D, Pischon T, Hankinson SE, Rifai N, Joshipura K, Willett WC, Rimm EB. Dietary intake of trans fatty acids and systemic inflammation in women. Am J Clin Nutr 2004; 79:606-12; PMID:15051604
- Lopez-Garcia E, Schulze MB, Meigs JB, Manson JE, Rifai N, Stampfer MJ, Willett WC, Hu FB. Consumption of trans fatty acids is related to plasma biomarkers of inflammation and endothelial dysfunction. J Nutr 2005; 135:562-6; PMID:15735094
- Bendsen NT, Stender S, Szecsi PB, Pedersen SB, Basu S, Hellgren LI, Newman JW, Larsen TM, Haugaard SB, Astrup A. Effect of industrially produced trans fat on markers of systemic inflammation: evidence from a randomized trial in women. J Lipid Res 2011; 52:1821-8; PMID:21795740; http://dx.doi.org/10.1194/jlr.M014738
- Gayet-Boyer C, Tenenhaus-Aziza F, Prunet C, Marmonier C, Malpuech-Brugere C, Lamarche B, Chardigny JM. Is there a linear relationship between the dose of ruminant trans-fatty acids and cardiovascular risk markers in healthy subjects: results from a systematic review and meta-regression of randomised clinical trials. Br J Nutr 2014; 112:1914-22; PMID:25345440; http://dx.doi.org/10.1017/S0007114514002578
- Gebauer SK, Chardigny JM, Jakobsen MU, Lamarche B, Lock AL, Proctor SD, Baer DJ. Effects of ruminant trans fatty acids on cardiovascular disease and cancer: a comprehensive review of epidemiological, clinical, and mechanistic studies. Adv Nutr 2011; 2:332-54; PMID:22332075; http://dx.doi.org/10.3945/an.111.000521
- Assmann G, Schulte H, von Eckardstein A, Huang Y. High-density lipoprotein cholesterol as a predictor of coronary heart disease risk. The PROCAM experience and pathophysiological implications for reverse cholesterol transport. Atherosclerosis 1996; 124(Suppl):S11-20; PMID:8831911; http://dx.doi.org/10.1016/0021-9150(96)05852-2
- Annema W, von Eckardstein A. High-density lipoproteins. Multifunctional but vulnerable protections from atherosclerosis. Circ J 2013; 77:2432-48; PMID:24067275; http://dx.doi.org/10.1253/circj.CJ-13-1025
- Luscher TF, von Eckardstein A, Simic B. Therapeutic targets to raise HDL in patients at risk or with coronary artery disease. Curr Vasc Pharmacol 2012; 10:720-4; PMID:23259565; http://dx.doi.org/10.2174/157016112803520972
- Rader DJ, Alexander ET, Weibel GL, Billheimer J, Rothblat GH. The role of reverse cholesterol transport in animals and humans and relationship to atherosclerosis. J Lipid Res 2009; 50(Suppl):S189-94; PMID:19064999
- Parthasarathy S, Barnett J, Fong LG. High-density lipoprotein inhibits the oxidative modification of low-density lipoprotein. Biochim Biophys Acta 1990; 1044:275-83; PMID:2344447; http://dx.doi.org/10.1016/0005-2760(90)90314-N
- Barter PJ, Nicholls S, Rye KA, Anantharamaiah GM, Navab M, Fogelman AM. Antiinflammatory properties of HDL. Circ Res 2004; 95:764-72; PMID:15486323; http://dx.doi.org/10.1161/01.RES.0000146094.59640.13
- Mineo C, Deguchi H, Griffin JH, Shaul PW. Endothelial and antithrombotic actions of HDL. Circ Res 2006; 98:1352-64; PMID:16763172; http://dx.doi.org/10.1161/01.RES.0000225982.01988.93
- Murphy AJ, Woollard KJ, Hoang A, Mukhamedova N, Stirzaker RA, McCormick SP, Remaley AT, Sviridov D, Chin-Dusting J. High-density lipoprotein reduces the human monocyte inflammatory response. Arterioscler Thromb Vasc Biol 2008; 28:2071-7; PMID:18617650; http://dx.doi.org/10.1161/ATVBAHA.108.168690
- Fryirs MA, Barter PJ, Appavoo M, Tuch BE, Tabet F, Heather AK, Rye KA. Effects of high-density lipoproteins on pancreatic beta-cell insulin secretion. Arterioscler Thromb Vasc Biol 2010; 30:1642-8; PMID:20466975; http://dx.doi.org/10.1161/ATVBAHA.110.207373
- Vickers KC, Palmisano BT, Shoucri BM, Shamburek RD, Remaley AT. MicroRNAs are transported in plasma and delivered to recipient cells by high-density lipoproteins. Nat Cell Biol 2011; 13:423-33; PMID:21423178; http://dx.doi.org/10.1038/ncb2210
- Tabet F, Vickers KC, Cuesta Torres LF, Wiese CB, Shoucri BM, Lambert G, Catherinet C, Prado-Lourenco L, Levin MG, Thacker S, et al. HDL-transferred microRNA-223 regulates ICAM-1 expression in endothelial cells. Nat Commun 2014; 5:3292; PMID:24576947; http://dx.doi.org/10.1038/ncomms4292
- Kim GH. MicroRNA regulation of cardiac conduction and arrhythmias. Transl Res 2013; 161:381-92; PMID:23274306; http://dx.doi.org/10.1016/j.trsl.2012.12.004
- Bratkovic T, Glavan G, Strukelj B, Zivin M, Rogelj B. Exploiting microRNAs for cell engineering and therapy. Biotechnol Adv 2012; 30:753-65; PMID:22286072; http://dx.doi.org/10.1016/j.biotechadv.2012.01.006
- (WHO) WHO. A global brief on hypertension: Silent killer, global public health crisis. Section II: Hypertension; the basic facts. In: WHO, ed., 2013:17.
- Genest J, McPherson R, Frohlich J, Anderson T, Campbell N, Carpentier A, Couture P, Dufour R, Fodor G, Francis GA, et al. 2009 Canadian cardiovascular society/canadian guidelines for the diagnosis and treatment of dyslipidemia and prevention of cardiovascular disease in the adult - 2009 recommendations. Can J Cardiol 2009; 25:567-79; PMID:19812802; http://dx.doi.org/10.1016/S0828-282X(09)70715-9
- Yeh ET, Willerson JT. Coming of age of C-reactive protein: using inflammation markers in cardiology. Circulation 2003; 107:370-1; PMID:12551854; http://dx.doi.org/10.1161/01.CIR.0000053731.05365.5A
- Weissglas-Volkov D, Pajukanta P. Genetic causes of high and low serum HDL-cholesterol. J Lipid Res 2010; 51:2032-57; PMID:20421590; http://dx.doi.org/10.1194/jlr.R004739
- Gagné C, Gaudet D. Les Dyslipoprotéinémies: L'approche Clinique. Chapitre 3 : Les lipides et les lipoproténes.: Lipimed communications, 2007. 25-39.
- Sorensen CJ, Pedersen OB, Petersen MS, Sorensen E, Kotze S, Thorner LW, Hjalgrim H, Rigas AS, Moller B, Rostgaard K, et al. Combined oral contraception and obesity are strong predictors of low-grade inflammation in healthy individuals: results from the Danish Blood Donor Study (DBDS). PLoS One 2014; 9:e88196; PMID:24516611; http://dx.doi.org/10.1371/journal.pone.0088196
- Condorelli G, Latronico MV, Cavarretta E. microRNAs in cardiovascular diseases: current knowledge and the road ahead. J Am Coll Cardiol 2014; 63:2177-87; PMID:24583309; http://dx.doi.org/10.1016/j.jacc.2014.01.050
- Novak J, Bienertova-Vasku J, Kara T, Novak M. MicroRNAs involved in the lipid metabolism and their possible implications for atherosclerosis development and treatment. Mediators Inflamm 2014; 2014:275867; PMID:24876669; http://dx.doi.org/10.1155/2014/275867
- Ortega FJ, Cardona-Alvarado MI, Mercader JM, Moreno-Navarrete JM, Moreno M, Sabater M, Fuentes-Batllevell N, Ramirez-Chavez E, Ricart W, Molina-Torres J, et al. Circulating profiling reveals the effect of a polyunsaturated fatty acid-enriched diet on common microRNAs. J Nutr Biochem 2015; 26:1095-101; PMID:26092372; http://dx.doi.org/10.1016/j.jnutbio.2015.05.001
- Marques-Rocha JL, Milagro FI, Mansego ML, Zulet MA, Bressan J, Martinez JA. Expression of inflammation-related miRNAs in white blood cells from subjects with metabolic syndrome after 8 wk of following a Mediterranean diet-based weight loss program. Nutrition Jan 2016; 32(1):48-55; PMID:26421388
- Tabet F, Cuesta Torres LF, Ong KL, Shrestha S, Choteau SA, Barter PJ, Clifton P, Rye KA. High-density lipoprotein-associated miR-223 is altered after diet-induced weight loss in overweight and obese males. PLoS One 2016; 11:e0151061; PMID:26962854; http://dx.doi.org/10.1371/journal.pone.0151061
- Taibi F, Metzinger-Le Meuth V, Massy ZA, Metzinger L. miR-223: An inflammatory oncomiR enters the cardiovascular field. Biochim Biophys Acta 2014; 1842:1001-9; PMID:24657505; http://dx.doi.org/10.1016/j.bbadis.2014.03.005
- Haneklaus M, Gerlic M, O'Neill LA, Masters SL. miR-223: infection, inflammation and cancer. J Intern Med 2013; 274:215-26; PMID:23772809; http://dx.doi.org/10.1111/joim.12099
- Chuang TY, Wu HL, Chen CC, Gamboa GM, Layman LC, Diamond MP, Azziz R, Chen YH. MicroRNA-223 expression is upregulated in insulin resistant human adipose tissue. J Diabetes Res 2015; 2015:943659; PMID:26273679; http://dx.doi.org/10.1155/2015/943659
- Zhuang G, Meng C, Guo X, Cheruku PS, Shi L, Xu H, Li H, Wang G, Evans AR, Safe S, et al. A novel regulator of macrophage activation: miR-223 in obesity-associated adipose tissue inflammation. Circulation 2012; 125:2892-903; PMID:22580331; http://dx.doi.org/10.1161/CIRCULATIONAHA.111.087817
- Vickers KC, Landstreet SR, Levin MG, Shoucri BM, Toth CL, Taylor RC, Palmisano BT, Tabet F, Cui HL, Rye KA, et al. MicroRNA-223 coordinates cholesterol homeostasis. Proc Natl Acad Sci U S A 2014; 111:14518-23; PMID:25246565; http://dx.doi.org/10.1073/pnas.1215767111
- Walldius G, Jungner I, Holme I, Aastveit AH, Kolar W, Steiner E. High apolipoprotein B, low apolipoprotein A-I, and improvement in the prediction of fatal myocardial infarction (AMORIS study): a prospective study. Lancet 2001; 358:2026-33; PMID:11755609; http://dx.doi.org/10.1016/S0140-6736(01)07098-2
- Palmer CS, DeHart M, Zhang X, Feilotter H, Lloyd AR, Zekry A. Hepatic microRNA 135a* regulates hepatic triglyceride storage and is repressed during HCV infection. Poster 844. The Liver Meeting 2010 (AASLD). John B. Boston, Massachusetts, USA: Hynes Convention Center, 2010.
- Martinez D. Obesity associated inflammatory mediators in chronic HCV infection and chronic liver disease. Medical Sciences, Australia: Faculty of Medicine: University of New South Wales, 2014:171.
- Master SR, Rader DJ. Beyond LDL cholesterol in assessing cardiovascular risk: apo B or LDL-P? Clin Chem 2013; 59:723-5; PMID:23487171; http://dx.doi.org/10.1373/clinchem.2013.203208
- Skeggs JW, Morton RE. LDL and HDL enriched in triglyceride promote abnormal cholesterol transport. J Lipid Res 2002; 43:1264-74; PMID:12177170
- Krogager TP, Nielsen LV, Kahveci D, Dyrlund TF, Scavenius C, Sanggaard KW, Enghild JJ. Hepatocytes respond differently to major dietary trans fatty acid isomers, elaidic acid and trans-vaccenic acid. Proteome Sci 2015; 13:31; PMID:26628894; http://dx.doi.org/10.1186/s12953-015-0084-3
- Gordis L. Epidemiology. Chapter 7: Assessing preventive and therapeutic measures: Randomized trials. 2013. 138-154.
- Bender R, Lange S. Adjusting for multiple testing–when and how? J Clin Epidemiol 2001; 54:343-9; PMID:11297884; http://dx.doi.org/10.1016/S0895-4356(00)00314-0
- Rudkowska I, Paradis AM, Thifault E, Julien P, Barbier O, Couture P, Lemieux S, Vohl MC. Differences in metabolomic and transcriptomic profiles between responders and non-responders to an n-3 polyunsaturated fatty acids (PUFAs) supplementation. Genes Nutr 2013; 8:411-23; PMID:23250786; http://dx.doi.org/10.1007/s12263-012-0328-0
- Lohmann TG, Roche AF, Martorell R. Anthropometric standardization reference manual. Champaign, Ill: Human Kinetics Books; 1988.
- Havel RJ, Eder HA, Bragdon JH. The distribution and chemical composition of ultracentrifugally separated lipoproteins in human serum. J Clin Invest 1955; 34:1345-53; PMID:13252080; http://dx.doi.org/10.1172/JCI103182
- Kirstein P, Carlson K. Determination of the cholesterol content of high density lipoprotein subfractions HDL2 and HDL3, without contamination of Lp(a), in human plasma. Clin Chim Acta 1981; 113:123-34; PMID:6454513; http://dx.doi.org/10.1016/0009-8981(81)90146-7
- Moorjani S, Dupont A, Labrie F, Lupien PJ, Brun D, Gagne C, Giguere M, Belanger A. Increase in plasma high-density lipoprotein concentration following complete androgen blockage in men with prostatic carcinoma. Metabolism 1987; 36:244-50; PMID:3102895; http://dx.doi.org/10.1016/0026-0495(87)90183-1
- Friedewald WT, Levy RI, Fredrickson DS. Estimation of the concentration of low-density lipoprotein cholesterol in plasma, without use of the preparative ultracentrifuge. Clin Chem 1972; 18:499-502; PMID:4337382
- van Deventer HE, Miller WG, Myers GL, Sakurabayashi I, Bachmann LM, Caudill SP, Dziekonski A, Edwards S, Kimberly MM, Korzun WJ, et al. Non-HDL cholesterol shows improved accuracy for cardiovascular risk score classification compared to direct or calculated LDL cholesterol in a dyslipidemic population. Clin Chem 2011; 57:490-501; PMID:21228254; http://dx.doi.org/10.1373/clinchem.2010.154773
- Laurell CB. Electroimmuno assay. Scand J Clin Lab Invest Suppl 1972; 124:21-37; PMID:4114358; http://dx.doi.org/10.3109/00365517209102748
- Hafiane A, Genest J. High density lipoproteins: Measurement techniques and potential biomarkers of cardiovascular risk. BBA Clin 2015; 3:175-88; PMID:26674734; http://dx.doi.org/10.1016/j.bbacli.2015.01.005
- Fainaru M, Glangeaud MC, Eisenberg S. Radioimmunoassay of human high density lipoprotein apo-protein A-1. Biochim Biophys Acta 1975; 386:432-43; PMID:166665; http://dx.doi.org/10.1016/0005-2795(75)90286-X
- Lai RC, Tan SS, Teh BJ, Sze SK, Arslan F, de Kleijn DP, Choo A, Lim SK. Proteolytic potential of the MSC exosome proteome: implications for an exosome-mediated delivery of therapeutic proteasome. Int J Proteomics 2012; 2012:971907; PMID:22852084; http://dx.doi.org/10.1155/2012/971907
- Sourvinou IS, Markou A, Lianidou ES. Quantification of circulating miRNAs in plasma: effect of preanalytical and analytical parameters on their isolation and stability. J Mol Diagn 2013; 15:827-34; PMID:23988620; http://dx.doi.org/10.1016/j.jmoldx.2013.07.005
- Chen C, Ridzon DA, Broomer AJ, Zhou Z, Lee DH, Nguyen JT, Barbisin M, Xu NL, Mahuvakar VR, Andersen MR, et al. Real-time quantification of microRNAs by stem-loop RT-PCR. Nucleic Acids Res 2005; 33:e179; PMID:16314309; http://dx.doi.org/10.1093/nar/gni178
- Kroh EM, Parkin RK, Mitchell PS, Tewari M. Analysis of circulating microRNA biomarkers in plasma and serum using quantitative reverse transcription-PCR (qRT-PCR). Methods 2010; 50:298-301; PMID:20146939; http://dx.doi.org/10.1016/j.ymeth.2010.01.032
- Schmittgen TD, Livak KJ. Analyzing real-time PCR data by the comparative C(T) method. Nat Protoc 2008; 3:1101-8; PMID:18546601; http://dx.doi.org/10.1038/nprot.2008.73
- Livak KJ, Schmittgen TD. Analysis of relative gene expression data using real-time quantitative PCR and the 2(-Delta Delta C(T)) Method. Methods 2001; 25:402-8; PMID:11846609; http://dx.doi.org/10.1006/meth.2001.1262
- SAS Institute Inc, ed. Base SAS® 9.2 procedures guide: statistical procedures. Cary, NC: SAS Institute Inc; 2010.
- El Harchaoui K, Arsenault BJ, Franssen R, Despres JP, Hovingh GK, Stroes ES, Otvos JD, Wareham NJ, Kastelein JJ, Khaw KT, et al. High-density lipoprotein particle size and concentration and coronary risk. Ann Intern Med 2009; 150:84-93; PMID:19153411; http://dx.doi.org/10.7326/0003-4819-150-2-200901200-00006