
ABSTRACT
Secreted frizzled related protein 3 (SFRP3) contains a cysteine-rich domain (CRD) that shares homology with Frizzled CRD and regulates WNT signaling. Independent studies showed epigenetic silencing of SFRP3 in melanoma and hepatocellular carcinoma. Moreover, a tumor suppressive function of SFRP3 was shown in androgen-independent prostate and gastric cancer cells. The current study is the first to investigate SFRP3 expression and its potential clinical impact on non-small cell lung carcinoma (NSCLC). WNT signaling components present on NSCLC subtypes were preliminary elucidated by expression data of The Cancer Genome Atlas (TCGA). We identified a distinct expression signature of relevant WNT signaling components that differ between adenocarcinoma (LUAD) and squamous cell carcinoma (LUSC). Of interest, canonical WNT signaling is predominant in LUAD samples and non-canonical WNT signaling is predominant in LUSC. In line, high SFRP3 expression resulted in beneficial clinical outcome for LUAD but not for LUSC patients. Furthermore, SFRP3 mRNA expression was significantly decreased in NSCLC tissue compared to normal lung samples. TCGA data verified the reduction of SFRP3 in LUAD and LUSC patients. Moreover, DNA hypermethylation of SFRP3 was evaluated in the TCGA methylation dataset resulting in epigenetic inactivation of SFRP3 expression in LUAD, but not in LUSC, and was validated by pyrosequencing of our NSCLC tissue cohort and in vitro demethylation experiments. Immunohistochemistry confirmed SFRP3 protein downregulation in primary NSCLC and indicated abundant expression in normal lung tissue. Two adenocarcinoma gain-of-function models were used to analyze the functional impact of SFRP3 on cell proliferation and regulation of CyclinD1 expression in vitro. Our results indicate that SFRP3 acts as a novel putative tumor suppressor gene in adenocarcinoma of the lung possibly regulating canonical WNT signaling.
Introduction
Lung cancer is the leading cause of cancer-related mortality worldwide, accounting for over a million deaths each year [Citation1]. The 5-year survival rate of metastasized lung tumors is below 15% [Citation2]. Bronchial carcinomas are divided into two major histological subtypes: non-small cell lung cancer (NSCLC) and small cell lung cancers (SCLC). NSCLC represents the most common subtype with 75–80% of all lung cancers, and is divided into three histological types: adenocarcinoma (LUAD), squamous cell carcinoma (LUSC), and large cell carcinoma [Citation3]. Due to their high impact on lung cancer mortality, a better understanding of biological and molecular processes in LUAD and LUSC, together representing 60–70% of all lung cancer cases [Citation3], is mandatory to improve lung cancer survival.
To date, several independent studies have shown the important role of WNT signaling in tumorigenesis of different cancer types [Citation4,Citation5], including lung carcinogenesis [Citation6–Citation10]. WNT signaling is subdivided into the canonical pathway determining ß-catenin stability and influencing the transcription of TCF/LEF target genes [Citation11] and the non-canonical pathway, which is independent of ß-catenin and controls mainly cell movements during morphogenesis [Citation12,Citation13]. Recent studies have implicated disruption of upstream WNT components promoting lung cancer progression, for example, wingless-related MMTV integration site 1 (WNT1) [Citation14,Citation15]. WNT signaling is regulated by several extracellular antagonists, including the secreted Frizzed-related protein (SFRP) family members, which directly bind to WNT ligands altering their ability to interact with WNT receptors [Citation16].
SFRP3/FrzB was first purified as a chondrogenic factor during morphogenesis of bones [Citation17] and contains a cysteine-rich domain (CRD) that is characteristic for SFRP members sharing homology with Frizzled CRD regulating WNT signaling [Citation16]. The biological function of SFRP3 was first illustrated by binding to Xenopus XWnt8 and modulation of ventral signaling in developing dorsal tissue [Citation18,Citation19]. SFRP3 mediated inhibition of Wnt1 induced accumulation of ß-catenin in cultured human embryonic kidney cells due to its frizzled domain [Citation20]. Furthermore, SFRP3 antagonized Wnt9a signaling and inhibited the canonical WNT pathway [Citation21]. It has been shown that loss of SFRP3 expression in hepatocellular carcinoma was associated with DNA hypermethylation within the exon1 region of the SFRP3 gene [Citation22]. Moreover, SFRP3 functional role during tumorigenesis was clarified by mediation of suppression of tumor growth, cell invasion, and colony formation of PC-3 androgen-independent prostate cancer cells [Citation23] and of gastric cancer cells (SGC-7901) [Citation24]. However, SFRP3 function and its clinical impact in NSCLC remain unknown.
In the present study, we identified a divergent expression pattern of WNT components in LUAD and LUSC patient samples. Interestingly, the phylogenetically closely related proteins SFRP1 and 2 [Citation25] were highly expressed in LUSC, while SFRP3 and 4 [Citation25] were predominantly expressed in LUAD tissue samples. The impact of SFRP1 and 2 in lung cancer progression has already been investigated, but the role of SFRP3 and 4 has not been elucidated yet. We deciphered a deregulated expression pattern of SFRP3 in primary NSCLC tissue samples. Moreover, the unfavorable outcome after epigenetic silencing of SFRP3 exon 1 in lung adenocarcinoma patients suggested a potential tumor suppressive function and clinical impact for SFRP3. In vitro models also support a tumor suppressor role for SFRP3, which potentially antagonizes active canonical WNT signaling via WNT1, likely via SFRP3/WNT1 interaction in adenocarcinoma of the lung.
Material and methods
Cryopreserved patient samples
SFRP3 mRNA expression and DNA methylation analysis were investigated using a cryo-tissue cohort of patients with primary NSCLC (n = 11), as well as adjacent normal tissue (n = 11), from the RWTH centralized biomaterial bank (RWTH cBMB; http://www.cbmb.rwth-aachen.de). All patients gave informed consent for collection and analysis of their tissue specimens for research purposes (local ethical review board of the medical faculty of the RWTH Aachen, ref no. EK-206/09). Hematoxylin and eosin-stained sections were prepared for assessment of the percentage of tumor cells and only samples with >80% tumor cells were selected. An overview of the clinical characteristics of the patients is summarized in Supplementary Table 2.
External validation in TCGA datasets
Data from primary NSCLC tissues, including LUAD and LUSC, and normal lung tissues were used from The Cancer Genome Atlas (TCGA), comprising patients data of two independent datasets: Illumina Infinium DNA methylation (HumanMethylation450 array) and IlluminaHiSeq mRNA expression (LUAD: n = 518, LUSC: n = 499). An overview of the clinical characteristics of the patients is summarized in Supplementary Table 4. In addition, data of the Kaplan Meier-Plotter portal was used to analyze a possible prognostic influence of abundant SFRP3 mRNA expression in LUAD and LUSC patients [Citation26].
TCGA cluster analysis
Expression datasets of primary LUAD and LUSC from the TCGA database were used to analyze expression of WNT pathway genes. Normalized expression values were log2-transformed to reduce skewness. For visualization, expression data were centered at the mean. Hierarchical clustering of genes was performed using Manhattan distance and Ward´s method. For cluster analysis of samples, the Minkowski distance was calculated based on centered and scaled expression of the selected genes. The parameter p (p = 1.1) of Minkowski distance metric was adjusted by supervised methods to maximize the discrimination of LUAD and LUSC samples.
Cell lines and reagents
The human adenocarcinoma cell lines A549 and SK-LU-1 were obtained, tested, and authenticated from Cell Lines Service (Eppelheim, Germany). The human bronchial epithelial cell line BEAS-2B was kindly provided by Prof. Andreas Ludwig (Institute of Pharmacology and Toxicology at the Universal Hospital Aachen, Germany), the adenocarcinoma cell line H23 and the squamous cell carcinoma cell lines H157, H1299, and H2170 were kindly provided by Prof. Dr. Iver Petersen (Institute of Pathology at the Universal Hospital Jena, Germany). All cell lines were regularly tested for mycoplasma infection using the PCR-based Venor® GeM Mycoplasma Detection Kit (Minerva Biolabs, Berlin, Germany).
Nucleic acid extraction and reverse transcription PCR
Genomic DNA from cryopreserved NSCLC and normal lung tissue samples was isolated using the QIAamp DNA Mini Kit (Qiagen, Hilden, Germany), according to the manufacturer's instructions. Total cellular RNA from cell culture and tissue specimen was prepared using TRIzol reagent (Invitrogen, Darmstadt, Germany). cDNA was synthesized using the reverse transcription system (Promega, Madison, WI), as previously described [Citation27].
Semiquantitative real-time PCR
cDNAs were amplified by semiquantitative real-time PCR using SYBR-Green PCR mix (Bio-Rad Laboratories, Munich, Germany) performed in iCycler IQ5 (Bio-Rad Laboratories). Gene expression was quantified by the comparative ΔΔCT method, normalizing CT-values to the housekeeping gene GAPDH and calculating relative expression values [Citation28]. All primers spanned at least one intron, SFRP3: Forward 5′-ACGGGACACTGTCAACCTCT-3′, Reverse 5′-CGATCCTTCCACTTCTCAGC-3′; CCND1: Forward 5′-ATCAAGTGTGACCCGGACT-3′, Reverse 5′-CCTCCTCTTCCTCCTCCTC-3′. All reactions were performed in triplicate.
DNA bisulfite modification
Extracted tissue DNA was bisulfite-converted using the EZ DNA methylation kit (Zymo Research, Orange, CA, USA) as previously described [Citation29].
AZA/TSA treatment
Demethylating treatment of the lung cancer cell lines A549 and H157 was performed as previously described [Citation30].
Pyrosequencing
Pyrosequencing analysis of a distinct SFRP3 promoter and exon 1 region was performed using the PyroMark PCR Kit (Qiagen) for initial fragment amplification. Afterwards, the PyroMark96 ID device and the PyroGoldSQA reagent Kit (Qiagen) were implemented, as previously described [Citation31]. The SFRP3 assays were designed by using the Pyromark Assay Design Software (Qiagen). SFRP3 promoter: Biotinylated-Forward 5′-GTAGGTATTGGAGGGTAGAGATTGTTTTAGGGG-3′; Reverse 5′-ACCACTACCACCCTAACTAACAAAAAAAA-3′; Sequencing 5′-CCCTAACTAACAAAAAAAAC3-′; SFRP3 exon1: Forward 5′-AGTTTGATGTTTTTGTTAGAGGGAGAGGAATAA-3′; Biotinylated-Reverse 5′-TCCTTAAATCAAATTCCCCCAATAAAATCC-3′; Sequencing 5′-AAATAGATGTTGTTGTTT-3′.
SFRP3 Immunohistochemistry
The cohort contained 27 lung normal and 24 lung cancer tissue samples, including LUSC (n = 10) and LUAD (n = 14) (Supplementary Table 3). Immunohistochemical analysis was performed according to manufacturer's instructions (DAKO 5001; DAKO, Glostrup, Denmark). FFPE sections (4 μm) were incubated for 60 min with a polyclonal SFRP3 rabbit anti-human antibody (1:75) (PorteinTech, # 12884-1-AP). Non-cancerous prostate tissue served as negative control. SFRP3 protein staining was quantified by a pathologist using an adapted immunoreactive scoring system [IRS = staining intensity (SI) × percent positive (PP)], according to Remmele and Stegner [Citation32].
Plasmid construction
Plasmids containing the human full-length SFRP3 cDNA fragment (#IOHx11489) was purchased from Source BioScience (Nottingham, United Kingdom). This clone (pT-Rex-DEST30-SFRP3) expresses the complete SFRP3 open reading frame.
Transient transfection and stable clone establishment
All transfections were performed using FuGene HD Transfection Reagent (Roche, Mannheim, Germany), following the manufacturer's guidelines. A549 and H157 cells were stably transfected with pT-Rex-DEST30 (Source Bioscience Invitrogen, Nottingham, UK), encoding human SFRP3, and empty vector. Selected stable A549 and H157 clones were maintained in complete culture medium containing 100 µg/mL geneticin. SK-LU-1 cells were transiently transfected with SFRP3 containing pT-Rex-Dest30 and empty vector control. Moreover, A549 cells were transiently transfected with a full-length cDNA of WNT1 or empty pcDNA3.1-HIS vector control (Invitrogen, Carlsbad, CA, USA).
Immunofluorescence staining
Stable transfected SFRP3-expressing A549 cells as well as mock cells were validated by immunofluorescence. Immunofluorescence analysis was performed according to manufacturer´s instruction (Double immunofluorescence-simultaneous protocol, DAKO, Glostrup, Denmark). Cells (1 × 10⁴) were seeded into a black 96-well culture plate and cultured overnight at 37°C. Cells were fixed with 4% paraformaldehyde and incubated for 15 min. SFRP3-expressing cells and mock cells were incubated for 60 min with polyclonal SFRP3 rabbit anti-human antibody (dilution 1:125; PorteinTech, # 12884-1-AP) diluted with antibody diluent (DAKO, Glostrupt, Denmark). Secondary FITC-conjugated anti-rabbit antibody was diluted 1:500 in 1% BSA-PBST (0.1% v/v Tween-20) and incubated for 1 h. Fluorescence signals were detected using an Olympus CKX41 microscope with XM10 monochrome camera (Olympus, Tokyo, Japan) at x100 magnification and exposure time of 1 s.
Cell proliferation assay
Cell proliferation was measured by XTT cell proliferation kit II from Roche (Mannheim, Germany) using 1 × 10³ cells and 100 µl of complete culture medium. Proliferation was determined at four different time points: 24, 48, 72, and 96 h after incubation. Finally, the absorbance was measured at 492 nm.
Statistical analysis
Statistical analysis was performed using SPSS 22.0 (SPSS, Chicago, IL) and GraphPad Prism 5.0 (GraphPad Software Inc., La Jolla, CA). The cluster analysis was done in R 3.2.2 (R Foundation, Vienna, Austria). The non-parametric Mann-Whitney U-test was used in order to compare SFRP3 mRNA expression between tumor and normal lung tissue. Differences were considered statistically significant if the two sided P-values were equal or below 5% (≤ 0.05).
Correlation of SFRP3 mRNA expression (TCGA Illumina sequencing platform) and SFRP3 methylation data (TCGA HM450 platform) was calculated using Spearman correlation coefficient. Recurrence-free survival (RFS) was measured as the time from surgery to local or distant relapse and was censored for live patients without evidence of relapse at the last follow-up.
Multivariate Cox regression analysis was carried out to test for an independent prognostic value of SFRP3 expression. Selection of the prognostic factors to be included in the multivariate model was based on the statistical significance in univariate log-rank tests.
Results
Subtype specific expression profile of WNT signaling components in NSCLC samples
The functional role of many WNT antagonists in controlling WNT signaling in NSCLC, especially distinct NSCLC subtypes, is not completely understood. Therefore, we initially analyzed the expression profile of the assumed most important components of the WNT superfamily, i.e., eight canonical WNT ligands, seven non-canonical WNT ligands, 10 Frizzled receptors, and five WNT antagonists (SFRP family) [Citation33,Citation34] in primary NSCLC samples, using The Cancer Genome Atlas (TCGA) platform ((A) and Supplementary Table 1). The heat map analysis depicts increased expression (shown in red bars) of canonical WNT signaling components (WNT2, WNT8B, WNT10A) in LUAD, whereas the expression of non-canonical WNT signaling components (WNT5A, WNT7B, WNT11) is elevated in LUSC ((A) and Supplementary Table 1). Indeed, box plot analysis of two representative WNT ligands and antagonists demonstrated higher expression levels of canonical WNT ligands (WNT1 and WNT2) in LUAD compared to LUSC. In contrast, the non-canonical WNT ligands WNT5A and WNT7B showed higher expression levels in LUSC. Of interest, we found that phylogenetically related WNT antagonists, such as SFRP1 and SFRP2, are predominantly expressed in the LUSC subtype, while the more related SFRP3 and SFRP4 are abundantly expressed in LUAD tumors. Hence, we identified a differential WNT signaling expression profile in primary NSCLC ((B) and (C)), indicating a distinct role of those WNT components that depend on a given subtype. Additional expression analysis of representative canonical WNT target genes CCND1, MET, andAxin2, as well as the key regulator CTNNB1, supported our hypothesis of a predominantly active canonical WNT signaling pathway in adenocarcinoma of the lung ((D)).
Figure 1. Expression profile of WNT signaling components in adenocarcinoma and squamous cell carcinoma samples. (A-C) Heat map based on the TCGA IlluminaHiSeq mRNA expression platform illustrating the expression signature of WNT pathway genes, including tumor suppressor genes of the SFRP family, membrane receptors of the FZD family, and receptor ligands of the WNT family, clustered into adenocarcinoma subtype (top panel: dark grey) and squamous cell carcinoma subtype (top panel: light grey). Each row represents a specific gene and each column represents a patient sample. The color of each cell indicates the expression value of each gene in that sample: blue (low expression); red (high expression). (D) Box plot analysis of canonical WNT-target gene expression (CCND1, Met, Axin2, CTNNB1) in NSCLC samples subdivided into LUAD and LUSC showing increased canonical target gene expression in primary LUAD samples. Horizontal lines: grouped medians. Boxes: 25–75% quartiles. Vertical lines: range, peak, and minimum. ***P < 0.001. (E) and (F) Representative cartoons of the underlying WNT signaling pathway in LUAD and LUSC based on the expression profile of WNT components and canonical target genes. While a predominant role of canonical WNT signaling might be assumed in LUAD, LUSC were not clearly associated with neither canonical nor non-canonical WNT pathway.
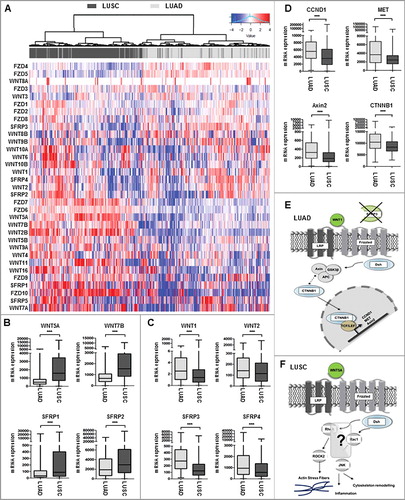
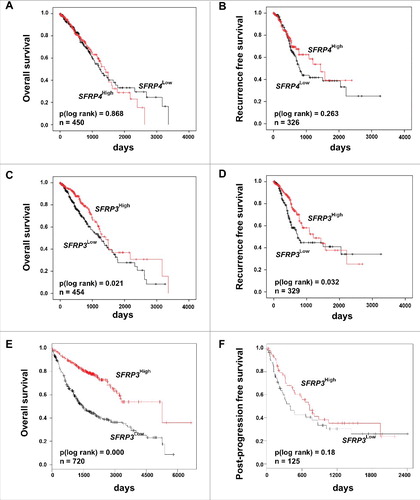
A differential subtype-specific WNT gene signature in LUAD and LUSC demonstrated the predominance of canonical WNT signaling in LUAD and the potential importance of non-canonical WNT signaling in LUSC ((E) and (F)). Canonical WNT signaling represents the best studied WNT pathway that is a key player in the regulation of cell proliferation. In this context, we investigated the potential prognostic impact of the phylogenetic related proteins SFRP3 and 4 in adenocarcinoma patients. Univariate Kaplan Meier survival analysis based on the TCGA lung cancer dataset—consisting of 1124 patient samples—showed no prognostic benefit for patients based on SFRP4-expression, as indicated by overall survival (OS) and recurrence-free survival (RFS) ((A) and (B)). However, abundant SFRP3 mRNA expression predicted favorable clinical OS (P = 0.021) and RFS (P = 0.032) for adenocarcinoma patients ((C) and (D)), but not for squamous cell carcinoma patients (Supplementary Figure 2.). Patients with late tumor stage adenocarcinoma (pT2-4) benefit from high SFRP3 expression (Supplementary Figure 1). Next, we calculated a multivariate Cox regression model, including all factors potentially influencing the OS in NSCLC, but statistical independency was not reached (P = 0.173) (Supplementary Table 7). The independent Kaplan Meier Plotter platform validated our finding of a significantly better clinical outcome for adenocarcinoma patients with high SFRP3 expression, but not for squamous cell carcinoma patients ((E) and (F)).
Figure 2. Univariate Kaplan-Meier survival analysis of SFRP3 mRNA expression suggesting a favorable OS and RFS in adenocarcinoma patients. (A) and (B) Kaplan-Meier survival analysis based on the TCGA human lung dataset exhibiting no significantly improved clinical overall survival (OS) and recurrence free survival (RFS) in adenocarcinoma patients with higher SFRP4 mRNA expression. (C) and (D) Abundant SFRP3 mRNA expression promotes a significantly improved OS and RFS for adenocarcinoma patients. Red line: higher SFRP3 mRNA expression (median > 272.11); black line: moderate SFRP3 expression (median ≤ 272.11). Vertical lines: censored cases. (E) and (F) Univariate survival analysis based on the Kaplan-Meier-Plotter software supporting improved OS for adenocarcinoma patients with high SFRP3 mRNA expression but no prognostic impact for post-progression free survival (cutoff value > 530).
Downregulation of SFRP3 mRNA expression in primary NSCLC tissue
To decipher the possible tumor suppressive role of SFRP3 in lung cancer we analyzed mRNA expression in a cryopreserved lung tissue cohort consisting of 11 NSCLC tumor and 11 normal tissues. We demonstrated a significant (P < 0.01) reduction of SFRP3 gene expression in tumor tissues (median expression level: 0.275) compared to normal lung tissues (median expression level: 1.00) ((A) and (B)). To verify our data, we analyzed SFRP3 gene expression in a large independent dataset from the TCGA IlluminaHiSeq platform (n = 1124) and determined a comparable significant loss of SFRP3 mRNA in primary tumor tissues (P < 0.001) ((C)).
Figure 3. SFRP3 mRNA expression is lost in primary squamous cell carcinoma and reduced in advanced adenocarcinoma tissue samples. (A) SFRP3 mRNA expression is strongly reduced in NSCLC tissue samples (n = 11, median 0.275) in comparison to normal lung tissue (n = 11, median 1.00). (B) Scatter plot analysis represents reduced SFRP3 mRNA expression in primary lung tumor compared to normal lung tissue. Horizontal lines: grouped mean value. Vertical lines: SEM. **P < 0.01. (C) Box plot analysis based on the TCGA IlluminaHiSeq mRNA dataset showing reduced SFRP3 mRNA expression in primary lung tumor compared to normal lung tissue. Horizontal lines: grouped mean value. Vertical lines: SEM. ***P < 0.001. (D) and (E) SFRP3 mRNA expression is strongly reduced in squamous cell carcinoma and slightly reduced in adenocarcinoma compared with normal lung tissue. Tumor samples (based on TCGA IlluminaHiSeq) are split into adenocarcinoma (dark green, n = 518), squamous cell carcinoma (light green, n = 498), and normal tissue samples (gray, n = 205) (left panel). The relative SFRP3 mRNA expression values are illustrated in red (high expression) and green (low expression). (F) Box plot analysis of SFRP3 mRNA expression in adenocarcinoma subdivided into pT status shows decreased SFRP3 gene expression in pT2-4 compared to pT1. Horizontal lines: grouped medians. Boxes: 25–75% quartiles. Vertical lines: range, peak, and minimum. ***P < 0.001. (G) Box plot analysis shows decreased SFRP3 mRNA expression in metastatic adenocarcinoma tissue samples compared to non-metastatic adenocarcinoma tissues. Horizontal lines: grouped medians. Boxes: 25–75% quartiles. Vertical lines: range, peak, and minimum. *P < 0.05 (H) Box plot analysis illustrates reduced expression of SFRP3 in stage II and stage IV adenocarcinoma tissue samples compared with stage I. Horizontal lines: grouped medians. Boxes: 25–75% quartiles. Vertical lines: range, peak, and minimum. *P < 0.05
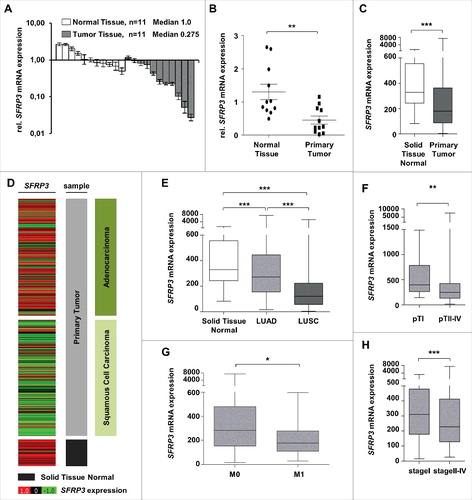
Next, we focused on tumor subtype-specific SFRP3 expression profile based on the TCGA dataset and showed prevalent loss of SFRP3 mRNA expression in LUSC (median expression level: 120.9) and slight reduction in LUAD (median expression level: 272.1), compared to normal lung tissue samples (median expression level: 329.5) ((D) and (E)). Furthermore, we revealed a continuous downregulation of SFRP3 mRNA expression in the course of tumorigenesis. Adenocarcinomas, stratified into earlier and late tumor stages, showed significant reduction of SFRP3 gene expression in patients with late tumor stage ((F), (G) and (H)).
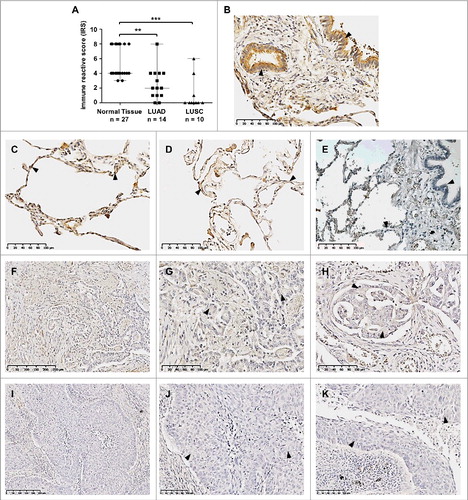
Given that SFRP3 mRNA expression is lost in LUSC and reduced in LUAD, we verified SFRP3 protein expression in normal lung tissue and lung tumor tissue samples using immunohistochemistry. For this reason, we established a tissue cohort consisting of 27 normal lung, 14 adenocarcinoma, and 10 squamous cell carcinoma samples. We observed highly significant reduction of SFRP3 protein in adenocarcinoma tissues (IRS median: 2) ((F), (G) and (H)) compared to normal lung samples (IRS median: 4) ((A) to (D)). In line with our expression data, we observed loss of SFRP3 protein expression in squamous cell carcinoma tissue samples (median IRS: 0) ((I) to (K)). SFRP3 protein was found in the cytoplasm of type I and type II pneumocytes of alveolar walls ((C) and (D)), as well as in ciliated epithelium of the bronchus ((B)).
Figure 4. Loss of SFRP3 protein expression in human squamous cell carcinoma and adenocarcinoma of the lung. (A) Scatter plot analysis represents reduced SFRP3 immunoreactivity in primary LUAD samples (median: 2) and loss of SFRP3 protein in LUSC tissue (median: 0) compared to normal lung tissue (median: 4). Horizontal lines: median value. Vertical lines: probe ranges. **P < 0.01 ***P < 0.001 (B) Clear positive immunoreactivity in ciliated bronchial epithelium. (C and D) Strong SFRP3 protein staining in normal lung tissue, especially in type I and II pneumocytes of alveolar walls. (E) Negative control of normal lung tissue. Primary antibody was omitted. (F to H) Low SFRP3 immunoreactivity in the cytoplasm of advanced adenocarcinoma of the lung, indicating an IRS of 2 (F and G) and an IRS of 4 (H). (I to K) Loss of SFRP3 staining in the cytoplasm of primary squamous cell carcinoma samples, IRS of 0.
Epigenetic inactivation of SFRP3 in adenocarcinoma but not in squamous cell carcinoma
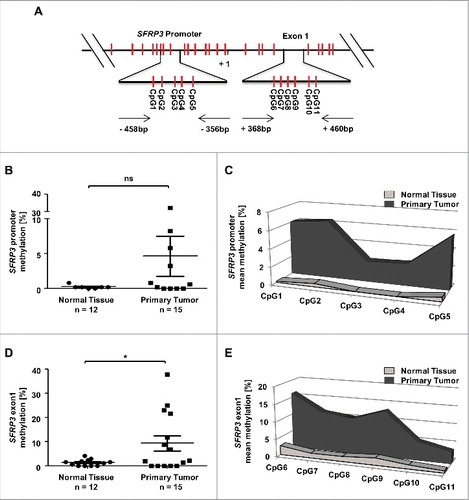
In order to analyze the functional mechanism of SFRP3 downregulation in primary NSCLC, we performed in silico methylation analysis based on the TCGA Illumina HumanMethylation450 dataset (n = 907). We analyzed the methylation status of CpG sites located upstream and downstream SFRP3 transcription start site ((A)). Based on this dataset, we analyzed two possible regulatory regions in SFRP3 ((A) and (A)). Increased methylation of SFRP3 exon1 has been observed by Ekström et al. and Lin et al [Citation22,Citation35]. We additionally analyzed the promoter, which contains putative transcription factor binding sites. Box plot analysis based on mean methylation value of all CpG indicated a significant increase (P < 0.0001) of SFRP3 methylation in LUAD (median relative methylation: 0.37), as well as in LUSC tissues (median relative methylation: 0.32) compared with normal tissue (median relative methylation: 0.12) ((B)). Correlation analysis based on TCGA data of SFRP3 methylation and expression showed a highly significant inverse correlation between SFRP3 hypermethylation and mRNA expression in LUAD samples (P < 0.0001; Spearman r = −0.3084), but not in LUSC tissue samples (P = 0.8887; Spearman r = −0.0074). To further validate our findings, we examined both regions by pyrosequencing of an independent cryopreserved cohort, consisting of 12 normal lung and 15 NSCLC tissue samples. Scatter plot analysis and area diagram show a significant increase (P < 0.05) of mean SFRP3 methylation in the exon1 region in primary NSCLC tissue (mean methylation value: 7.6%) compared to normal tissue (mean methylation: 1.3%), but not in the SFRP3 promoter in primary NSCLC tissue (mean methylation value: 4.6%) compared to normal tissue samples (mean methylation value: 0.2%) ((B) to (E)).
Figure 5. Reduction of SFRP3 mRNA expression highly correlates with epigenetic inactivation in adenocarcinoma but not in squamous cell carcinoma. (A) and (B) DNA hypermethylation of the SFRP3 promoter analyzed in primary tumor and normal tissue samples based on data of the TCGA Illumina HumanMethylation450 platform. Patient samples are split into adenocarcinoma (dark green, n = 446), squamous cell carcinoma (light green, n = 357), and normal tissue samples (gray, n = 104). The relative SFRP3 DNA methylation values for each CpG are illustrated in red (high methylation), white (mean methylation), and blue (low methylation). SFRP3 hypermethylation is strongly increased in adenocarcinoma and squamous cell carcinoma samples compared to normal lung tissue. Horizontal lines: grouped medians. Boxes: 25–75% quartiles. Vertical lines: range, peak, and minimum, ***P < 0.001. (C) and (D) Correlation analyses demonstrate a highly significant inverse correlation between SFRP3 mRNA expression (TCGA IlluminaHiSeq mRNA expression platform) and DNA hypermethylation (TCGA Illumina HumanMethylation450 platform) in primary adenocarcinoma samples (n = 424; Spearman r = −0.3084; P < 0.0001) but not in squamous cell carcinoma samples (n = 355; Spearman r = −0.0074; P = 0.8887).
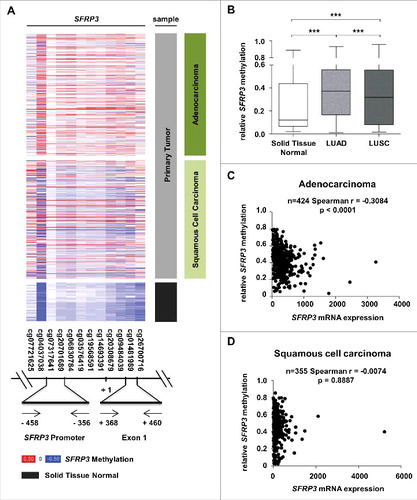
Figure 6. Methylation analysis of the SFRP3 gene showing hypermethylation of exon1 in NSCLC tissue samples. (A) Schematic image showing the location of 12 analyzed CpG duplets and positions of primer sets (-458 to -356 bp and +368 to +460 bp; 5′ to 3′) for SFRP3 promoter and exon1. +1: SFRP3 transcription start site. (B) to (E) Pyrosequencing analysis of primary tumor tissues (n = 15) and normal tissues (n = 12) demonstrates a significant increase of methylation in SFRP3 exon1 but not in SFRP3 promoter. Scatter plots illustrate mean methylation of each tissue sample analyzed for promoter and exon1. Area charts visualize mean methylation for each CpG of normal tissue and primary tumor tissue. Horizontal lines: grouped mean value. Vertical lines: SEM. ☆P < 0.05
In order to show whether SFRP3 mRNA expression loss is functionally linked to exon1 hypermethylation in adenocarcinoma ((D), Supplementary Figure 3) we performed in vitro demethylation studies in two adenocarcinoma cell lines, A549 and SK-LU-1, which lack endogenous SFRP3 expression. Significant levels of SFRP3 mRNA could be restored after 5-aza-2´deoxycytidine (DAC) and trichostatin A (TSA) treatment in both cell lines ((A) and (D)). Pyrosequencing analysis further demonstrated significantly reduced methylation levels after DAC and DAC/TSA treatment, compared to untreated controls in both cell lines. In detail, A549 cell line showed methylation reduction by approximately 35% after DAC and DAC/TSA treatment ((B) and (C)), while SK-LU-I showed decreased DNA methylation (by 30%) after DAC and DAC/TSA treatment ((E) and (F)).
Figure 7. SFRP3 mRNA re-expression after in vitro demethylation of adenocarcinoma cell lines A549 and SK-LU-I. (A) Semiquantitative real-time PCR showing SFRP3 mRNA expression without and after treatment with 5-aza-2’-deoxycytidine (DAC) and Trichostatin A (TSA) in the adenocarcinoma cell line A549. Increased SFRP3 mRNA expression is shown as fold-change relative to untreated A549 control cells. (B) and (C) Quantitative SFRP3 exon1 methylation was analyzed by pyrosequencing of six CpG duplets in A549 cells without and after DAC and TSA treatment. Area charts visualize mean methylation for each CpG of untreated, DAC, TSA, and DAC/TSA treated cells. (D) Semi quantitative real-time PCR showing SFRP3 mRNA expression without and after treatment with DAC and TSA in the adenocarcinoma cell line SK-LU-1. Increased SFRP3 mRNA expression is demonstrated as fold-change relative to untreated control cells. (E) and (F) Quantitative SFRP3 exon1 methylation was analyzed by pyrosequencing of six CpG duplets in SK-LU-1 cells without and after treatment with DAC and TSA. Area charts visualize mean methylation for each CpG relative to the respective treatment of SK-LU-1 cells.
SFRP3 reduces cell proliferation and decreases CyclinD1 mRNA expression in a WNT1 depend manner
Our data suggested that loss of SFRP3 expression and DNA hypermethylation were functionally linked. Therefore, we hypothesized that SFRP3 is a novel putative tumor suppressor gene in LUAD. In order to decipher its biological role, we established stable and transient gain-of-function in vitro models based on adenocarcinoma cell lines A549 and SK-LU-1, as well as squamous carcinoma cell line H157 (Supplementary Figure 4–6). We performed in vitro XTT-proliferation assay in stably transfected SFRP3-expressing A549 and H157 cells ((A), Supplementary Figure 6B) and transiently transfected SFRP3-expressing SK-LU-1 cells ((B)). Proliferation analysis of NSCLC cell lines after 96 h incubation revealed no significant difference between SFRP3-expressing clones and non-transfected cells ((A) and (B); Supplementary Figure 6B).
Figure 8. Increased SFRP3 mRNA expression reduced cell proliferation and CyclinD1 mRNA expression in a WNT1 dependent manner. (A) Cell proliferation rate of SFRP3-expressing A549 single cell clones and mock cells was measured by XTT-assay at about four days. For each sample data were normalized to the absorption on day 0. (B) XTT-proliferation assay was performed about four days after transient SFRP3 mRNA expression in adenocarcinoma cell line SK-LU-1. For each sample, data were normalized to the absorption on day 0. (C) XTT-proliferation assay was performed after WNT signaling pathway induction via transient WNT1 transfection in SFRP3-expressing and mock A549 clones, additionally transiently transfected with empty vector control. Proliferation rate was measured after 96 h cultivation and normalized to absorption on day 0. (D) Semiquantitative real-time PCR after WNT1 induction showing loss of CCND1 mRNA expression in SFRP3 and WNT1 expressing cells. Decreased CCND1 mRNA expression is shown as fold-change normalized to empty vector-transfected (mock) A549 cells.
Bearing in mind that evidence for an assumed important role of canonical WNT-signaling pathway was found in LUAD (), for example, induced by the WNT1 ligand, we aimed to specifically activate the canonical WNT pathway in our gain-of-function models. As these in vitro models lack endogenous WNT1 expression (data not shown), we transfected our stable SFRP3-expressing A549 clones with mock and WNT1-containing vectors to induce canonical WNT signaling. Indeed, cell proliferation rates of doubly transfected SFRP3/WNT1-expressing A549 cells were significantly reduced in comparison to mock clones ((C)). As mentioned, canonical WNT signaling plays an important role in triggering cell proliferation. We deciphered the putative antagonistic impact of SFRP3 on canonical WNT signaling. Accordingly, we determined mRNA expression level of CyclinD1, a direct transcriptional canonical WNT target gene. mRNA expression analysis showed loss of CyclinD1 expression in WNT1/SFRP3 double transfected A549 cells in comparison to mock clones ((D)).
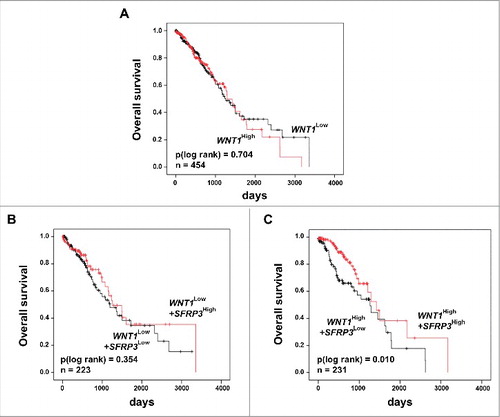
Previous studies showed a potential interaction between SFRP3 and WNT1 [Citation18–Citation20]. Our proliferation analysis suggested a putative modulation of active canonical WNT signaling by SFRP3 in a WNT1 dependent manner in vitro. To evaluate our in vitro findings, we analyzed the clinical relevance of SFRP3/WNT1 interaction. The potential antagonistic effect in adenocarcinoma patient samples was investigated by univariate Kaplan-Meier survival analysis of combined WNT1 and SFRP3 expression. While WNT1 alone has no prognostic impact on patients' OS ((A)), patients dichotomized into WNT1low/SFRP3low and WNT1low/SFRP3high showed no significant prognostic benefit for patients with higher SFRP3 mRNA expression ((B)). On the other hand, dichotomization into WNT1high/SFRP3low and WNT1high/SFRP3high showed highly significant benefit for adenocarcinoma patients' OS with combined high WNT1/SFRP3 mRNA expression ((C)).
Figure 9. Univariate Kaplan-Meier survival analysis of combined high SFRP3 and WNT1 mRNA expression indicated a favorable prognosis for adenocarcinoma patients. (A) Kaplan-Meier survival analysis based on the TCGA human lung dataset illustrates no prognostic value for the proto-oncogene WNT1. (B) Univariate Kaplan-Meier analysis of adenocarcinoma patients with low WNT1 mRNA expression shows no prognostic benefit provided by SFRP3 mRNA expression. (C) Univariate survival analysis reveals a better prognostic outcome for adenocarcinoma patients with high WNT1 and high SFRP3 mRNA expression. Patients were dichotomized by high WNT1 mRNA expression (median > 2.52) and low WNT1 expression (median ≤ 2.52). Red line: higher SFRP3 mRNA expression (median > 272.11); black line: moderate SFRP3 expression (median ≤ 272.11). Vertical lines: censored cases.
Discussion
To date, the functional role of many WNT antagonists in controlling WNT signaling in NSCLC subtypes is not known. Various studies have highlighted a potential role for WNT signaling in the promotion of tumorigenesis, especially for proliferation-inducing canonical WNT signaling [Citation6,Citation36]; however, the molecular background of WNT signaling components in the different lung cancer subtypes—LUAD and LUSC—remains unclear. For this reason, we initially evaluated the expression profile of important components of the WNT superfamily resulting in a divergent expression clustering of WNT signaling components for LUSC and LUAD. Interestingly, the WNT phylogenetically related antagonists SFRP3 and SFRP4 are highly expressed in adenocarcinoma samples, but only SFRP3 shows a potential prognostic impact in OS and RFS of adenocarcinoma patients. Up to now, the biological and prognostic impact of SFRP3 in human NSCLC, especially in LUAD, was not examined.
Several studies have described the role of SFRP3 in physiological processes such as bone formation and tumor development and progression of different tumor entities. Nevertheless, distinct functions for SFRP3 in tumorigenesis are still controversially discussed. Hirata et al. described a potential tumor promoting role for SFRP3, which increased colony formation and cell invasion in vitro, as well as tumor growth and tube formation in vivo [Citation37]. On the other hand, there is evidence that SFRP3 acts as tumor suppressor, for instance, in hepatocellular carcinoma, where SFRP3 downregulation is caused by CpG hypermethylation of exon1 [Citation22]. Furthermore, SFRP3 decreases tumor growth and cell invasion and suppresses colony formation of prostate cancer cells (PC-3) and gastric cancer cells (SGC-7901) via the inhibition of ß-catenin-dependent WNT signaling by activation of GSK-3ß and reduction of cytosolic ß-catenin and TCF activity [Citation23,Citation24].
In agreement with the reduced SFRP3 mRNA expression in primary renal cell carcinoma and melanoma [Citation35,Citation37], we demonstrated significant SFRP3 mRNA reduction in primary NSCLC samples. TCGA data analysis corroborated our results indicating that SFRP3 expression is reduced during tumor progression, especially of adenocarcinoma. Furthermore, up to now, SFRP3 location was not investigated in human normal lung tissue and the loss of SFRP3 in primary NSCLC tissue at the protein level was not validated. Therefore, we verified SFRP3 reduction in primary NSCLC tissue samples by immunohistochemistry staining. We identified, for the first time, SFRP3 protein in the cytoplasm of type I and type II pneumocytes, as well as in the cytoplasm of ciliated epithelium of normal lung tissue. Hyperplasia of ciliated epithelium constitutes the source of LUSC, whereas alveolar hyperplasia promotes LUAD [Citation38]. Interestingly, complete absence of SFRP3 in LUSC tissue and decreased protein level in LUAD samples are in agreement with the TCGA expression dataset. We investigated the molecular mechanism of SFRP3 downregulation in LUAD and LUSC and found a highly significant inverse correlation between SFRP3 expression and methylation in LUAD, but not in LUSC, indicating that epigenetic silencing of SFRP3 could be the leading molecular mechanism in LUAD, while in LUSC a different regulatory mechanism may be more pivotal. In line, expression and methylation analysis of NSCLC cell lines indicated reduced SFRP3 mRNA expression due to hypermethylation in LUAD cell lines (A549, SK-LU-1, H23), while SFRP3 expression and methylation in LUSC cell lines suggested not to be thoroughly conformable (SK-MES, H157). Our results could be corroborated by studies of Lin et al. determining frequent SFRP3 exon1 hypermethylation in hepatocellular carcinoma [Citation22]. McRonald et al. also showed SFRP3 downregulation linked to hypermethylation, detected in a global methylation analysis of renal cell carcinomas [Citation39]. Increased SFRP3 methylation was additionally observed in medulloblastoma and invasive bladder cancer samples [Citation37,Citation40]. In vitro demethylation studies of two human LUAD cell lines verified our finding of epigenetic silencing in adenocarcinoma samples. Both cell lines revealed significant SFRP3 mRNA re-expression after in vitro gene demethylation, with reduction of SFRP3 exon1 methylation to nearly 40%. In this context, Ekström et al. evaluated SFRP3 exon1 methylation in melanoma cell lines and showed significant SFRP3 re-expression as a consequence of DAC treatment [Citation35].
Once we identified the mechanism of SFRP3 downregulation, we aimed to shed light on the biological impact of SFRP3 in NSLC. Proliferation analysis of stable and transiently SFRP3-transfected LUAD cell lines revealed no significant proliferation difference between mock and SFRP3-expressing clones. However, based on the putative impact of canonical WNT signaling in adenocarcinoma samples, we hypothesized reduced canonical WNT signaling activity in our LUAD cell lines. To this end, stable SFRP3-expressing cells were co-transfected with a WNT1-expressing plasmid. Basically, WNT1 is assigned to canonical WNT ligand molecules [Citation33,Citation34] whose expression is known to activate canonical WNT/ß-catenin signaling and initiate transcription of many WNT-target genes with TCF/LEF1 motif, such as cMyc and CyclinD1 [Citation41–Citation45]. Interestingly, stable SFRP3 and WNT1 co-expressing A549 cells showed significant decrease of cell proliferation. Accordingly, we investigated the mRNA expression of CyclinD1, as a canonical WNT-target gene with TCF/LEF1 motif, and found significant loss of CyclinD1 expression as well. In this context, SFRP3 probably inhibited upstream WNT-signaling by binding to WNT1 and blocking WNT1-frizzled receptor interaction. Furthermore, CyclinD1, as a direct WNT-target gene, regulates cell cycle and coordinates mitotic events [Citation46,Citation47]. Decreased CyclinD1 levels deregulate the cell cycle or guide cells to cell cycle arrest, which leads to reduced cell proliferation rates [Citation48].
In summary, our findings provide evidence that SFRP3 acts as a putative tumor suppressor gene in normal lung tissue. This is the first study that indicates a divergent expression profile of WNT components in LUAD compared to LUSC and suggests a putative tumor suppressive function for SFRP3, especially in adenocarcinoma of the lung. Furthermore, abundant SFRP3 expression might be a prognostic marker for adenocarcinoma patients, showing a significant prognostic benefit as indicated by the improvement in patients’ OS and RFS. Potentially, SFRP3 could act as a canonical WNT/ß-catenin antagonist and inhibitor of tumor proliferation. Further analysis of the role of SFRP3 in lung cancer progression, especially in adenocarcinoma of the lung, may help identify the underlying pathways in more detail and improve disease management.
Disclosure of potential conflicts of interest
No potential conflicts of interest were disclosed.
KEPI_A_1229730_supplementary_data.zip
Download Zip (6.5 MB)Acknowledgments
We thank Sonja von Serényi for excellent technical assistance.
Related Research Data
References
- Parkin DM, Bray FI, Devesa SS. Cancer burden in the year 2000. The global picture. Euro J Cancer. 2001;37(8):4–66. doi:10.1016/S0959-8049(01)00267-2.
- Minna JD. Neoplasms of the lung. In: Fauci AS, Braunwald E, Isselbacher KJ, et al., editors. Harrison's princiles of international medicine. New York: McGraw Hill; 1998. p. 552–562.
- Sekido Y, Kwun M, Minna JD. Progress in understanding the molecular pathogenesis of human lung cancer. Biophys Acta (BBA)-Rev Cancer. 1998;1378:F21–F59. doi:10.1016/S0304-419X(98)00010-9.
- Morin PJ. ß-Catenin signalling and cancer. Bio Essays. 1999;21:1021–1030. doi:10.1002/(SICI)1521-1878(199912)22:1%3c1021::AID-BIES6%3e3.0.CO;2-P. PMID:10580987
- Polakis P. Wnt signalling and cancer. Genes Development. 2000;14:1837–1851.
- Uematsu K, He B, You L, et al. Activation of the Wnt pathway in non-small cell lung cancer: evidence of dishevelled overexpression. Oncogene. 2003;22:7218–7221. doi:10.1038/sj.onc.1206817. PMID:14562050
- Sunaga N, Kohno T, Kolligs FT, et al. Constitutive activation of the Wnt signalling pathway by CTNNB1 (ß-Catenin) mutations in a subset of human lung adenocarcinoma. Genes, Chromosomes Cancer. 2001;20:316–321. doi:10.1002/1098-2264(2000)9999:9999%3c::AID-GCC1097%3e3.0.CO;2-9.
- Ueda M, Gemmill RM, West J, et al. Mutations of the β- and γ-catenin genes are uncommon in human lung, breast, kidney, cervical and ovarian carcinomas. British J Cancer. 2001;85:64–68. doi:10.1054/bjoc.2001.1863. PMID:11437403
- Hommura F, Furuuchi K, Yamazaki K, et al. Increased expression of ß-catenin predicts better prognosis in nonsmall cell lung carcinomas. Cancer. 2002;94:752–758. doi:10.1002/cncr.10213. PMID:11857309
- Winn RA, Bremnes RM, Bemis L, et al. Gamma-catenin expression is reduced or absent in a subset of human lung cancers and re-expression inhibits transformed cell growth. Oncogene. 2002;21(49):7497–7506. doi:10.1038/sj.onc.1205963. PMID:12386812
- Cleves H. Wnt/ß-Catenin signalling in development and disease. Cell. 2006;127:469–480. doi:10.1016/j.cell.2006.10.018. PMID:17081971
- Katoh M. WNT/PCP signalling pathway and human cancer. Oncol Rep. 2005;1583–1588. PMID:16273260
- Veeman MT, Axelrod JD, Moon RT. A second canon: functions and mechanisms of ß-catenin-independent Wnt signalling. Development Cell. 2003;5:367–377. doi:10.1016/S1534-5807(03)00266-1. PMID:12967557
- He B, You L, Uematsu K, et al. A monoclonal antibody against Wnt-1 induces apoptosis in human cancer cells. Neoplasia. 2004;6:7–14. doi:10.1016/S1476-5586(04)80048-4. PMID:15068666
- You L, He B, Uematsu K, et al. Inhibition of Wnt-1 signalling induces apoptosis in ß-catenin-deficient mesothelioma cells. Cancer Res. 2004;64:3474–3478. doi:10.1158/0008-5472.CAN-04-0115. PMID:15150100
- Kawano Y, Kypta R. Secretad antagonists of the Wnt signalling pathway. J Cell Sci. 2003;116:2627–2634. doi:10.1242/jcs.00623. PMID:12775774
- Hoang B, Moos M, Vukicevic S, et al. Primary structure and tissue distribution of FRZB, a novel protein related to Drosophila Frizzled, suggest a role in skeletal morphogenesis. J Biol Chem. 1996;217:26131–26137. doi:10.1074/jbc.271.42.26131.
- Leyns L, Bouwmeester T, Kim S, et al. Frzb-1 is a secreted antagonist of Wnt signalling expressed in the Spemann organizer. Cell. 1997;88:747–756. doi:10.1016/S0092-8674(00)81921-2. PMID:9118218
- Wang S, Krinks M, Lin K, et al. Frzb, a secreted protein expressed in the spemann organizer, binds and inhibits Wnt-8. Cell. 1997;88:757–766. doi:10.1016/S0092-8674(00)81922-4. PMID:9118219
- Lin K, Wang S, Julius MA, et al. The cysteine-rich frizzled domain Frzb-1 is required and sufficient for modulation of Wnt signalling. Proc Natl Acad Sci. 1997;94:11196–11200. doi:10.1073/pnas.94.21.11196. PMID:9326585
- Person AD, Garriock RJ, Krieg PA, et al. Frzb modulates Wnt-9a-mediated ß-catenin signalling during avian atrioventricular cardiac cushion development. Dev Biol. 2005;278:35–48. doi:10.1016/j.ydbio.2004.10.013. PMID:15649459
- Lin Y, Shih Y, Lien G, et al. Promoter methylation of SFRP3 is frequent in hepatocellular carcinoma. Dis Markers. 2014; doi:10.1155/2014/351863.
- Zi X, Guo Y, Simoneau AR, et al. Expression of Frzb/Secreted frizzled-related protein 3, a secreted Wnt antagonist, in human androgen-independent prostate cancer PC-3 cells suppresses tumor growth and cellular invasiveness. Cancer Res. 2005;65(21):9762–9770. doi:10.1158/0008-5472.CAN-05-0103. PMID:16266997
- Qu Y, Li Y, Cai Q, et al. Over-expression of FRZB in gastric cancer cell suppresses proliferation and induces differentiation. J Cancer Res Clin Oncol. 2008;134:353–364. doi:10.1007/s00432-007-0291-0. PMID:17680269
- Katoh M, Katoh M. Comparative genomics on SFRP2 orthologs. Oncol Rep. 2005;14(3):783–787. PMID:16077992
- Gyorffy B, Surowiak P, Budczies J, et al. Online survival analysis software to assess the prognostic value of biomarkers using transcriptomic data in non-small-cell lung cancer. PLoSOne. 2013;8:e82241. doi:10.1371/journal.pone.0082241. PMID:24367507
- Veeck J, Chorovicer M, Naami A, et al. The extracellular matrix protein ITIH5 is a novel prognostic marker in invasive node-negative breast cancer and its aberrant expression is caused by promoter hypermethylation. Oncogene. 2008;27:865–876. doi:10.1038/sj.onc.1210669. PMID:17653090
- Fink L, Seeger W, Ermert L, et al. Real-time quantitative RT-PCR after laser-assisted cell picking. Nat Med. 1998;4:1329–1333. doi:10.1038/3327. PMID:9809560
- Veeck J, Niederacher D, An H, et al. Aberrant methylation of the Wnt antagonist SFRP1 in breast cancer is associated with unfavourable prognosis. Oncogene. 2006;25:3479–3488. doi:10.1038/sj.onc.1209386. PMID:16449975
- Noetzel E, Veeck J, Niederacher D, et al. Promoter methylation- associated loss of ID4 expression is a marker of tumour recurrence in human breast cancer. BMC Cancer. 2008;8:154. doi:10.1186/1471-2407-8-154. PMID:18513385
- Noetzel E, Rose M, Sevinc E, et al. Intermediate filament dynamics and breast cancer: aberrant promoter methylation of the Synemin gene is associated with early tumor relapse. Oncogene. 2010;29:4814–4825. doi:10.1038/onc.2010.229. PMID:20543860
- Remmele W, Stegner HE. Recommendation for uniform definition of an immunoreactive score (IRS) for immunohistochemical estrogen receptor detection (ER-ICA) in breast cancer tissue. Pathologe. 1987;8(3):138–140. PMID:3303008
- Yuzugullu H, Benhaj K, Ozturk N, et al. Canonical Wnt signalling is antagonized by noncanonical Wnt5a in hepatocellular carcinoma cells. Mol Cancer. 2009; 10.1186/1476-4598-8-90 doi:10.1186/1476-4598-8-90. PMID:19849855
- Pourreyron C, Reilly L, Proby C, et al. Wnt5a is strongly expressed at the leading edge in non-melanoma skin cancer, forming active gradients, while canonical Wnt signalling is repressed. PLOS One. 2012;7(2):e31827. doi:10.1371/journal.pone.0031827. PMID:22384081
- Ekström EJ, Sherwood V, Andersson T. Methylation and loss of secreted frizzled-related protein 3 enhances melanoma cell migration and invasion. PLOS One. 2011;6(4):e18674. doi:10.1371/journal.pone.0018674. PMID:21494614
- Mazieres J, He B, You L, et al. Wnt signalling in lung cancer. Cancer Lett. 2005;222(1):1–10. doi:10.1016/j.canlet.2004.08.040. PMID:15837535
- Marsit CJ, Houseman EA, Christensen BC, et al. Indentification of methylated genes associated with aggressive bladder cancer. PLoS One. 2010;5.
- Mori M, Rao SK, Popper HH, et al. Atypical adenomatous hyperplasia of the lung: a probable forerunner in the development of adenocarcinoma of the lung. Mod Pathol. 2001;14(2):72–84. doi:10.1038/modpathol.3880259. PMID:11235908
- McRonald FE, Morris MR, Gentle D, et al. CpG methylation profiling in VHL unrelated renal cell carcinoma. Mol Cancer. 2009;8:31. doi:10.1186/1476-4598-8-31. PMID:19493342
- Kongham PN, Northcott PA, Croul SE, et al. The SFRP family of WNT inhibitors function as novel tumor suppressor genes epigenetically silenced in medulloblastoma. Oncogene. 2010;29:3017–3024. doi:10.1038/onc.2010.32. PMID:20208569
- Korinek V, Barker N, Morin PJ, et al. Constitutive transcriptional activation by a ßcatenin-Tcf complex in APC-/- colon carcinoma. Science. 1997;275:1784–1787. doi:10.1126/science.275.5307.1784. PMID:9065401
- Shtutman M, Zhurinsky J, Simcha I, et al. The cyclin D1 gene is a target of the ß-catenin/LEF-1 pathway. Proc Nat Acad Sci United States Am. 1998;96:5522–5527. doi:10.1073/pnas.96.10.5522.
- Tetsu O, McCormick F. ß_catenin regulates expression of cyclin D1 in colon carcinoma cells. Nature. 1999;398:422–426. doi:10.1038/18884. PMID:10201372
- Mizushima T, Nakagawa H, Kamberov YG, et al. Wnt-1 but not epidermal growth factor induces ß-catenin/T-cell factor-dependent transcription in esophageal cancer cells. Cancer Res. 2002;62:277–282. PMID:11782388
- Nakashima T, Liu D, Nakano J, et al. Wnt1 overexpression associated with tumor proliferation and a poor prognosis in non-small cell lung cancer patients. Oncol Rep. 2008;19:203–209. PMID:18097596
- Tetsu O, McCormick F. ß-Catenin regulates expression of cyclin D1 in colon carcinoma cells. Lett Nat. 1999;398:422–426. doi:10.1038/18884.
- Connell-Crowley L, Harper JW, Goodrich DW. Cyclin D1/Cdk4 regulates retinoblastoma protein-mediated cell cycle arrest by site-specific phosphorylation. Mol Biol Cell. 1997;8(2):287–301. doi:10.1091/mbc.8.2.287. PMID:9190208
- Stacey DW. Cyclin D1 serves as a cell cycle regulatory switch in actively proliferating cells. Current Opinion Cell Biol. 2003;15(2):158–163. doi:10.1016/S0955-0674(03)00008-5. PMID:12648671