
ABSTRACT
Chronic exposure to glucocorticoids (GCs) can lead to psychiatric complications through epigenetic mechanisms such as DNA methylation (DNAm). We sought to determine whether epigenetic changes in a peripheral tissue can serve as a surrogate for those in a relatively inaccessible tissue such as the brain. DNA extracted from the hippocampus and blood of mice treated with GCs or vehicle solution was assayed using a genome-wide DNAm platform (Methyl-Seq) to identify differentially methylated regions (DMRs) induced by GC treatment. We observed that ∼70% of the DMRs in both tissues lost methylation following GC treatment. Of the 3,095 DMRs that mapped to the same genes in both tissues, 1,853 DMRs underwent DNAm changes in the same direction. Interestingly, only 209 DMRs (<7%) overlapped in genomic coordinates between the 2 tissues, suggesting tissue-specific differences in GC-targeted loci. Pathway analysis showed that the DMR-associated genes were members of pathways involved in metabolism, immune function, and neurodevelopment. Also, changes in cell type composition of blood and brain were examined by fluorescence-activated cell sorting. Separation of the cortex into neuronal and non-neuronal fractions and the leukocytes into T-cells, B-cells, and neutrophils showed that GC-induced methylation changes primarily occurred in neurons and T-cells, with the blood tissue also undergoing a shift in the proportion of constituent cell types while the proportion of neurons and glia in the brain remained stable. From the current pilot study, we found that despite tissue-specific epigenetic changes and cellular heterogeneity, blood can serve as a surrogate for GC-induced changes in the brain.
| Abbreviations and Acronyms | ||
| GC | = | glucocorticoid |
| DNAm | = | DNA methylation |
| DMR | = | differentially methylated region |
| CORT | = | corticosterone |
Introduction
Tools that can assess functions of specific genes and processes in the brain through the use of peripheral tissues may be immensely useful for the diagnosis of disease. However, only a few studies have correlated measurements occurring in both tissues.Citation1 Furthermore, to our knowledge, no study has identified the underlying mechanisms that link the cross-tissue changes caused by disease-causing factors, since most of such factors are either unknown or poorly characterized. Administration of such factors and assessment of their impact on the central nervous system (CNS) and peripheral tissues can provide us with underlying biological principles that can facilitate biomarker discovery.
One such factor is a class of steroid hormones known as glucocorticoids (GCs). Chronic exposure to GCs, either by iatrogenic administration, tumors, or as a part of the neuroendocrine response to stress, leads to numerous health complications, including cardiovascular disease, obesity, and diabetes.Citation2-5 The CNS is particularly vulnerable to GCs, as prolonged GC exposure is associated with cognitive decline,Citation6,Citation7 and psychiatric disorders such as anxiety,Citation8 depression,Citation9 and bipolar disorder.Citation10 Many studies have examined the physiological, biochemical, and behavioral consequences of exposure to stress and GCs in both animals and humans. In animals, the ability to control the duration and magnitude of GC exposure and the accessibility of relevant tissues make them an ideal model to study the effects of GC exposure. In humans, where studies of stress and GCs and stress-related disorders are the most relevant, studies of the brain have used either postmortem specimens or imaging studies that do not provide (epi)genomic resolution. Clinical studies performed in patients invariably involve the use of peripheral tissues that may or may not provide useful information on GC-induced brain impairments. Efforts to directly examine such impairments are hindered by the highly inaccessible and irreplaceable nature of brain tissues.
Previously, we have demonstrated that the degree of DNA methylation (DNAm) changes in the stress-response gene Fkbp5 in blood correlated strongly with mean 30-day plasma GC levels as well as GC-dependent weight changes in the spleen and visceral fat.Citation11 Interestingly, DNAm changes in the blood can also accurately reflect 30-day GC exposure and dose-dependent alterations in Fkbp5 DNAm and gene expression in the hippocampus,Citation12 as well as correlating with anxiety-like behavior.Citation11 This demonstrated the feasibility of measuring epigenetic changes in a peripheral tissue to assess GC-dependent epigenetic changes and gene function in the brain, and prompted us to identify additional hippocampal genes whose epigenetic alterations may be reflected in blood. To this end, we used the genome-wide, targeted capture Methyl-Seq platform to identify GC-induced, differentially methylated regions (DMRs) in mouse blood and brain tissues. For the brain, we chose the hippocampus, as exposure to stress and GCs has been shown to hinder hippocampal function,Citation6,Citation13,Citation14 its volume,Citation15,Citation16 and its development,Citation17,Citation18 which in turn can act as risk factors for the development of psychiatric disorders.
Materials and methods
Animals
At 5 weeks of age, male C57BL/6J mice (n = 12 in each group; Jackson Laboratories, Bar Harbor, ME) were given ad libitum access to solutions containing the rodent stress glucocorticoid corticosterone (Sigma-Aldrich, St. Louis, MO; 100 μg/ml with 1% ethanol; “CORT” group) or 1% ethanol (“VEHICLE” group) in place of their normal drinking water for 4 weeks. The method of providing CORT in the drinking water has been established by several studies that have sought to examine the role of corticosterone in mediating the stress response in rodents.Citation19-22 In the first cohort for Methyl-Seq, 4 pooled samples (n = 2 mice per sample and 2 samples per group) from each group were chosen from animals whose 4-week mean plasma CORT levels were closest to the average of each group. Rest of the individual samples in each group were used for bisulfite pyrosequencing. A second cohort (n = 12 each group) was treated with the same VEHICLE and CORT solutions for 4 weeks to obtain mRNA for expression studies and cortex tissues for fluorescence-activated cell sorting (FACS). Finally, a third cohort (n = 6 in each group) was treated with the same VEHICLE and CORT solutions for one week to obtain white blood cells for FACS. At the end of the treatment period, animals were killed, tissues harvested, and their brains frozen on powdered dry ice and subsequently stored at -80oC. All procedures were approved by the Institutional Animal Care and Use Committee at Johns Hopkins University School of Medicine and were performed in accordance with guidelines established in the National Research Council's Guide for the Care and Use of Laboratory Animals.
Blood collection
Whole blood (20 μL) was collected weekly (0900 h) from each mouse into heparinized glass capillary tubes through a small nick at the tip of the tail. Blood samples were centrifuged at 4oC and plasma was collected and frozen at −80oC for further analysis of total (free and bound) plasma CORT by radioimmunoassay, according to the manufacturer's instructions (MP Biomedicals, Costa Mesa, CA). All samples were run in duplicates with an intra-assay coefficient of variance (CV) of 3.9% and inter-assay CV of 7.5%. After the 4-week treatment period, animals were killed, and trunk blood (∼250 μL) was collected. Trunk blood samples were incubated with 3 volumes of Ack Lysing Buffer (Quality Biological, Gaithersburg, MD) to lyse red blood cells, centrifuged to collect white blood cells, and subsequently processed for genomic DNA and mRNA extraction or FACS. Whole blood cell (WBC) count of lymphocytes and neutrophils were also determined by the Phenotyping Core at the Johns Hopkins Department of Molecular and Comparative Pathobiology. FACS of trunk blood and WBC were performed after one week of CORT treatment.
Dissection of the cortex and dorsal hippocampus
Frozen mouse brains were sectioned using a cryostat, and 400 μm sections were mounted on glass slides. Needles (19 gauge; 0.686 mm inner diameter and 1.086 mm outer diameter) were used to dissect multiple (>10) punches from the cortex (bregma 1.18 through 0.78 mm) and 2–3 punches from the dorsal hippocampus (bregma -0.98 through -2.0 mm). Punched tissues were stored at -80°C in the Tissue & Cell Lysis Buffer (Epicentre Biotechnologies, Madison, WI) or the RLT Buffer (Qiagen, Germantown, MD) until processed for genomic DNA (gDNA) or total RNA, respectively.
Fluorescence-activated cell sorting of the cortex and blood tissues
For the cortex, nuclei were prepared from fresh-frozen cortex tissues by detergent and physical lysing using the Nuclei Extraction BufferCitation23 and Dounce homogenization, respectively. Cortex homogenates were layered on top of a 1.8 M sucrose gradient and subjected to ultracentrifugation for 2 h in a Beckman L7–65 Ultracentrifuge with a SW 41 Ti rotor. Pelleted nuclei were washed once with ice-cold PBS and labeled with AlexaFluor-conjugated primary antibodies against the neuron-specific marker NeuN (Millipore, Billerica, MA) in PBS with 0.5% BSA and 10% goat serum. Labeled nuclei were subsequently sorted in the BD FACS Aria at the Johns Hopkins Flow Cytometry Core.Citation24 To assess blood, freshly-collected samples were treated with the Ack Lysing Buffer for red blood cell lysis, washed twice with PBS, and labeled with APC-conjugated CD3e, PerCP-conjugated CD45R, and PE-conjugated Ly-6G/Ly-6C antibodies (BD Biosciences, Franklin Lakes, NJ) to simultaneously label and isolate T-cells, B-cells, and neutrophils, respectively, by FACS. Sorted cells were pelleted and resuspended in the Tissue & Cell Lysis Buffer for subsequent gDNA extraction.
Genomic DNA extraction
Genomic DNA (gDNA) from mouse hippocampus, cortex, and blood was isolated with the Masterpure DNA Purification Kit, according to the manufacturer's instructions (Epicentre Biotechnologies). Concentration of gDNA was determined using the Qubit 2.0 Fluorometer (Life Technologies, Carlsbad, CA).
mRNA extraction
mRNA from mouse hippocampus, cortex, and blood was isolated with the RNeasy Micro Kit according to the manufacturer's instructions (Qiagen, Germantown, MD). Concentration and quality of the mRNA were determined using the Agilent TapeStation 2200, and all of the RIN (RNA integrity number) was greater 8.5.
SureSelect Mouse Methyl-Seq
SureSelect Target Enrichment System (Mouse Methyl-Seq, Agilent Technologies, Santa Clara, CA) was implemented to identify CORT-induced epigenetic changes in the blood and brain tissues. The Methyl-Seq platform targets regulatory regions across the genome, as described previously.Citation25 Briefly, 1 μg of gDNA from each animal was pooled from 2 animals to form one sample, and 2 samples per tissue were sequenced for each treatment group. Each gDNA sample was sheared using the Covaris sonicator (Covaris, Woburn, MA) to yield 170–230 bp DNA fragments. These fragments were end-repaired, 3’-adenylated, and further ligated with methylated primers. Following hybridization to biotinylated, plus-strand DNA-complementary RNA library “baits," precipitation from the solution using streptavidin-coated magnetic beads, and RNase-digestion of the “baits,” captured DNA was bisulfite-converted using the EZ DNA Methylation Gold Kit (Zymo Research, Irvine, CA). Subsequently, DNA samples were PCR-amplified using sample-specific indexed (“barcoding”) primers to allow for multiplexing and sequenced on the Illumina Hi-Seq2000. Four samples were loaded on each lane.
Analysis of sequencing data
FASTQC version 0.11.3 was used for quality control of all the paired-end reads to assess per sequence base quality, per tile sequence quality, per sequence quality scores, per base sequence content, per sequence guanine-cytosine content, per base N content, sequence length distribution, sequence duplication levels, overrepresented sequences, adaptor content, and kmer content. Reads were trimmed using Trim Galore v0.3.7. Default parameters were used, and one base pair was trimmed off at the end of all paired-end reads to improve paired-end mapping. If adaptor contamination was observed, the standard Illumina adapters were trimmed off at the end of all paired-end reads. FASTQC post-trimming was rerun to perform quality control to ensure that the trimming step did not produce any adverse side effects.
Reads were mapped to the Mus musculus assembly (Genome Reference Consortium Mouse Build 38/ mm10), which was produced by the Mouse Genome Reference Consortium, using Bismark version 0.13.0 with Bowtie 2 version 2.1.0. Briefly, for alignment purposes Bismark converts all Cs to Ts (in forward reads) and all Gs to As (in reverse reads) before mapping and maps these in silico converted reads to both a C-to-T and G-to-A in silico-converted genome. After successful alignment, it replaces the Ts and As back to their original bases in all converted reads and compares it to the original reference genome to deduce methylated cytosines. Default parameters were used with the exception that “bowtie2 and 1 mismatch in the seed” was allowed during the alignment. After running Bismark, PCR duplicates were removed from the mapped reads using the “deduplicate bismark” routine. Post-alignment quality control was performed using Samtools version 0.1.19 and BamUtil version 1.0.12. Bismark divides all cytosines into 4 categories: cytosines followed by guanines (CpGs), cytosines followed by non-guanines followed by guanines (CHGs), cytosines followed by at least 2 non-guanines (CHHs), and cytosines followed by Ns (CNs). Analysis for the current study focused on CpGs. The Default Bismark methylation extractor routine was used with the exception of paired-end, no-overlap, and minimum coverage of at least 1 read to extract all CpGs in individual samples.
BSseq was used to analyze the CpG level data across the samples. Using the genomic location and matrices consisting of M (methylation) and Cov (read coverage of CpGs) values, BSseq smoothes the M-values across CpGs using the BSmooth function, computes t-statistics between groups of samples using the function BSmooth.tstat, and establishes the threshold levels of the t-statistics to identify DMRs using the function dmrFinder.
For smoothing, default parameters were used with the exception of the smoothing window size set to 500, and the minimum number of CpGs within the smoothing window set to 20. For computing the t-statistics between the VEHICLE and CORT groups, CpGs with at least 10x coverage across all samples were used. The t-statistics were not smoothed or corrected. To determine the threshold of the t-statistics to use in the dmrFinder, quantiles for the t-statistics for the entire genome was calculated. The threshold for including consecutive CpGs in a DMR was the 99th percentile (tail ends) of the t-statistic distribution. Regions with 3 or more CpGs and greater than or equal to 10% mean methylation difference between VEHICLE vs. CORT groups were ranked and displayed by “areaStat” and subjected to further investigation. To assess the statistical uncertainty for each observed DMR, we also used permutation techniques. We permuted the outcome variable 1000 times and re-calculated the t-statistics for each permutation. The dmrFinder was run each time to produce a set of null areas. Empirical P-values were calculated as the fraction of null areas greater than each observed area. For example, an observed area greater than 95% of the areas obtained from the permutation exercise was assigned an empirical P-value of 0.05. To account for the multiplicity problem introduced by the genome-wide screening, false discovery rates (FDRs) were computed based on these P-values.
Pathway analysis
The hypergeometric test for enrichmentCitation26-29 was used to identify KEGG pathways that were enriched in the DMR lists for the hippocampus, blood, and both tissues. Genes associated with all of the DMRs in each list, including genes of DMRs common to both tissues, were compared with genes representing each of the KEGG pathways. The hypergeometric test was used to analyze KEGG genes observed and expected for each DMR list to calculate enrichment and P-value scores. Q-values were determined by the FDR method for multiple-test correction of the enrichment P-values. The same analysis was also performed using a subset of DMRs that were P < 0.05 in the DMR lists for the hippocampus, blood, and both tissues (results shown in the Table S6).
Bisulfite pyrosequencing
DMRs identified from Methyl-Seq experiments were further replicated by bisulfite pyrosequencing of the PCR products, which measures methylation variation at >90% precision.Citation30 Genomic DNA was bisulfite-converted using the EZ DNA Methylation Gold Kit. Design and implementation of pyrosequencing assays have been described previously,Citation31,Citation32 and the primers used for each assay are included in the Supplementary Tables.
Quantitative real-time PCR
Expression levels of several genes associated with the DMRs identified in hippocampus, cortex, and blood were assessed by quantitative real-time PCR (qPCR). cDNA was generated from the mRNA using the QuantiTect Reverse Transcription Kit (Qiagen). TaqMan probes targeting the transcripts of DMR-associated genes and that of β-actin were used on the 7900HT Fast Real-time PCR System (Applied Biosystems, Foster City, CA). Cycle threshold (Ct) values for each gene, which are indicators of mRNA abundance, were normalized against those of the housekeeping gene β-actin to determine relative expression.
Results
Plasma glucocorticoid levels in mice
To identify common epigenetic targets between the blood and brain tissues, we treated mice for 4 weeks with 100 μg/mL of CORT or VEHICLE solutions (n = 12 each). Mean plasma CORT levels derived from 4 weekly measurements were 538.2 ± 67.5 ng/mL (mean ± SEM) for the CORT-treated group and 50.0 ± 7.3 ng/mL for the VEHICLE-treated group. Weekly levels are shown in Fig. S1. Genomic DNA isolated from the hippocampus and blood of 4 animals from each group was processed for the SureSelect Methyl-Seq Target Enrichment platform followed by high-throughput sequencing on the Illumina HiSeq2000. For each tissue, 2 samples each consisting of pooled gDNA from 2 CORT-treated animals were compared with those of the VEHICLE-treated animals. DNA was pooled since relatively small hole-punched tissues of the hippocampus from one animal were insufficient to provide the recommended amount (∼3.5 μg) for Methyl-Seq. DNA from blood was similarly pooled to provide consistent results using the same animals from which the hippocampal gDNA was pooled. Genomic DNA processed from the remaining 8 animals in each group was used for replication.
Methyl-Seq and Next-generation sequencing
Across 4 blood samples (representing gDNA from 8 animals) that were sequenced, we obtained an average of 40.5 million paired-end reads of which an average of 22.6 million reads were deduplicated and uniquely mapped paired-end reads. This corresponded to 1.7 million individual CpG dinucleotides with an average read-depth coverage of 30X when confining our analysis to CpGs that have at least 10 sequenced reads. Similarly, we obtained an average of 39.9 million paired-end reads from the hippocampal samples of which an average of 24.7 million reads were deduplicated and uniquely mapped. For the hippocampus, we analyzed 1.9 million CpGs with an average read-depth coverage of 36X after at least 10X reads per CpG threshold had been imposed. In addition, the sequenced reads corresponded to an on-target rate of 85% of the targeted genomic regions for blood and 87% for hippocampus, which represented 143 Mb and 149 Mb of the mouse genome, respectively. The metrics for the high-throughput sequencing of the blood and hippocampal samples are shown in .
Table 1. Read information from Methyl-Seq.
Methyl-Seq analysis and DMR validation
Using BSseq and BSmooth, methylation values at each of the CpGs were computed, smoothed estimates of raw methylation values across CpGs for each sample were determined, t-statistics for the smoothed estimates between the treatment groups were calculated, and DMRs were identified. Following BSseq analysis of CpGs with several criteria (at least 10X coverage, 3 or more CpGs, ≥ 10% mean methylation difference between VEHICLE vs. CORT groups and empirical P-value ≤ 0.05), we identified 5,491 and 5,365 DMRs in the blood and hippocampus, respectively. The top 10 DMRs for blood and hippocampus are shown in . From the extensive list of DMRs, we selected several biologically relevant DMRs to independently validate the Methyl-Seq platform by pyrosequencing. Some of the genes associated with the validated DMRs are involved in tissue-specific development, psychiatric disorders, and/or glucocorticoid signaling, as expected from mice treated with CORT. The goal was to demonstrate the robustness of the Methyl-Seq platform.
Table 2. Top 10 most significant genes regulated by CORT in blood and hippocampus.
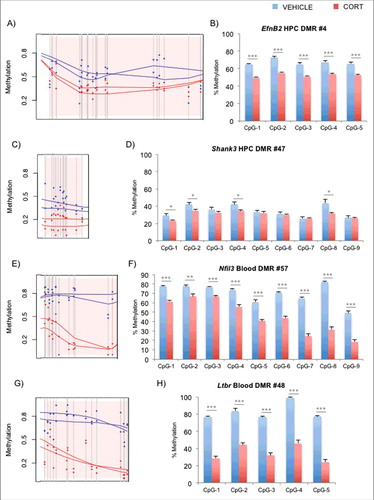
For the hippocampus (HPC), we chose 2 DMRs within the EfnB2 and Shank3 loci that had been implicated by Methyl-Seq (A and C). EfnB2 encodes a member of the ephrin family of tyrosine kinase receptors that along with REELIN are crucial for neurodevelopment.Citation33 EfnB2 is also involved in thymus development and T-cell differentiation.Citation34,Citation35 Shank3 encodes a postsynaptic scaffold protein that contains multiple ankyrin repeat domains and also plays an important role in neuron function and development.Citation36,Citation37 Interestingly, numerous genetic and animal model studies have linked this gene to autism.Citation38-40 Bisulfite pyrosequencing validation of several CpGs in each DMR for VEHICLE vs. CORT animals are shown (n = 8 per group, B and D). For the blood, we chose 2 DMRs within the Nfil3 and Ltbr loci (E and G). Nfil3, or nuclear factor interleukin 3 regulated, encodes a transcription factor that represses Per1/Per2 gene expression to control circadian rhythm,Citation41,Citation42 and plays important roles in T-cell development and cytokine production in the blood.Citation43-45 Ltbr encodes the lymphotoxin β receptor that is a member of the tumor necrosis factor superfamily and is involved in lymphoid organ development.Citation46,Citation47 Interestingly, both Nfil3 and Ltbr are demonstrated targets of GC signaling,Citation48,Citation49 and validation of their CpGs by bisulfite pyrosequencing is shown in F and H. Exhaustive DMR lists for both blood and hippocampus are shown in Tables S1 and S2, respectively. Also, in light of the subtle epigenetic changes in the hippocampus, we tested a few genomic regions that are not on the DMR list as positive and negative controls for GC exposure. Pyrosequencing results for previously identified DMRsCitation12 in Fkbp5 intron 5 and intron 1 (positive controls for hippocampus and blood, respectively), as well as promoter regions of Crh, Fkbp4, and Gfap (negative controls) in hippocampus are shown in Figs. S2A-E. Genes associated with the DMRs showed an increase in expression in the CORT-treated animals for Ltbr, Nfil3, and Fkbp5 in the blood (Fig. S3A) and EfnB2, Shank3, and Fkbp5 in the hippocampus (Fig. S3B). On the other hand, we observed no change in the expression of the hippocampal Gfap, consistent with its static DNAm levels between the 2 treatment groups.
Figure 1. Identification and replication of DMRs implicated by Methyl-Seq. (A) Methyl-Seq graphical output of EfnB2 DMR in the hippocampus according to BSmooth. Pink shaded region represents the DMR, gray vertical lines represent CpG dinucleotides, and the dots represent % DNAm estimates for VEHICLE- (blue) or CORT-(red) treated samples. The lines are the smoothed estimates used for DMR calculations. (B) Pyrosequencing replication (n = 8 per group) of sequential CpGs in the DMR of EfnB2. Similar graphical output (C) and pyrosequencing replication (D) for a hippocampal DMR in Shank3. Graphical output (E, G) and pyrosequencing replication results (F, H) are also shown for blood DMRs in Nfil3 and Ltbr, respectively. Bar graphs in the right panels are represented as mean ± SEM. *P<0.05, **P<0.01, and ***P<0.001.
Pathway analysis of epigenetic targets of glucocorticoids in the blood and brain
Given the numerous DMRs that exist between VEHICLE vs. CORT samples in both tissues, we performed KEGG pathway analysis to identify pathways that may be over-represented. Interestingly, metabolic and cancer pathways were the top most significant entries for both tissues (). Pathways involved in myeloid leukemia and endocytosis were highly significant in the blood DMRs, whereas pathways involved in WNT signaling and axon guidance were highly significant in the hippocampal DMRs. Given the presence of common pathways such as those involved in MAPK, neurotrophin, and insulin signaling, we performed an additional analysis of genes that were commonly represented in both DMR lists. As expected, similar pathways were implicated as in the analysis of individual tissue. The results suggest that a significant subset of genes in each tissue commonly undergo epigenetic changes following GC exposure. Comprehensive tables of all FDR-significant pathways in blood, hippocampus, and both tissues are included in Tables S3–5. We also performed pathway analysis only on DMRs that met nominal P-value significance (P < 0.05), and those results are included in Table S6.
Table 3. Distinct pathways regulated by CORT in blood and hippocampus.
Genomic organization of the DMRs
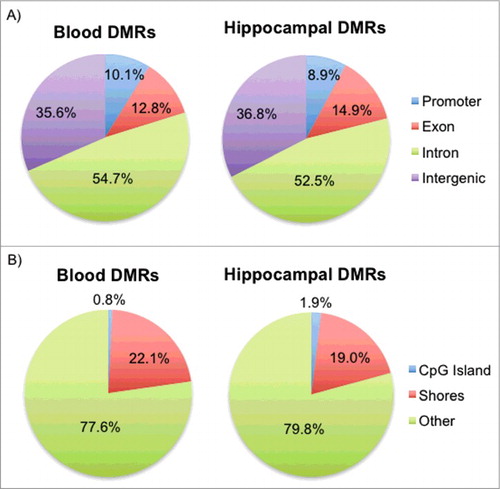
DMRs identified in the blood and hippocampus were classified based on their locations with respect to genes and CpG islands. More than 50% of the DMRs were located within intronic regions for both tissues, with promoters making up about 10% of the DMRs and intergenic regions (upstream and downstream of genes) making up more than 35% (A). In addition, more than 77% of the blood and hippocampal DMRs were located well beyond the CpG islands, as approximately 20% of the DMRs fell within island shores, commonly defined as regions within 3 kilobases flanking the CpG islands,Citation50 and less than 2% of the DMRs were located within the islands themselves (B). DMR locations are consistent with those of previous studies that reported tissue-specific DMRs predominantly in intronic and intergenic regions that are not CpG islands.Citation31,Citation51 Also, studies that have performed similar analyses with targets of GCs in vitroCitation52 and in vivoCitation53 or HPA axis dysregulation in clinical samplesCitation54 have primarily implicated intronic regions.
Figure 2. Genomic locations of the blood and hippocampal DMRs with respect to genes and CpG islands. (A) Pie charts for both blood and hippocampal DMRs show the percentage of DMRs that fall in promoters, exons, introns, and intergenic regions. (B) Pie charts for both blood and hippocampal DMRs show the percentage of DMRs that fall in CpG islands, shores, and non-CpG-associated regions (Other).
Characteristics of the DMRs
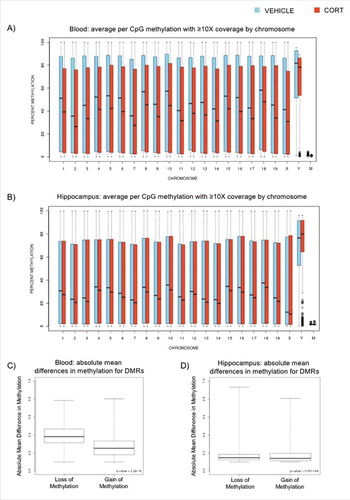
Given the thousands of DMRs identified, we also asked whether they could provide us with insights into GC biology. We first observed that many of the DMRs in both tissues were reduction-of-methylation events in the CORT group, which prompted us to score these events for the entire list. Of the 5,491 DMRs identified in blood, 70.7% were DMRs that lost methylation following CORT treatment. Similarly, 72.0% of the 5,365 DMRs identified in the hippocampus were also loss-of-methylation events. We then retraced our steps in the analytical pipeline, examined percent methylation values determined for individual CpGs between the treatment groups, and constructed a boxplot of all of the CpG methylation values for each chromosome. Loss of DNAm was observed in all of the chromosomes for both blood (A) and hippocampus (B), with the exception of the Y-chromosome in the hippocampus that exhibited overall increase in DNAm. However, we noted that the Y-chromosome in the hippocampus also showed an unusual number of outlier CpGs in the CORT-treated animals, which underwent drastic loss of methylation. We also noted that the relatively small number of mitochondrial CpGs that are represented in Methyl-Seq are largely devoid of DNAm in both tissues. Finally, we asked whether the magnitude of methylation changes between the treatment groups is different between gain vs. loss of methylation events. We constructed a boxplot to visualize the absolute magnitude of the methylation changes segregated by direction. In blood, DMRs that lost methylation with CORT treatment underwent a median loss of 38.3%, whereas DMRs that gained methylation with CORT underwent a median gain of 25.4% (C). The mean differences of the DMRs between the treatment groups were highly significant (P = 2.2 × 10⁻¹⁶). In contrast, we observed a more subtle, but significant difference in the magnitude of change between gain vs. loss of methylation events in the hippocampus. DMRs that lost methylation with CORT treatment underwent a median loss of 14.9%, compared to 14.1% in the DMRs that gained methylation with treatment (D). Despite the similarity in magnitude, the mean differences of the DMRs were still significant (P = 0.001).
Figure 3. Box plots of CORT-induced DNAm changes in blood and hippocampus. (A) Box plot of average methylation values (n = 2 samples or 4 mice per group) for individual CpGs with at least 10 reads. The plots for blood DNA are displayed for each chromosome for VEHICLE-(blue) vs. CORT-(red) treated samples. (B) Similar box plot for the hippocampus is shown. (C) DMRs between VEHICLE- and CORT-treated animals were segregated based on the direction of DNAm change. Box plots of absolute mean % methylation differences for loss-of-methylation and gain-of-methylation DMRs in blood are shown. (D) Similar box plots for the hippocampal DMRs are shown.
Common DMRs between the blood and hippocampus
In light of our previous finding where we observed CORT-induced loss of methylation of Fkbp5 occurring at different loci in blood and brain,Citation12,Citation32 we asked whether genomic coordinates of across-tissue DMRs that were incident in the same genes overlapped with one another. From the DMR lists, we identified 3,095 DMRs that mapped to the same genes in both blood and hippocampus, with 1,853 DMRs (∼60%) showing DNAm changes in the same direction. We then constructed a histogram of all intragenic blood-hippocampus DMR distances. We found that most of the DMRs did not overlap when the distances were represented as absolute distances in basepairs (Fig. S4A) or as ratios normalized by the length of each RefSeq gene (Fig. S4B). In fact, only 209 DMRs (<7%) overlapped in genomic coordinates between the 2 tissues, and of these, 136 DMRs (65%) changed DNAm in the same direction. We then performed bisulfite pyrosequencing on the tissue-specific DMRs belonging to 3 common genes whose expression was affected by GCs according to literature. Neuron navigator 2 (Nav2, A and B) plays a role in neuronal growth and migration, and its tissue-specific DMRs are 145,528 basepairs apart. Recent work in corneal fibroblasts demonstrates that Nav2 is upregulated by the synthetic GC dexamethasone.Citation55 Similar loss-of-methylation patterns were observed in both of the tissue-specific DMRs within Slc38a2 (also known as Sat2 or Snat2, C and D), a widely expressed amino acid transporter that is upregulated by GCs.Citation56 Its DMRs are 1,053 bp apart. We also tested the DMRs within Nr1d1 (also known as Rev-erbA-α), a gene involved in the development and circadian regulation of tissues such as the liver, brain, and adipose tissues. Its DMRs are merely 334 bp apart. However, unlike the other 2 genes examined, the pyrosequencing confirmed that the methylation changes in blood and brain occur in opposite directions (E and F). Interestingly, Nr1d1 is differentially regulated by GCs, as studies have reported GC-induced upregulation in the striatumCitation57 and downregulation in the liver.Citation58 Finally, in the hippocampus, we examined the identical genomic coordinates of the DMRs that were implicated from the blood Methyl-Seq experiment. As peripheral DNA is often used to identify regions that are associated with psychiatric disorders, we sought to test the assumption that the same regions in the brain undergo disease-relevant epigenetic changes. Blood DMRs for Nav2, Slc38a2, and Nr1d1 tested on the hippocampal DNA showed little evidence of DNAm changes as observed in blood DNA (Figs. S5A-C).
Figure 4. Pyrosequencing replication of blood and hippocampal DMRs that fall on identical genes. (A) and (B) Bisulfite pyrosequencing for the DMRs in the Nav2 gene for the hippocampus and blood are shown, respectively. (C) and (D) Bisulfite pyrosequencing for the DMRs in the Slc38a2 gene for the hippocampus and blood are shown, respectively. (E) and (F) Bisulfite pyrosequencing for the DMRs in the Nr1d1 gene for the hippocampus and blood are shown, respectively. Note that DMRs for Nr1d1 in blood (gain of DNAm) and brain (loss of DNAm) are predicted to occur in opposite directions. Bar graphs in all of the panels are represented as mean ± SEM.*P < 0.05, **P < 0.01, and ***P < 0.001.
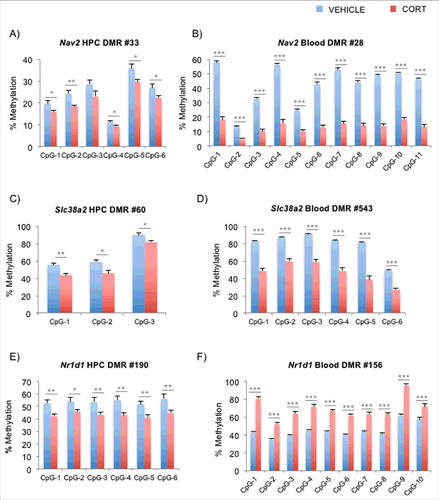
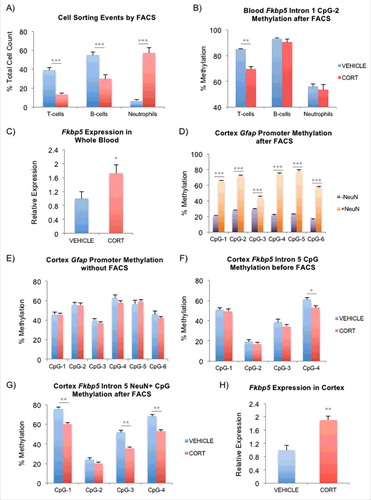
Figure 5. FACS to delineate the contribution of different cell types to the observed DNAm differences. (A) Cell count by FACS after one-week VEHICLE or CORT treatment. Contribution from each of the cell types are presented as a percentage of the total cell count obtained from T-cells, B-cells, and neutrophils. (B) Intronic CpGs within Fkbp5 previously shown to undergo CORT-induced loss of DNAm in whole blood were tested. Results for one of the CpGs is shown to undergo substantial methylation change in only T-cells. (C) Induction of Fkbp5 in whole blood by CORT treatment. Fkbp5 expression has been normalized by that of Actb (β-actin). (D) Testing of FACS on the mouse cortex. Cortex tissues were separated into neuronal (NeuN+) and non-neuronal (NeuN-) fractions by FACS. Bisulfite pyrosequencing of the conserved Gfap promoter shows substantially lower methylation in the (NeuN-) fraction, consistent with it's expression in the glia. (E) Absence of CORT-induced changes cellular heterogeneity in the cortex. Bisulfite pyrosequencing of the Gfap promoter on unsorted cortex tissues shows no difference in methylation between the VEHICLE- and CORT-treated animals. (F) CORT-induced changes in DNAm in the cortex. CpG-4 within the fifth intron of Fkbp5 undergoes methylation loss in the unsorted cortex tissues. (G) More substantial change in DNAm can be seen in the same intronic region of Fkbp5 in the NeuN+ fraction following FACS. (H) Induction of Fkbp5 in the cortex by CORT treatment. Fkbp5 expression has been normalized by that of Actb (β-actin). Bar graphs in all of the panels are represented as mean ± SEM.*P < 0.05, **P < 0.01, and ***P < 0.001.
Tissue heterogeneity in the brain and blood
Chronic exposure to GCs is associated with significant changes in the populations of lymphocytes, neutrophils, and platelet counts in bloodCitation59-63 as well as astrogliogenesis in the hippocampus,Citation64 and mesenchymal-to-epithelial transition in some tissue-derived cell lines.Citation65 We asked whether changes in the populations of cell types and different methylation patterns in each cell type played a role in the observed methylation differences between the VEHICLE- and CORT-treated animals.
First, to demonstrate the presence of CORT-induced changes in cell types in the blood, mice were treated for one week, during which the blood underwent substantial changes in DNAm (∼70% of total).Citation11 Trunk blood (n = 8 per group) was then used to perform complete blood count (CBC) to identify CORT-induced changes in the percentage of lymphocytes (%LY), which includes T-cells and B-cells, and neutrophils (%NE) in the blood. We observed a substantial reduction in the %LY from 81.0 ± 2.5% to 41.3 ± 2.7% (mean ± SEM, P = 1.46 × 10⁻⁷) and an increase in the %NE from 12.8 ± 1.4% to 52.0 ± 2.7% (P = 2.23 × 10⁻⁸) in the CORT-treated animals. In a separate experiment, we took the same whole blood from the 2 groups and determined the percent composition of the T-cells, B-cells, and neutrophils by labeling them with cell type specific antibodies and counting the different sorting events during FACS. Among these 3 cell types, we observed reductions in the percentages of T-cells and B-cells and an increase in the percentage of neutrophils in the CORT-treated group (A) similar to changes observed during CBC.
This raised the possibility that some of the observed methylation changes in the blood may be confounded by an influx of neutrophils with lower methylation content.Citation66 To measure the effect of heterogeneity on DNAm, DNA was extracted from the sorted cells and subjected to bisulfite pyrosequencing to interrogate the Intron 1 GC response element (GRE) CpGs of Fkbp5 (also tested in Fig. S2B in whole blood). We observed significant loss of methylation in the T-cells, but not in the B-cells or neutrophils (B) and an increase in expression of Fkbp5 in the whole blood (C). Our results demonstrated that while blood underwent significant CORT-induced changes in cell type composition, only T-cells, which are the predominant cell type in the mouse blood,Citation67 exhibited GC-induced changes in DNAm.
We then asked whether similar events occur in the brain. Since the hippocampal punches did not yield sufficient amount of tissue for FACS, we instead used punches from the cortex, where larger tissue material can be obtained and where we have also demonstrated CORT-induced transcriptional and epigenetic changes in the Fkbp5 gene (unpublished). Sucrose gradient-treated nuclei were labeled with the NeuN/Fox-3 antibody, FAC-sorted, and processed for bisulfite pyrosequencing. First, there were no significant differences in the ratio of NeuN+ nuclei to the total nuclei sorted between the VEHICLE- and CORT-treated animals (n = 4, 78.2 ± 2.3% vs. 80.5 ± 1.2%, P = 0.43), suggesting that there were only trivial CORT-induced changes in cell type composition in the cortex. To further demonstrate the absence of a change in the cell type proportion in the brain, we also implemented an epigenetic approach. Examination of a highly-conserved promoter region of the gene encoding the glial fibrillary acidic protein (GFAP) in the VEHICLE-treated cortex showed substantial methylation differences across 6 CpGs between NeuN- and NeuN+ fractions (15.4–54.9% DNAm increase in NeuN+, P = 3.5 × 10⁻⁴–1.2 × 10⁻⁶), consistent with expression of Gfap in the NeuN-negative glia (D). No differences in DNAm were observed in Gfap between the VEHICLE- and CORT-treated groups in unsorted cortex tissues (E) or in both NeuN- and NeuN+ fractions (data not shown). If CORT treatment led to changes in the populations of neuronal and non-neuronal fractions, then we would be able to observe substantial changes in the Gfap promoter in the unsorted tissue. On the other hand, a subtle difference in DNAm was observed in an intronic CpG of Fkbp5 before FACS in cortex (F), and the differences became more substantial in the CORT-treated, NeuN+ fractions after FACS (G). Specifically, we observed 7.9% (P = 0.02) DNAm difference at CpG-4 between the VEHICLE- and CORT-treated groups in the unsorted cortex, and FACS of the cortex tissue unmasked greater differences in DNAm at multiple CpGs: CpG-1 (15.6%, P = 0.002); CpG-3 (16.2%, P = 0.002), CpG-4 (15.6%, P = 0.009). The epigenetic changes in the cortex were also associated with an expression change in Fkbp5 (H), similar to that observed in blood. There was an absence of epigenetic and expression changes in Gfap following CORT treatment in the hippocampus (Figs. S2E and S3B, respectively). Taken together, these observations suggest that neuronal fractions undergo CORT-induced DNAm changes without substantial changes in neuronal populations in the cortex.
Discussion
Although there are many studies that have identified and characterized peripheral “markers” of disease-relevant processes, basic underlying principles that govern across-tissue analysis are largely uncharacterized. In this study, we capitalized on our previous finding that GCs directly influence DNAm to identify common epigenetic targets of GCs in the mouse blood and hippocampus. Our goal was to determine whether the same genes underwent GC-induced epigenetic changes in both tissues and in doing so, to assess the feasibility of using blood as a potential surrogate for brain tissue.
To this end, we used a genome-wide methylation platform called Methyl-Seq to identify thousands of GC-induced DMRs across the genome in mice that were treated with CORT. To date, several notable studies have compared tissue-specific epigenetic signatures between tissue types, in the context of agingCitation68,Citation69 or neurodevelopment.Citation51 To our knowledge, the current study is one of the first that documents treatment-induced, genome-wide epigenetic changes across tissue types.
We made several observations regarding epigenetics and GC biology. First, based on the direction of methylation change of the DMRs, GCs promote loss-of-methylation events. This is surprising given that GC-bound GR can act as both activator and repressor of transcription in a locus-specific way.Citation70,Citation71 Also, CORT-induced loss-of-methylation events undergo larger magnitude change in methylation than gain-of-methylation events. Such loss-of-methylation events may be the primary way that GCs facilitate transcriptional activation. For gene repression, especially at pro-inflammatory genes, alternative mechanisms such as modifications of histonesCitation72 or GRE-independent mechanisms such as co-repression with NF-κBCitation73 may play a bigger role.
Second, pathway analysis of the blood and hippocampal DMRs are consistent with the role of GCs in metabolism, obesity, type-2 diabetes, and the immune system, as metabolic, adipocytokine, insulin, and chemokine signaling pathways have been implicated. Despite the significant contribution of cellular heterogeneity to the observed methylation differences between the VEHICLE- and CORT-treated animals in the blood, implication of similar pathways as those in the brain supports the use of whole blood to identify CORT-induced epigenetic events. Of particular interest are pathways such as WNT, insulin, neurotrophin, and JAK-STAT signaling pathways that play crucial roles in brain function. As such, pathways and DMRs that are common to these tissues first serve to affirm the biological role of GCs at the epigenomic level by implicating anticipated pathways, but more importantly make it feasible to test activity of brain-specific genes that may be similarly regulated in the blood. For instance, the WNT signaling regulates neurogenesis in the hippocampusCitation74 and is negatively regulated by GCs.Citation75 It may be possible to assess the degree of GC-induced, DMR-mediated inhibition of WNT genes in the hippocampus by assessing the methylation levels of their counterparts in the blood.
Third, another observation made from the DMRs that map to common genes is that only a small percentage of the DMRs overlap in genomic coordinates. This observation has important implications. While these overlapping DMRs have the potential to serve as peripheral markers of GC-exposure in the brain, their relatively low occurrence, at least in our study, may impede their practical use. Also, different tissues undergo GC-induced changes at different loci. Previous studies on identification of tissue-specific DMRsCitation31 suggest the presence of tissue-specific methylation differences scattered throughout any given gene, and it is thought that these regions undergo epigenetic changes to influence gene expression, as observed in our study. A more important implication is that across-tissue epigenetic markers may exist for environmental factors, as in our case with GC exposure, but the epigenetic marks may be located at different regions within the gene. In other words, assessing the same genomic region for GC-induced differences in different tissue types may reduce the probability of finding a peripheral marker. Nevertheless, we state that these tissue-specific DMRs can still serve as useful biomarkers, so long as the DNAm changes in one tissue are associated with DNAm or expression changes in the brain.Citation12
Lastly, we found that the magnitude of DNAm change was far greater in blood than in the brain. Since reference methylomic information is not yet available for the different leukocytes in the mouse blood as it is for humans, we used FACS to examine the degree to which cellular heterogeneity may play a role in the observed DMRs. In blood, we observed the expected influx of neutrophils and efflux or elimination of the T- and B-cells from circulation. Results obtained from both the whole blood cell count and FACS support previously published studies that have documented demargination of neutrophilsCitation76 and either efflux or apoptotic destruction of T- and B-cells following GC administration.Citation77 Methylation analysis of an intronic region of the Fkbp5 gene previously shownCitation11 to undergo CORT-induced change revealed that only the T-cells were affected. Taken together, the large methylation changes observed at the Fkbp5 locus and elsewhere are likely due to a combination of demargination of neutrophils with low CpG methylation, elimination of T- and B-cells from the circulation, and loss of methylation in specific cell types such as the T-cells. Additional studies are warranted to further examine the interaction of these factors and characterize their roles in the CORT-treated blood.
On the other hand, strong support for GC-induced changes in the proportion of cell types was not observed in the cortex or the hippocampus. Using the more abundant cortex tissue, we first demonstrated that there are substantial methylation differences at the Gfap promoter between neuronal and non-neuronal fractions and that methylation levels of the Gfap promoter in the unsorted cortex tissues did not change in the CORT-treated animals. A significant reduction of DNAm in the CORT-treated samples would have suggested a reduction in the neuronal population that contributed the higher methylation levels in the VEHICLE-treated animals. More importantly, similar observations were made in the unsorted hippocampal tissues. This is noteworthy, since the dentate region of the hippocampus is one of the few regions of the developed brain thought to undergo active neurogenesis.Citation74 Our findings justify either physically separating or statistically adjusting for the proportion of the cell types of interest to unmask potential GC-induced epigenetic changes confounded by cellular heterogeneity.
As the current study is exploratory in nature, it has several limitations. First and foremost, we did not measure expression of genes for all of the DMRs that we implicated by Methyl-Seq. Although many of the DMRs in both blood and hippocampus were associated with GC target genes, comprehensive expression studies such as RNA-Seq are necessary to derive the functional significance of each DMR. Unfortunately, our approach of performing hole-punch dissection of the dorsal hippocampus, a subregion highly susceptible to stress and GCs,Citation78,Citation79 limited the amount of tissue available for RNA-Seq. However, using qPCR, we demonstrated CORT-induced change in the expression levels of several genes that were associated with candidate blood and hippocampal DMRs. Further, in light of the ∼70% of the DMRs showing loss-of-methylation events in both tissues, it is imperative to reconcile this with the number of genes that are up- or downregulated in the same tissues.
Second, DNA from 2 animals was pooled for each sample analyzed by Methyl-Seq. Consequently, this approach affected our ability to perform useful FDR calculations, as 2 pooled DNA samples (from 4 animals) per treatment group per tissue did not provide adequate sample size. Nonetheless, DMR rankings based on the areaStat parameter provided an adequate measure of confidence that allowed us to replicate the results using additional samples. There are advantages to pooling samples, as several studies have used this strategy to improve statistical power and reduce variations that may arise from individual samples.Citation80-82 In the current study, our primary rationale for pooling samples was to obtain sufficient amount of starting material for Methyl-Seq.
Third, it is not clear whether any of these DMRs become occupied by the GC receptor complex following chronic GC treatment. It is possible that many of these DMRs may arise indirectly by proteins encoded by genes that are the primary targets of GC signaling. However, there are no comprehensive genome-wide data sets for targets of GC signaling for the mouse genome, and many of the GC receptor binding sites identified in the humanCitation83 or ratCitation52,Citation53 genomes do not show strong cross-species conservation. Chromatin immunoprecipitation (ChIP) assays performed on the mouse T-cells and hippocampus are needed to verify the DMRs as such.
Fourth, the animals were exposed to high levels of GCs. The level of GC exposure is similar to that of Cushing's disease patients or patients with autoimmune diseases such as rheumatoid arthritis or lupus who receive GCs. As the GC levels exceed those experienced during stress exposure, it is unlikely that identical magnitude of methylation changes occurs in stressed animals, although it is plausible that the epigenetic signatures (loci) could be similar. Despite the high dose of CORT, the current study serves as a proof-of-concept demonstration that prolonged exposure to GCs, the primary agent in the stress response, can cause genome-wide epigenetic changes. Use of stress paradigms, such as psychosocial stressCitation84 or chronic variable stress,Citation85 are needed to characterize the epigenetic changes that occur due to stress exposure.
Fifth, treatment with CORT led to a significant shift in the populations of specific cell types and served as a confounding factor in our measurement of DNAm levels in the blood. As demonstrated with methylation changes at the Fkbp5 locus, a significant shift in the cell type composition of blood likely made a significant contribution in the larger magnitude change observed in DMRs that underwent loss-of-methylation vs. gain-of-methylation. Currently, we are unable to determine to what extent the shift in cell type composition may play a role on other DMRs beyond Fkbp5. FACS followed by Methyl-Seq of the major cell types in blood needs to be performed in mice to properly control for the contribution of each cell type in the observed changes in methylation. In addition, our blood Fkbp5 data showed that GC-induced changes occurred only in T-cells. However, this observation may only apply to Fkbp5. It is plausible that at other loci, only B-cells or neutrophils undergo GC-induced changes in methylation. Additional DMRs in different cell types need to be tested to ascertain whether our observation at Fkbp5 can be generalized.
Lastly, we have yet to determine the portion of DMRs that are comprised of hydroxymethylation events, as bisulfite treatment of DNA cannot distinguish methylcytosine (mC) from hydroxymethylcytosine (hmC) without additional modifications. This issue is especially relevant for the hippocampal DMRs, as hmC modifications are highly abundant in the brain.Citation86 Additional chemical modifications using potassium perruthenate (KRuO4, oxBS-Seq) or enzymatic modifications of DNA using β-glucosyltransferases and TET (TAB-Seq) are needed to resolve mC from hmC.Citation87
Despite the limitations, we identified several genes where blood could serve as a surrogate for GC-induced epigenetic changes in the brain. This finding warrants additional studies to examine and establish across-tissue epigenomic and transcriptomic correlations in greater detail.
Disclosure of potential conflicts of interest
No potential conflicts of interest were disclosed.
KEPI_A_1334025_supplementary_data.zip
Download Zip (2.9 MB)Additional information
Funding
Related Research Data
References
- Shumay E, Logan J, Volkow ND, Fowler JS. Evidence that the methylation state of the monoamine oxidase A (MAOA) gene predicts brain activity of MAO A enzyme in healthy men. Epigenetics 2012; 7:1151–60; PMID:22948232; https://doi.org/10.4161/epi.21976
- Bose M, Olivan B, Laferrere B. Stress and obesity: the role of the hypothalamic-pituitary-adrenal axis in metabolic disease. Curr Opin Endocrinol Diabetes Obes 2009; 16:340–6; PMID:19584720; https://doi.org/10.1097/MED.0b013e32832fa137
- Brydon L, Magid K, Steptoe A. Platelets, coronary heart disease, and stress. Brain Behav Immun 2006; 20:113–9; PMID:16183245; https://doi.org/10.1016/j.bbi.2005.08.002
- Hackett RA, Steptoe A. Psychosocial factors in diabetes and cardiovascular risk. Curr Cardiol Rep 2016; 18:95; PMID:27566328; https://doi.org/10.1007/s11886-016-0771-4
- Kelly SJ, Ismail M. Stress and type 2 diabetes: a review of how stress contributes to the development of type 2 diabetes. Annu Rev Public Health 2015; 36:441–62; PMID:25581145; https://doi.org/10.1146/annurev-publhealth-031914-122921
- Atsak P, Guenzel FM, Kantar-Gok D, Zalachoras I, Yargicoglu P, Meijer OC, Quirarte GL, Wolf OT, Schwabe L, Roozendaal B. Glucocorticoids mediate stress-induced impairment of retrieval of stimulus-response memory. Psychoneuroendocrinology 2016; 67:207–15; PMID:26923851; https://doi.org/10.1016/j.psyneuen.2016.02.006
- Forget H, Lacroix A, Bourdeau I, Cohen H. Long-term cognitive effects of glucocorticoid excess in Cushing's syndrome. Psychoneuroendocrinology 2016; 65:26–33; PMID:26708069; https://doi.org/10.1016/j.psyneuen.2015.11.020
- Ardayfio P, Kim KS. Anxiogenic-like effect of chronic corticosterone in the light-dark emergence task in mice. Behav Neurosci 2006; 120:249–56; PMID:16719689; https://doi.org/10.1037/0735-7044.120.2.249
- Gobinath AR, Mahmoud R, Galea LA. Influence of sex and stress exposure across the lifespan on endophenotypes of depression: focus on behavior, glucocorticoids, and hippocampus. Front Neurosci 2014; 8:420; PMID:25610363; https://doi.org/10.3389/fnins.2014.00420
- Belvederi Murri M, Prestia D, Mondelli V, Pariante C, Patti S, Olivieri B, Arzani C, Masotti M, Respino M, Antonioli M, et al. The HPA axis in bipolar disorder: Systematic review and meta-analysis. Psychoneuroendocrinology 2016; 63:327–42; PMID:26547798; https://doi.org/10.1016/j.psyneuen.2015.10.014
- Lee RS, Tamashiro KL, Yang X, Purcell RH, Huo Y, Rongione M, Potash JB, Wand GS. A measure of glucocorticoid load provided by DNA methylation of Fkbp5 in mice. Psychopharmacology (Berl) 2011; 218:303–12; PMID:21509501; https://doi.org/10.1007/s00213-011-2307-3
- Ewald ER, Wand GS, Seifuddin F, Yang X, Tamashiro KL, Potash JB, Zandi P, Lee RS. Alterations in DNA methylation of Fkbp5 as a determinant of blood-brain correlation of glucocorticoid exposure. Psychoneuroendocrinology 2014; 44:112–22; PMID:24767625; https://doi.org/10.1016/j.psyneuen.2014.03.003
- Datson NA, van den Oever JM, Korobko OB, Magarinos AM, de Kloet ER, McEwen BS. Previous history of chronic stress changes the transcriptional response to glucocorticoid challenge in the dentate gyrus region of the male rat hippocampus. Endocrinology 2013; 154:3261–72; PMID:23633533; https://doi.org/10.1210/en.2012-2233
- Workman JL, Chan MY, Galea LA. Prior high corticosterone exposure reduces activation of immature neurons in the ventral hippocampus in response to spatial and nonspatial memory. Hippocampus 2015; 25:329–44; PMID:25269789; https://doi.org/10.1002/hipo.22375
- Pagliaccio D, Luby JL, Bogdan R, Agrawal A, Gaffrey MS, Belden AC, Botteron KN, Harms MP, Barch DM. Stress-system genes and life stress predict cortisol levels and amygdala and hippocampal volumes in children. Neuropsychopharmacology 2014; 39:1245–53; PMID:24304824; https://doi.org/10.1038/npp.2013.327
- Zhang H, Zhao Y, Wang Z. Chronic corticosterone exposure reduces hippocampal astrocyte structural plasticity and induces hippocampal atrophy in mice. Neurosci Lett 2015; 592:76–81; PMID:25748318; https://doi.org/10.1016/j.neulet.2015.03.006
- Tanokashira D, Morita T, Hayashi K, Mayanagi T, Fukumoto K, Kubota Y, Yamashita T, Sobue K. Glucocorticoid suppresses dendritic spine development mediated by down-regulation of caldesmon expression. J Neurosci 2012; 32:14583–91; PMID:23077044; https://doi.org/10.1523/JNEUROSCI.2380-12.2012
- Crudo A, Suderman M, Moisiadis VG, Petropoulos S, Kostaki A, Hallett M, Szyf M, Matthews SG. Glucocorticoid programming of the fetal male hippocampal epigenome. Endocrinology 2013; 154:1168–80; PMID:23389956; https://doi.org/10.1210/en.2012-1980
- Conrad CD, McLaughlin KJ, Harman JS, Foltz C, Wieczorek L, Lightner E, Wright RL. Chronic glucocorticoids increase hippocampal vulnerability to neurotoxicity under conditions that produce CA3 dendritic retraction but fail to impair spatial recognition memory. J Neurosci 2007; 27:8278–85; PMID:17670974; https://doi.org/10.1523/JNEUROSCI.2121-07.2007
- Du J, Wang Y, Hunter R, Wei Y, Blumenthal R, Falke C, Khairova R, Zhou R, Yuan P, Machado-Vieira R, et al. Dynamic regulation of mitochondrial function by glucocorticoids. Proc Natl Acad Sci U S A 2009; 106:3543–8; PMID:19202080; https://doi.org/10.1073/pnas.0812671106
- Gourley SL, Wu FJ, Kiraly DD, Ploski JE, Kedves AT, Duman RS, Taylor JR. Regionally specific regulation of ERK MAP kinase in a model of antidepressant-sensitive chronic depression. Biol Psychiatry 2008; 63:353–9; PMID:17889834; https://doi.org/10.1016/j.biopsych.2007.07.016
- Karatsoreos IN, Bhagat SM, Bowles NP, Weil ZM, Pfaff DW, McEwen BS. Endocrine and physiological changes in response to chronic corticosterone: a potential model of the metabolic syndrome in mouse. Endocrinology 2010; 151:2117–27; PMID:20211972; https://doi.org/10.1210/en.2009-1436
- Jiang Y, Matevossian A, Huang HS, Straubhaar J, Akbarian S. Isolation of neuronal chromatin from brain tissue. BMC Neurosci 2008; 9:42; PMID:18442397; https://doi.org/10.1186/1471-2202-9-42
- Guez-Barber D, Fanous S, Harvey BK, Zhang Y, Lehrmann E, Becker KG, Picciotto MR, Hope BT. FACS purification of immunolabeled cell types from adult rat brain. J Neurosci Methods 2012; 203:10–8; PMID:21911005; https://doi.org/10.1016/j.jneumeth.2011.08.045
- Hing B, Ramos E, Braun P, McKane M, Jancic D, Tamashiro KL, Lee RS, Michaelson JJ, Druley TE, Potash JB. Adaptation of the targeted capture Methyl-Seq platform for the mouse genome identifies novel tissue-specific DNA methylation patterns of genes involved in neurodevelopment. Epigenetics 2015; 10:581–96; PMID:25985232; https://doi.org/10.1080/15592294.2015.1045179
- Cao J, Zhang S. A Bayesian extension of the hypergeometric test for functional enrichment analysis. Biometrics 2014; 70:84–94; PMID:24320951; https://doi.org/10.1111/biom.12122
- Halbritter F, Vaidya HJ, Tomlinson SR. GeneProf: analysis of high-throughput sequencing experiments. Nat Methods 2012; 9:7–8; PMID:22205509; https://doi.org/10.1038/nmeth.1809
- Pilalis E, Koutsandreas T, Valavanis I, Athanasiadis E, Spyrou G, Chatziioannou A. KENeV: A web-application for the automated reconstruction and visualization of the enriched metabolic and signaling super-pathways deriving from genomic experiments. Comput Struct Biotechnol J 2015; 13:248–55; PMID:26925206; https://doi.org/10.1016/j.csbj.2015.03.009
- Wang J, Duncan D, Shi Z, Zhang B. WEB-based GEne SeT AnaLysis Toolkit (WebGestalt): update 2013. Nucleic Acids Res 2013; 41:W77–83; PMID:23703215; https://doi.org/10.1093/nar/gkt439
- Colella S, Shen L, Baggerly KA, Issa JP, Krahe R. Sensitive and quantitative universal Pyrosequencing methylation analysis of CpG sites. Biotechniques 2003; 35:146–50; PMID:12866414
- Lee RS, Tamashiro KL, Aryee MJ, Murakami P, Seifuddin F, Herb B, Huo Y, Rongione M, Feinberg AP, Moran TH, et al. Adaptation of the CHARM DNA methylation platform for the rat genome reveals novel brain region-specific differences. Epigenetics 2011; 6:1378–90; PMID:22048247; https://doi.org/10.4161/epi.6.11.18072
- Lee RS, Tamashiro KL, Yang X, Purcell RH, Harvey A, Willour VL, Huo Y, Rongione M, Wand GS, Potash JB. Chronic corticosterone exposure increases expression and decreases deoxyribonucleic acid methylation of Fkbp5 in mice. Endocrinology 2010; 151:4332–43; PMID:20668026; https://doi.org/10.1210/en.2010-0225
- Senturk A, Pfennig S, Weiss A, Burk K, Acker-Palmer A. Ephrin Bs are essential components of the Reelin pathway to regulate neuronal migration. Nature 2011; 472:356–60; PMID:21460838; https://doi.org/10.1038/nature09874
- Cejalvo T, Munoz JJ, Tobajas E, Fanlo L, Alfaro D, Garcia-Ceca J, Zapata A. Ephrin-B-dependent thymic epithelial cell-thymocyte interactions are necessary for correct T cell differentiation and thymus histology organization: relevance for thymic cortex development. J Immunol 2013; 190:2670–81; PMID:23408838; https://doi.org/10.4049/jimmunol.1201931
- Luo H, Charpentier T, Wang X, Qi S, Han B, Wu T, Terra R, Lamarre A, Wu J. Efnb1 and Efnb2 proteins regulate thymocyte development, peripheral T cell differentiation, and antiviral immune responses and are essential for interleukin-6 (IL-6) signaling. J Biol Chem 2011; 286:41135–52; PMID:21976681; https://doi.org/10.1074/jbc.M111.302596
- Shcheglovitov A, Shcheglovitova O, Yazawa M, Portmann T, Shu R, Sebastiano V, Krawisz A, Froehlich W, Bernstein JA, Hallmayer JF, et al. SHANK3 and IGF1 restore synaptic deficits in neurons from 22q13 deletion syndrome patients. Nature 2013; 503:267–71; PMID:24132240; https://doi.org/10.1038/nature12618
- Arons MH, Thynne CJ, Grabrucker AM, Li D, Schoen M, Cheyne JE, Boeckers TM, Montgomery JM, Garner CC. Autism-associated mutations in ProSAP2/Shank3 impair synaptic transmission and neurexin-neuroligin-mediated transsynaptic signaling. J Neurosci 2012; 32:14966–78; PMID:23100419; https://doi.org/10.1523/JNEUROSCI.2215-12.2012
- Peca J, Feliciano C, Ting JT, Wang W, Wells MF, Venkatraman TN, Lascola CD, Fu Z, Feng G. Shank3 mutant mice display autistic-like behaviours and striatal dysfunction. Nature 2011; 472:437–42; PMID:21423165; https://doi.org/10.1038/nature09965
- Durand CM, Betancur C, Boeckers TM, Bockmann J, Chaste P, Fauchereau F, Nygren G, Rastam M, Gillberg IC, Anckarsater H, et al. Mutations in the gene encoding the synaptic scaffolding protein SHANK3 are associated with autism spectrum disorders. Nat Genet 2007; 39:25–7; PMID:17173049; https://doi.org/10.1038/ng1933
- Han K, Holder JL, Jr, Schaaf CP, Lu H, Chen H, Kang H, Tang J, Wu Z, Hao S, Cheung SW, et al. SHANK3 overexpression causes manic-like behaviour with unique pharmacogenetic properties. Nature 2013; 503:72–7; PMID:24153177; https://doi.org/10.1038/nature12630
- Cadenas C, van de Sandt L, Edlund K, Lohr M, Hellwig B, Marchan R, Schmidt M, Rahnenfuhrer J, Oster H, Hengstler JG. Loss of circadian clock gene expression is associated with tumor progression in breast cancer. Cell Cycle 2014; 13:3282–91; PMID:25485508; https://doi.org/10.4161/15384101.2014.954454
- Mitsui S, Yamaguchi S, Matsuo T, Ishida Y, Okamura H. Antagonistic role of E4BP4 and PAR proteins in the circadian oscillatory mechanism. Genes Dev 2001; 15:995–1006; PMID:11316793; https://doi.org/10.1101/gad.873501
- Yu X, Rollins D, Ruhn KA, Stubblefield JJ, Green CB, Kashiwada M, Rothman PB, Takahashi JS, Hooper LV. TH17 cell differentiation is regulated by the circadian clock. Science 2013; 342:727–30; PMID:24202171; https://doi.org/10.1126/science.1243884
- Motomura Y, Kitamura H, Hijikata A, Matsunaga Y, Matsumoto K, Inoue H, Atarashi K, Hori S, Watarai H, Zhu J, et al. The transcription factor E4BP4 regulates the production of IL-10 and IL-13 in CD4+ T cells. Nat Immunol 2011; 12:450–9; PMID:21460847; https://doi.org/10.1038/ni.2020
- Gascoyne DM, Long E, Veiga-Fernandes H, de Boer J, Williams O, Seddon B, Coles M, Kioussis D, Brady HJ. The basic leucine zipper transcription factor E4BP4 is essential for natural killer cell development. Nat Immunol 2009; 10:1118–24; PMID:19749763; https://doi.org/10.1038/ni.1787
- Silva-Santos B, Pennington DJ, Hayday AC. Lymphotoxin-mediated regulation of gammadelta cell differentiation by alphabeta T cell progenitors. Science 2005; 307:925–8; PMID:15591166; https://doi.org/10.1126/science.1103978
- Newberry RD, McDonough JS, McDonald KG, Lorenz RG. Postgestational lymphotoxin/lymphotoxin beta receptor interactions are essential for the presence of intestinal B lymphocytes. J Immunol 2002; 168:4988–97; PMID:11994450; https://doi.org/10.4049/jimmunol.168.10.4988
- Muller P, Mannel DN, Hehlgans T. Functional characterization of the mouse lymphotoxin-beta receptor promoter. Eur Cytokine Netw 2001; 12:325–30; PMID:11399522
- Carey KT, Tan KH, Ng J, Liddicoat DR, Godfrey DI, Cole TJ. Nfil3 is a glucocorticoid-regulated gene required for glucocorticoid-induced apoptosis in male murine T cells. Endocrinology 2013; 154:1540–52; PMID:23425966; https://doi.org/10.1210/en.2012-1820
- Irizarry RA, Ladd-Acosta C, Wen B, Wu Z, Montano C, Onyango P, Cui H, Gabo K, Rongione M, Webster M, et al. The human colon cancer methylome shows similar hypo- and hypermethylation at conserved tissue-specific CpG island shores. Nat Genet 2009; 41:178–86; PMID:19151715; https://doi.org/10.1038/ng.298
- Davies MN, Volta M, Pidsley R, Lunnon K, Dixit A, Lovestone S, Coarfa C, Harris RA, Milosavljevic A, Troakes C, et al. Functional annotation of the human brain methylome identifies tissue-specific epigenetic variation across brain and blood. Genome Biol 2012; 13:R43; PMID:22703893; https://doi.org/10.1186/gb-2012-13-6-r43
- Polman JA, Welten JE, Bosch DS, de Jonge RT, Balog J, van der Maarel SM, de Kloet ER, Datson NA. A genome-wide signature of glucocorticoid receptor binding in neuronal PC12 cells. BMC Neurosci 2012; 13:118; PMID:23031785; https://doi.org/10.1186/1471-2202-13-118
- Polman JA, de Kloet ER, Datson NA. Two populations of glucocorticoid receptor-binding sites in the male rat hippocampal genome. Endocrinology 2013; 154:1832–44; PMID:23525215; https://doi.org/10.1210/en.2012-2187
- Mehta D, Klengel T, Conneely KN, Smith AK, Altmann A, Pace TW, Rex-Haffner M, Loeschner A, Gonik M, Mercer KB, et al. Childhood maltreatment is associated with distinct genomic and epigenetic profiles in posttraumatic stress disorder. Proc Natl Acad Sci U S A 2013; 110:8302–7; PMID:23630272; https://doi.org/10.1073/pnas.1217750110
- Liu L, Walker EA, Kissane S, Khan I, Murray PI, Rauz S, Wallace GR. Gene expression and miR profiles of human corneal fibroblasts in response to dexamethasone. Invest Ophthalmol Vis Sci 2011; 52:7282–8; PMID:21666241; https://doi.org/10.1167/iovs.11-7463
- Jones HN, Ashworth CJ, Page KR, McArdle HJ. Cortisol stimulates system A amino acid transport and SNAT2 expression in a human placental cell line (BeWo). Am J Physiol Endocrinol Metab 2006; 291:E596–603; PMID:16621896; https://doi.org/10.1152/ajpendo.00359.2005
- Piechota M, Korostynski M, Sikora M, Golda S, Dzbek J, Przewlocki R. Common transcriptional effects in the mouse striatum following chronic treatment with heroin and methamphetamine. Genes Brain Behav 2012; 11:404–14; PMID:22390687; https://doi.org/10.1111/j.1601-183X.2012.00777.x
- Torra IP, Tsibulsky V, Delaunay F, Saladin R, Laudet V, Fruchart JC, Kosykh V, Staels B. Circadian and glucocorticoid regulation of Rev-erbalpha expression in liver. Endocrinology 2000; 141:3799–806; PMID:11014236; https://doi.org/10.1210/endo.141.10.7708
- Bourchier D, Weston PJ. The effect of dexamethasone upon platelets and neutrophils of preterm infants with chronic lung disease. J Paediatr Child Health 1991; 27:101–4; PMID:1883647; https://doi.org/10.1111/j.1440-1754.1991.tb00361.x
- De Winter JP, Van Bel F. The effect of glucocorticosteroids on the neonatal blood count. Acta Paediatr Scand 1991; 80:159–62; PMID:2035306; https://doi.org/10.1111/j.1651-2227.1991.tb11827.x
- Golde DW, Bersch N, Cline MJ. Potentiation of erythropoiesis in vitro by dexamethasone. J Clin Invest 1976; 57:57–62; PMID:173742; https://doi.org/10.1172/JCI108269
- Parrillo JE, Fauci AS. Mechanisms of corticosteroid action on lymphocyte subpopulations. III. Differential effects of dexamethasone administration on subpopulations of effector cells mediating cellular cytotoxicity in man. Clin Exp Immunol 1978; 31:116–25; PMID:639343
- Peng CT, Lin HC, Lin YJ, Tsai CH, Yeh TF. Early dexamethasone therapy and blood cell count in preterm infants. Pediatrics 1999; 104:476–81; PMID:10469772; https://doi.org/10.1542/peds.104.3.476
- Anacker C, Cattaneo A, Luoni A, Musaelyan K, Zunszain PA, Milanesi E, Rybka J, Berry A, Cirulli F, Thuret S, et al. Glucocorticoid-related molecular signaling pathways regulating hippocampal neurogenesis. Neuropsychopharmacology 2013; 38:872–83; PMID:23303060; https://doi.org/10.1038/npp.2012.253
- Zhang L, Lei W, Wang X, Tang Y, Song J. Glucocorticoid induces mesenchymal-to-epithelial transition and inhibits TGF-beta1-induced epithelial-to-mesenchymal transition and cell migration. FEBS Lett 2010; 584:4646–54; PMID:20971111; https://doi.org/10.1016/j.febslet.2010.10.038
- Reinius LE, Acevedo N, Joerink M, Pershagen G, Dahlen SE, Greco D, Soderhall C, Scheynius A, Kere J. Differential DNA methylation in purified human blood cells: implications for cell lineage and studies on disease susceptibility. PLoS One 2012; 7:e41361; PMID:22848472; https://doi.org/10.1371/journal.pone.0041361
- Nemzek JA, Bolgos GL, Williams BA, Remick DG. Differences in normal values for murine white blood cell counts and other hematological parameters based on sampling site. Inflamm Res 2001; 50:523–7; PMID:11713907; https://doi.org/10.1007/PL00000229
- Horvath S, Zhang Y, Langfelder P, Kahn RS, Boks MP, van Eijk K, van den Berg LH, Ophoff RA. Aging effects on DNA methylation modules in human brain and blood tissue. Genome Biol 2012; 13:R97; PMID:23034122; https://doi.org/10.1186/gb-2012-13-10-r97
- Hernandez DG, Nalls MA, Gibbs JR, Arepalli S, van der Brug M, Chong S, Moore M, Longo DL, Cookson MR, Traynor BJ, et al. Distinct DNA methylation changes highly correlated with chronological age in the human brain. Hum Mol Genet 2011; 20:1164–72; PMID:21216877; https://doi.org/10.1093/hmg/ddq561
- Surjit M, Ganti KP, Mukherji A, Ye T, Hua G, Metzger D, Li M, Chambon P. Widespread negative response elements mediate direct repression by agonist-liganded glucocorticoid receptor. Cell 2011; 145:224–41; PMID:21496643; https://doi.org/10.1016/j.cell.2011.03.027
- Chen KC, Blalock EM, Curran-Rauhut MA, Kadish I, Blalock SJ, Brewer L, Porter NM, Landfield PW. Glucocorticoid-dependent hippocampal transcriptome in male rats: pathway-specific alterations with aging. Endocrinology 2013; 154:2807–20; PMID:23736296; https://doi.org/10.1210/en.2013-1139
- Sharma D, Bhave S, Gregg E, Uht R. Dexamethasone induces a putative repressor complex and chromatin modifications in the CRH promoter. Mol Endocrinol 2013; 27:1142–52; PMID:23671328; https://doi.org/10.1210/me.2013-1079
- Glass CK, Saijo K. Nuclear receptor transrepression pathways that regulate inflammation in macrophages and T cells. Nat Rev Immunol 2010; 10:365–76; PMID:20414208; https://doi.org/10.1038/nri2748
- Lie DC, Colamarino SA, Song HJ, Desire L, Mira H, Consiglio A, Lein ES, Jessberger S, Lansford H, Dearie AR, et al. Wnt signalling regulates adult hippocampal neurogenesis. Nature 2005; 437:1370–5; PMID:16251967; https://doi.org/10.1038/nature04108
- Smith E, Frenkel B. Glucocorticoids inhibit the transcriptional activity of LEF/TCF in differentiating osteoblasts in a glycogen synthase kinase-3beta-dependent and -independent manner. J Biol Chem 2005; 280:2388–94; PMID:15537647; https://doi.org/10.1074/jbc.M406294200
- Mishler JM, Emerson PM. Development of Neutrophilia by serially increasing doses of dexamethasone. Br J Haematol 1977; 36:249–57; PMID:871436; https://doi.org/10.1111/j.1365-2141.1977.tb00646.x
- Fauci AS, Dale DC. The effect of in vivo hydrocortisone on subpopulations of human lymphocytes. J Clin Invest 1974; 53:240–6; PMID:4808638; https://doi.org/10.1172/JCI107544
- Maras PM, Molet J, Chen Y, Rice C, Ji SG, Solodkin A, Baram TZ. Preferential loss of dorsal-hippocampus synapses underlies memory impairments provoked by short, multi-modal stress. Mol Psychiatry 2014; 19:745; PMID:24969262; https://doi.org/10.1038/mp.2014.64
- Dorey R, Pierard C, Chauveau F, David V, Beracochea D. Stress-induced memory retrieval impairments: different time-course involvement of corticosterone and glucocorticoid receptors in dorsal and ventral hippocampus. Neuropsychopharmacology 2012; 37:2870–80; PMID:22948976; https://doi.org/10.1038/npp.2012.170
- Halder R, Hennion M, Vidal RO, Shomroni O, Rahman RU, Rajput A, Centeno TP, van Bebber F, Capece V, Garcia Vizcaino JC, et al. DNA methylation changes in plasticity genes accompany the formation and maintenance of memory. Nat Neurosci 2016; 19:102–10; PMID:26656643; https://doi.org/10.1038/nn.4194
- Peng X, Wood CL, Blalock EM, Chen KC, Landfield PW, Stromberg AJ. Statistical implications of pooling RNA samples for microarray experiments. BMC Bioinformatics 2003; 4:26; PMID:12823867; https://doi.org/10.1186/1471-2105-4-26
- Kendziorski C, Irizarry RA, Chen KS, Haag JD, Gould MN. On the utility of pooling biological samples in microarray experiments. Proc Natl Acad Sci U S A 2005; 102:4252–7; PMID:15755808; https://doi.org/10.1073/pnas.0500607102
- Wang JC, Derynck MK, Nonaka DF, Khodabakhsh DB, Haqq C, Yamamoto KR. Chromatin immunoprecipitation (ChIP) scanning identifies primary glucocorticoid receptor target genes. Proc Natl Acad Sci U S A 2004; 101:15603–8; PMID:15501915; https://doi.org/10.1073/pnas.0407008101
- Niwa M, Jaaro-Peled H, Tankou S, Seshadri S, Hikida T, Matsumoto Y, Cascella NG, Kano S, Ozaki N, Nabeshima T, et al. Adolescent stress-induced epigenetic control of dopaminergic neurons via glucocorticoids. Science 2013; 339:335–9; PMID:23329051; https://doi.org/10.1126/science.1226931
- Jankord R, Solomon MB, Albertz J, Flak JN, Zhang R, Herman JP. Stress vulnerability during adolescent development in rats. Endocrinology 2011; 152:629–38; PMID:21106877; https://doi.org/10.1210/en.2010-0658
- Kriaucionis S, Heintz N. The nuclear DNA base 5-hydroxymethylcytosine is present in Purkinje neurons and the brain. Science 2009; 324:929–30; PMID:19372393; https://doi.org/10.1126/science.1169786
- Song CX, Yi C, He C. Mapping recently identified nucleotide variants in the genome and transcriptome. Nat Biotechnol 2012; 30:1107–16; PMID:23138310; https://doi.org/10.1038/nbt.2398