
ABSTRACT
We recently showed that, after optimization, our methyl-CpG binding domain sequencing (MBD-seq) application approximates the methylome-wide coverage obtained with whole-genome bisulfite sequencing (WGB-seq), but at a cost that enables adequately powered large-scale association studies. A prior drawback of MBD-seq is the relatively large amount of genomic DNA (ideally >1 µg) required to obtain high-quality data. Biomaterials are typically expensive to collect, provide a finite amount of DNA, and may simply not yield sufficient starting material. The ability to use low amounts of DNA will increase the breadth and number of studies that can be conducted. Therefore, we further optimized the enrichment step. With this low starting material protocol, MBD-seq performed equally well, or better, than the protocol requiring ample starting material (>1 µg). Using only 15 ng of DNA as input, there is minimal loss in data quality, achieving 93% of the coverage of WGB-seq (with standard amounts of input DNA) at similar false/positive rates. Furthermore, across a large number of genomic features, the MBD-seq methylation profiles closely tracked those observed for WGB-seq with even slightly larger effect sizes. This suggests that MBD-seq provides similar information about the methylome and classifies methylation status somewhat more accurately. Performance decreases with <15 ng DNA as starting material but, even with as little as 5 ng, MBD-seq still achieves 90% of the coverage of WGB-seq with comparable genome-wide methylation profiles. Thus, the proposed protocol is an attractive option for adequately powered and cost-effective methylome-wide investigations using (very) low amounts of DNA.
Introduction
DNA methylation is essential for normal cell functioning, and aberrant methylation has been associated with a wide variety of human diseases.Citation1 Because detailed biologic knowledge is typically lacking, methylome-wide association studies (MWAS) involving all 28 million common CpGs in the human genome are critical to identify methylation-phenotype associations.Citation2,3 The most comprehensive method for assaying the methylome is whole-genome bisulfite sequencing (WGB-seq).Citation4 However, due to the high costs, WGB-seq is not yet economically feasible for the large number of samples required for adequately powered MWAS.Citation5
Arrays or restricted representation bisulfite sequencing can be used to interrogate the methylome at a price point that does enable large-scale studies but the proportion of common CpG sites assayed is typically small and restricted to specific genomic regions. For example, the commonly used methylation arrays (e.g., Illumina 450K or 850K) comprise 2 to 3% of all 28 million CpGs, and even the most comprehensive restricted bisulfite method assays (see Table 2 inCitation6) only about 15% (RRBS) to 19% (Nimblegen-MethSeq).Citation6 The obvious risk of such low-coverage screening methods is the potential to miss numerous signals of critical etiological and clinical importance.
Enrichment methods represent an alternative group of methods to assay the methylome. With these approaches, genomic DNA is first fragmented and the methylated fragments are then captured by methyl-binding proteins (e.g., MBD2, MECP2) or antibodiesCitation7,8 with high affinity for methylated DNA. The non-methylated fraction is then washed away and the methylation-enriched fraction of the genome is sequenced.Citation8-10 We have previously shown that enrichment based on methyl-CG binding domain proteins outperforms antibody-based methylated DNA immunoprecipitation (MeDIP)Citation11 and can achieve 94% of the coverage of whole-genome bisulfite sequencing at approximately the same cost of commonly used methylation arrays.Citation11 However, performance of methyl-CG binding domain enrichment sequencing (MBD-seq) critically depends on the use of an optimized protocol. First, an evaluation of kits with different (combinations of) MBD proteins revealed superior results when using MBD2 protein as provided in the MethylMiner Kit (Invitrogen).Citation12 Second, in the human genome, the majority of CpGs have <5 CpGs nearby.Citation12 These low CpG density regions are typically hard to assay by enrichment methods.Citation10 However, by performing a single elution with a low-salt buffer, rather than a single or sequential elution with higher salt concentrations, MBD enrichment can be made more sensitive to methylated fragments from these regionsCitation11,13 Third, for enrichment efficiency, it is important to use the shortest possible DNA fragments that are “lighter” (i.e., have a smaller molecular weight) and therefore easier to extract. Finally, with enrichment methods, the number of sequenced fragments covering a CpGCitation13 quantifies the amount of methylation. The accuracy of this “CpG score” is determined by the number of sequenced fragments. To maximize the number of fragments that can be sequenced at a given cost, single-end libraries with short reads, rather than paired-end libraries with long reads, should be used because they are both less expensive and faster to sequence.Citation11
We have previously observed that the quality of the MBD-seq data generated when performing MBD-enrichment using the vendor provided protocol starts to decrease when <1 μg of genomic DNA is used.Citation14 This is a disadvantage, as human biomaterials are typically expensive to collect and present a finite source of DNA. In other scenarios, the amount of starting material may be too low to begin with. Examples include small biopsies, fine dissections of rodent tissue, human bloodspots, DNA from sorted cells or tissue that is left over from clinical samples. Thus, the possibility to use as little starting material as possible would greatly enhance the breadth and number of studies that can be conducted.
To preserve material, whole-genome amplification is not an option for enrichment-based methylation studies because the methylation marks are lost if DNA is amplified. The goal of this paper is therefore to further adapt the enrichment step of our MBD-seq application to allow for (very) low amounts of starting material. A key adaption for this purpose is to optimize the ratio of protein-coated beads (used to capture the methylated fragments) to the amount of genomic DNA. That is, MBD enrichment is affected by the total amount of methylation present on the DNA fragments, which is a function of the number of CpGs and how many of them are methylated. If the amount of protein is low, highly methylated fragments will be overrepresented in the enrichment, and if the amount of protein is too high, non-specific binding will occur.
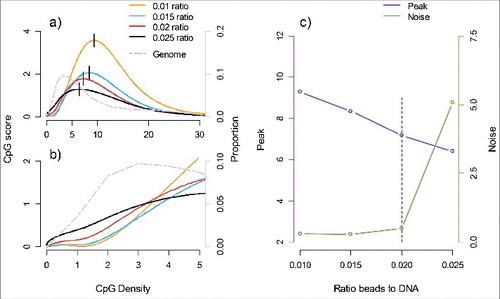
In , we used prior (unpublished) MBD-seq data generated using DNA from a different sample/tissue than what is used for the main analyses. The gray line in (panels a and b) represents the distribution of CpG density in the genome. As the majority of genomic regions are relatively CpG poor, for good methylome-wide coverage the enrichment needs to be able to extract fragments with (very) few methylated sites. In (panels a and b), we also plotted the average number of fragments covering CpGs (the “CpG score”) against the average number of CpGs per fragment (the “CpG density”). The plot shows that fragment coverage is relatively low for CpG-poor regions, peaks in moderately dense regions, and then decreases again for highly dense regions. To characterize these distributions, we use the term “peak” which is the CpG density at the point where the CpG score is the highest. , illustrate that this peak sensitivity can be controlled to better match the distribution in the genome (gray line) by altering the ratio of protein-coated beads to the amount of genomic DNA (μL beads per ng DNA). However, the more sensitive the enrichment becomes, the more likely unmethylated fragments will be extracted , thereby increasing “noise.” The optimal ratio balances the competing need of sensitivity to a low number of methylation sites (small peak) while avoiding excess noise ().
Figure 1. Peak sensitivity and noise as a function of the ratio of protein coated beads to the amount of genomic DNA (μL of beads to ng DNA). a) The CpG score (average number of fragments covering CpGs) is plotted on the left y-axis against the CpG density (number of CpGs per fragment) on the x-axis. The location of each distribution is indicated by the short vertical line at the maximum CpG score that we label “peak.” The gray line represents the proportion of CpGs (right y-axis) for a given CpG density (x-axis) in the genome. b) The same graph as is presented in (a) but here zoomed in to better visualize the region with low CpG density to illustrate how differences in peak affect the coverage of low CpG density regions that are most common in the genome. c) The bead to DNA ratios (x-axis) are plotted against the peak (left y-axis) and noise (right y-axis). Noise is measured as the ratio of fragment coverage of a set of genomic locations away from CpGs, so-called non-CpGs, vs. average coverage of CpGs. The dashed vertical line indicates a potential optimum consisting of a small peak (and hence better coverage of low CpG dense regions) and also low noise levels.
For this study, we first optimized a MBD-enrichment protocol for low amounts of starting material, which included experiments to determine beads to DNA ratio as well as optimal incubation conditions and buffer concentrations that provides a good balance between methylome-wide coverage and noise. To evaluate this low starting material protocol, we compare results with data generated previouslyCitation11 using WGB-seq as well as our MBD-seq protocol that required >1 μg of starting material. All assays were performed in duplicate using DNA from post-mortem brain tissue obtained from the same subject.
Results
Tables S1 and S2 provide descriptive statistics including conversion control information. In summary, for WGB-seq, we previously obtained a median of 774 million 150-bp reads (387 million read pairs) per sample, with 66.9% of the read pairs mapped successfully. For MBD-seq, with 1500 ng DNA as starting material, we obtained 84.6 million 75-bp reads per sample, of which 99.6% aligned. This much lower mapping rate for WGB-seq has mainly to do with lower complexity of the bisulfite-converted genome (i.e., the majority of Cs are converted to Ts due to their unmethylated status; therefore, we need to align reads to a reference genome with 3 rather than 4 bases). For this study, we used our new optimized low starting material protocol to generate MBD-seq data, in duplicate, using DNA from the same subject/tissue for 6 conditions with 50 ng, 30 ng, 20 ng, 15 ng, 10 ng, and 5 ng of input DNA, respectively. Across duplicates and conditions, we obtained 82.8 million 75 bp reads per low-input sample, of which 99.1% aligned. After quality control, on average 84.8% of the original reads remained for statistical analysis.
Low starting material protocol improves the sensitivity and specificity
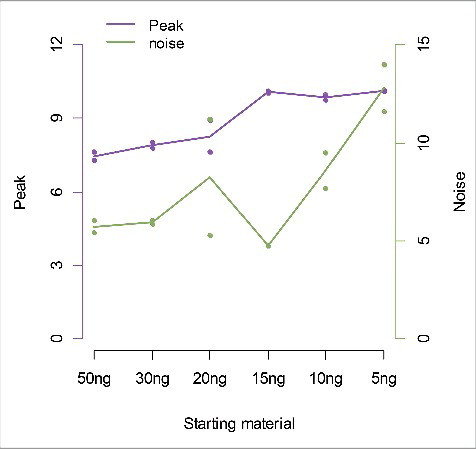
shows the balance between peak and noise when using the optimized low starting material protocol. That is, when using a beads to DNA ratio of 0.02 µL prepared beads per ng DNA (which corresponds to 7 ng protein per ng DNA), the peak sensitivity was very stable and about the same regardless of the amount of starting material. However, with less than 15 ng DNA, the noise (here measured as the ratio of fragment coverage of a set of genomic locations away from CpGs, so-called non-CpGs, vs. average coverage of CpGs) increases.
Figure 2. Peak sensitivity and noise across conditions with different amounts of starting material. The amount of starting material (x-axis) is plotted against the peak (left y-axis) and noise (right y-axis). For each amount of starting material we use the same bead to DNA ratio of 0.02.
To evaluate MBD-seq when using the optimized low starting material protocol, we calculated its sensitivity (proportion of methylated loci detected) and specificity (proportion of non-methylated loci detected). The WGB-seq data was used to determine methylation status of CpGs in question. This underestimates the MBD-seq sensitivity/specificity because a subset of the loci will be misclassified due to measurement error in the bisulfite data. For this reason, we used the sensitivity/specificity between bisulfite duplicates, as a benchmark against which to compare the MBD-seq results. As the MBD-enrichment is affected by the total amount of methylation occurring across the DNA fragment, the CpG score is not entirely site specific. To obtain a comparable measure for WGB-seq, we summed the WGB-seq estimated methylation levels across all CpGs in the fragment-sized region surrounding the target CpG before estimating methylation status.
As reported previously, the MBD-enrichment protocol for ample starting material showed that the sensitivity of MBD-seq is close to the sensitivity of WGB-seq, and that MBD-seq specificity was generally better.Citation11 shows that the new optimized protocol for low starting material has similar performance. For example, when using 15 ng DNA as input and a MBD score threshold of 1 (i.e., classifying sites covered by one or more fragments as methylated), the specificity for MBD-seq (solid yellow line) equals the specificity of WGB-seq (the dashed yellow line). At this threshold, which results in equal specificity, the sensitivity for MBD-seq is 0.93 (the value on the y-axis for the solid blue line). Therefore, at a MBD score threshold of 1, MBD-seq detected 93% of the methylated loci that were reliably detected by WGB-seq, while correctly classifying the same proportion of non-methylated sites.
Figure 3. Sensitivity and specificity of MBD-seq. The blue lines represent sensitivity (proportion of methylated loci correctly detected) and the yellow lines specificity (proportion of non-methylated loci correctly detected). The (horizontal) dashed lines represent WGB-seq and (curved) solid lines MBD-seq. The y-axis indicates the estimated sensitivity/specific and the x-axis CpG score cut-offs used to determine methylation status according to the MBD-seq data. The first plot shows results for existing MBD-seq protocol using 1500 ng starting material. The other plots involve the low starting material protocol with amount of input DNA of 50 ng, 30 ng, 20 ng, 15 ng, 10 ng, and 5 ng.
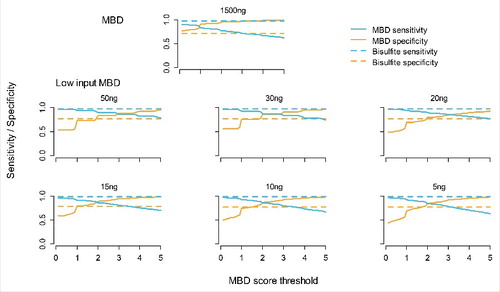
When comparing the 6 conditions for the low starting material protocol, shows that with lower amounts of starting material, performance starts to decrease slightly where the magnitude of the loss in sensitivity was somewhat related to the amount of input DNA. However, even with as little as 5 ng DNA, relative to WGB-seq, sensitivity still was 0.90 at equal levels of specificity.
We also studied the rank correlations between the data from each of the enrichment protocols and the WGB-seq estimated methylation (Table S3). To obtain a benchmark against which to compare the MBD-seq results, we first calculated the correlation between the WGB-seq duplicates, which was 0.97. Relative to these WGB-seq duplicate correlations, correlations for the low starting material protocol where on average very similar (ranging from 0.73 to 0.86) to the 0.8 observed with the ample starting material. As previously reported, correlations of this strength provide additional support for using MBD-seq in MWAS, as it means that differences in methylation levels caused by phenotype can be detected as differences in MBD-seq coverage estimates.Citation11
Strong similarity in the genome-wide methylation profiles
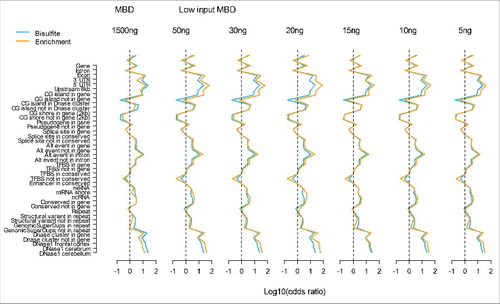
To study whether the MBD-seq approach using different amounts of starting material yielded similar genome-wide methylation profiles, we used a set of 41 genomic features (full list of features is provided in Table S4). For each genomic feature, we created a 2 by 2 table cross-classifying methylated status (present/absent) and feature status (absent/present). Using these 2 by 2 tables as input, we calculated odds ratios that indicated whether CpG sites in the studied featured were more likely methylated compared with CpG sites not in this feature. To improve visualization we plotted the log10 of the odds ratio in . Therefore, a value of zero (log10(1) = 0), indicated by the dashed lines in the figure, means no enrichment of methylated sites. The enrichment profiles across genomic features were very similar for WGB-seq, and our previously optimized MBD-seq protocol for ample amounts of starting material ().Citation11 This suggested that both technologies captured comparable methylation information. In agreement to what we observed for sensitivity/specificity, the low starting material protocol performed slightly better than the existing MBD protocol. Furthermore, odds ratios for the low starting material protocol (mean = 8.7, median = 3.6) were consistently better than those for WGB-seq (mean = 5.5, median = 2.9). This is unlikely due to sampling variation because the effects were in the same direction in all starting material conditions. Instead, it suggests that MBD-seq outperformed WGB-seq in terms of more accurately classifying methylation status. Using mixed modeling to account for clustering within conditions, the difference was not significant (P = 0.18). However, this could be the result of the modest power of the test (41 odds ratios from the WGB-seq are compared with 6 × 41 odds ratios in the low starting material conditions).
Figure 4. Methylation profiles across genomic features. The blue lines represent WGB-seq and the yellow lines MBD-seq enrichment profiles. The y-axis show the genomic feature tested and the x-axis the log10 of the odds ratio calculated from the 2 by 2 tables where loci were classified as methylated vs. non-methylated and genomic features as present vs. absent. The first plot shows results for our previously MBD-seq protocol (MBD) using 1500 ng starting material. The following plots involve the low starting material protocol (Low input MBD) with amount of input DNA of 50 ng, 30 ng, 20 ng, 15 ng, 10 ng, and 5 ng.
Discussion
We further improved our MBD-seq application by optimizing the MBD-enrichment protocol to allow for (very) low amounts of starting material. The low starting material protocol performed equally well or better than the previously reported protocol requiring ample amounts (>1 µg) of starting material.Citation11 Using only 15 ng genomic DNA as input, there is barely any loss in methylomic information and we achieve 93% of the coverage of WGB-seq (sensitivity) at similar levels of false positive rates (specificity). The MBD-seq methylation profiles closely track patterns observed in the bisulfite data across a variety of genomic features where effect sizes are somewhat larger. This suggests that our low starting material MBD protocol provides similar information about the methylome, where it classifies methylation status somewhat more accurately. MBD-seq performance decreases with lower amounts of starting material but, even with as little as 5 ng DNA, MBD-seq achieves 90% of the coverage of WGB-seq with comparable genome-wide methylation profiles.
A key modification to our MBD-enrichment protocol for low amounts of starting material is an altered ratio of protein-coated beads to the amount of genomic DNA. To balance the methylome-wide coverage and noise, we also modified the buffer salt concentrations and the incubation conditions. The reason that the low starting material protocol outperforms the previously reported MBD protocol is likely that this fine-tuning of the ratio would be beneficial for even high amounts of input DNA. With very low amounts of input DNA accurately obtaining this ratio is more challenging. First, accurate quantification of input DNA is critical. The MBD2 protein used for enrichment only binds double stranded DNA (dsDNA) and, therefore, the DNA should be measured with a technique that only detects dsDNA (e.g., fluorometric assay). Importantly, fragmentation of input DNA via sonication can introduce single-stranded overhangs, which can lead to errors in dsDNA assays. Therefore, we first quantify the concentration of input DNA before fragmentation, so that bead ratios are based on intact genomic DNA. Second, the quality of the protein-coated beads is important. For example, we notice that the use of older (but not expired) previously thawed reagents somewhat negatively impacts data quality, likely due to decreased binding ability of the protein.
MBD-seq assays the total amount of methylation for loci that are about the size of the sequenced fragments. Therefore, in contrast to WGB-seq, it cannot pinpoint the specific site that caused the MWAS signal, as it does not provide a single CpG site resolution for methylome studies. However, the resolution is still high on a genomic scale (e.g., ∼150 bp in this study when estimated from the sequencing dataCitation13), and MWAS findings can always be followed up using a targeted bisulfite approach (such as, for example, pyrosequencing). We should note that co-methylation (clusters of CpG sites with similar methylation levels) occur within the fragment-size loci.Citation11 Thus, bisulfite methods may often not be able to substantially improve the resolution of MBD-seq MWAS findings.
Methylome-wide association studies (MWAS) have the potential to make unique contributions to our understanding of disease etiology, as well as to identify new drug targets and biomarkers that can improve treatment in the clinic. However, the majority of MWAS studies suffer either from poor genome-wide coverage of methylation sites (e.g., commonly used array based studies typically cover 2-3% of all 28 million common CpGs) or insufficient statistical power (e.g., whole-genome bisulfite-based sequencing is not economically feasible for a large number of samples).Citation11 To allow for the use of (very) low amounts starting material, we introduce further adaptations to our MBD-seq application. These adaptions double the amount of methyl-binding protein used (typically the limiting reagent in the enrichment kit) for any specific amount of DNA, but the ability to perform the enrichment with a decreased amount of starting material compensates for the added cost of the protein. That is, when less than 50% of the lowest amount DNA recommended to use for the ample starting material protocol (i.e., less than 500 ng) is used, the cost per sample is decreased as compared with the protocol for ample amounts of starting material. However, it should be noted that the enrichment component constitutes only a small portion of the complete cost for MBD-seq. The improved protocol, allowing for (very) low amounts of starting material, will increase the number and breadth of methylome-wide investigations that can be conducted with MBD-seq. The low starting material protocol outperforms the existing optimized protocol. It also rivals the methylome-wide coverage and reliability of whole-genome bisulfite sequencing but at a price point that enables large-scale studies. Therefore, this proposed protocol is a viable option for adequately powered and cost-effective methylome-wide investigations across a wide variety of research scenarios.
Methods
Sample, DNA extraction and fragmentation
Postmortem brain tissue (Brodmann area 10) originated from a 49 y old Caucasian female. The tissue was dissected by a neuropathology technician, snap-frozen, and then stored at –80°C. Tissue was collected by the Douglas Bell-Canada Brain Bank that obtains informed consent from next of kin.
Human brain tissue (100 mg) was homogenized in Buffer RTL (Qiagen, # 79216) with a 1 mL syringe fitted with a 20G needle. Genomic DNA was extracted from the homogenate using the AllPrep DNA/RNA/miRNA Universal Kit (Qiagen, # 80224). Purity of extracted DNA was assessed by NanoDrop and concentration was measured using Qubit dsDNA HS Assay. Next, genomic DNA was fragmented to 100-150 bp using a Covaris S2 Ultra-sonicator (10 cycles, 1 cycle per burst, 60 sec, 10% duty cycle, intensity 5.0), as described previously.Citation11
MBD-seq
The MBD-enrichment for ample amounts of starting material (1500 ng DNA) was performed as described previously.Citation11,14 For the MBD-enrichment protocol for low starting material, we fragmented DNA as described previously,Citation11 and again used components of the MethylMiner™ Kit (Invitrogen) to enrich for fragments with methylated CpGs (mCpG). Each enrichment reaction, in duplicate, included 50, 30, 20, 15, 10, or 5 ng DNA, as calculated based on the pre-fragmentation measure of intact genomic DNA. This low starting material protocol, which uses a higher bead to DNA ratio (0.02 µL per ng input DNA) and increased incubation time gives a methylation profile with a smaller peak than achieved with the vendor's standard ratio (0.01) and 1 h incubation. To counteract the possibility for increased unspecific binding, i.e., more noise, we used more stringent wash conditions.
In more detail, for each capture reaction, 0.02 µL of prepared MBD-beads (10 μg beads per µL; 350 ng MBD-biotin protein per µL) was added for each 1 ng of fragmented DNA input. Prepared MBD-beads were diluted in 1x in Bind/Wash Buffer before addition to each DNA sample to increase pipetting accuracy. Each capture reaction was brought up to 200 µL final volume in 1x Bind-Wash Buffer, and incubated for 2 h at room temperature, on an orbital shaker at 650 rpm.
Following incubation, the plate was placed on a magnet for 1 min and the supernatant containing the non-captured (unmethylated) fraction was removed. The beads with bound methylated DNA were then washed twice by incubation with 200 µL of 250 mM NaCl Wash Buffer (12.5% High Salt Elution Buffer, 87.5% Low Salt Elution Buffer v/v) for 3 min at room temperature on an orbital shaker at 650 rpm. Compared to the standard wash (∼160 mM NaCl), we used these more stringent wash conditions to counteract the possibility of increased unspecific binding, i.e., more noise.
After the second wash, the methylated DNA was liberated from the beads with 2 treatments of a 500 mM NaCl Elution Buffer (25% High Salt Elution Buffer, 75% Low Salt Elution Buffer v/v), following the same incubation conditions as the wash steps. Both elution fractions were pooled and purified by ethanol precipitation.
The MBD enriched fractions from the ample and the low starting material protocols were used to generate indexed libraries with the Accel-NGS 2S DNA Library Kit (Swift Biosciences). Libraries were size-selected using SPRI beads to obtain a mean insert size of 150 bp. The 75-bp single-end libraries were then pooled and sequenced on the NextSeq 500 using High-Output v2 chemistry (Illumina). Reads were aligned (build hg19/GRCh37) with Bowtie215 using a seed-and-extend approach combined with local alignment while allowing for gaps. Specifically, we used a 20 bp seed with zero mismatches. Rather than considering the entire read, local alignment was used to improve sensitivity by finding the maximum similarity score between the reference sequence and a substring of the extension that may be “trimmed” at both ends. Gaps were allowed to account for small indels.
Data was further processed using RaMWASCitation16 (www.bioconductor.org/packages/ramwas/), an R/Bioconductor pipeline for large-scale analyses of methylation data from enrichment platforms. Only the primary alignment for each read is used. RaMWAS allows further quality control on the mapping quality using either the default MAPQ value or alignment score indicated by the optional AS tag in the SAM/BAM file format.Citation17 Here, we used a threshold of 100 for Bowtie2s alignment score. Duplicate-reads are reads that start at the same nucleotide positions. When sequencing a whole genome, duplicate-reads often arise from template preparation or amplification artifacts. In our context of sequencing an enriched genomic fraction, duplicate-reads are increasingly likely to occur because reads align to a much smaller fraction of the genome. RaMWAS allows the user to define a threshold for the number of reads starting at the same position and limits the read count to this threshold (implicitly assuming that these reads are all tagged a single clonal fragment) in cases where this threshold is exceeded. For this step we applied a threshold of 3.
A natural way to quantify methylation with enrichment methods is to count the number of fragments covering a CpG site. However, with single-end libraries the fragment sizes are not observed. Counting the number of reads instead, seriously underestimates the methylation score, as the sequenced fragment is usually longer than the read. RaMWAS therefore first uses a non-parametric approach to estimate the fragment size distribution from the sequencing data using isolated CpGs.Citation13 The fragment size distribution is used to calculate the probability that a sequenced fragment will cover the CpG site under consideration. For example, this probability is 1.0 for fragments with reads starting within one read-length of the CpG, but is ≤ 1.0 for fragments with reads starting more than one read-length away. The CpG score is then calculated by taking the sum of probabilities for all fragments aligning within proximity of the CpG.
Whole-genome bisulfite sequencing
MBD enrichment strictly captures methylated CpGs (mCpG). In contrast, regular bisulfite sequencing detects both mCpG and hydroxymethylation (hmCpG) but cannot distinguish between the 2. That is, the sodium bisulfite treatment converts non-methylated cytosines to uracil but leaves methylated cytosines intact.Citation18 The genome therefore needs to be sequenced a second time, using a sample preparation such as TET-assisted bisulfite (TAB) conversion,Citation19 which leaves only hydroxymethylated sites unconverted. Estimates of mCpG can then be obtained by simply subtracting the estimates obtained from TAB-converted DNA from the estimated from bisulfite-converted DNA. We refer to these estimates as WGB-seq estimates.
The WGB-seq data used for our current analyses have been described previously.Citation11 In short, genomic DNA was sonicated to 550 bp using a Covaris S2 Ultra-sonicator. To convert non-methylated cytosines to uracil, 200 ng fragmented DNA was bisulfite converted with the EZ DNA Methylation-Lightning™ Kit (Zymo Research). In parallel, we performed TAB conversion with the 5hmC TAB-seq Kit (WiseGene) followed by the EZ DNA Methylation-Lightning™ Kit (Zymo Research), which leaves only hydroxymethylated sites unconverted. Conversion and protection rates for these samples have been previously reportedCitation11 and are summarized in Table S1.
We used the Accel-NGS™ Methyl-Seq DNA Library Kit (Swift Biosciences) to create indexed Illumina libraries directly from the bisulfite- and TAB-converted DNA. Libraries were pooled with PhiX (15%) to compensate for lowered cytosine signal and 2 × 150-bp paired-end sequenced on an Illumina NextSeq 500 using v2 chemistry.
BS-Seeker220 was used to align data and call methylation levels. BS-Seeker2 converts both reads and reference to align reads (build hg19/GRCh37) in a 3-letter base space using Bowtie2.Citation15 We used local (removing terminal mismatches from the reads) and gapped alignment (allowing small indels) to increase mapping rates.Citation20 The local alignment algorithm also automatically truncates adaptor sequences. The maximum number of mismatches allowed per read was 3. Only successfully mapped read-pairs were used to call methylation levels with correction for overlaps between read-pairs. To avoid unreliable estimates, for the bisulfite data we used methylation calls that were based on 5 or more sequencing reads.
Evaluation of MBD-seq with low amounts of starting material
To quantify methylation with MBD-seq, we use the number of fragments covering a CpG.Citation13 As this CpG score is also affected by the methylation statuses of nearby sites, it reflects the total amount of local methylation rather than CpG specific methylation. To obtain a comparable measure for WGB-seq, we summed the WGB-seq estimated methylation levels across CpGs in the fragment-sized region surrounding the target. Specifically, the methylation sum of a target CpG (Y) was calculated as a weighted sum of the methylation at all CpGs (X) in the region surrounding Y, with weights for each CpG equal to the probability that fragments covering Y also cover X. For example, whereas CpGs near to Y will have a weight close to one, because they will almost always be covered by the same fragments, the weights will be zero for sites located at a distance larger than the maximum fragment size. To calculate the weights, we needed the fragment size distribution, which was estimated from the MBD-seq data using a method outlined elsewhere.Citation13
We calculated the sensitivity (proportion of methylated loci correctly detected by MBD-seq) and specificity (proportion of non-methylated loci correctly identify by MBD-seq) of the MBD-seq. WGB-seq data was used to determine whether loci were methylated or non-methylated. For this purpose, we created a histogram of the mean methylation levels of all loci that shows a mixture of 2 distributions. The modus of the first distribution was close to zero suggesting this distribution captured loci without methylated CpGs and the modus of the second distribution was closer to one suggesting loci containing methylated CpGs. Using the inflection point as a threshold, we estimated that 92.4% of all loci contained methylated sites. Next, sensitivity/specificity was calculated for a range of CpG score cut-offs using the mean of the 4 possible duplicate combinations (e.g., MBD-seq assay 1 or 2 vs. WGB-seq assay 1 or 2). For the WGB-seq data, we used methylation calls that were based on 5 or more sequencing reads. This yields conservative estimates of the relative performance of MBD-seq, as WGB-seq was not penalized for CpGs omitted for not passing this QC filter.
We studied methylation across a variety of genomic features downloaded from the UCSC genome annotation database (human genome build hg19). Using the method described in the previous paragraph, we first classified loci as methylated vs. non-methylated. Next, we calculated odds ratios to study whether sites located in the studied feature were more likely to be methylated compared with sites not in this feature. In these analyses, it is important to select the genomic region used for comparisons carefully. To illustrate the reasoning, assume testing whether CpGs in exons are methylated using the “rest of the genome” as the background. Assume that methylation is more likely to occur in repeats, which make up a large part of the genome. Under this assumption, we may observe relatively lower methylation rates in exons. However, this finding will be driven by the fact that the repeat-rich background against which exons are tested shows high methylation levels. Furthermore, all features tested against this background would be affected and suggest relatively lower methylation rates. Although due to the non-experimental nature we can never completely rule out such confounders, the choice of a proper background is important to reduce dependency between comparisons. We distinguish 3 scenarios: i) Features that do not overlap with other features; ii) Features that are nested in other features; and iii) Features that partially overlap with other features.
Features that do not overlap with other features were tested against the rest of the genome from which all tested features were excluded to reduce dependence and select a “reference” category. For a feature A that is nested in feature B, we used the part of feature B that was not overlapping with feature A as the background. For example, exons are nested in genes. To test for enrichment of methylated sites in exons, we tested all CpG in exons vs. all CpG in genes minus the exon CpG. To determine which features were nested, we calculated Index(A⊆B) defined as (number overlapping bases features A and B) / (total number of bases feature A). If feature A is, for example, completely nested in feature B: Index(A⊆B) = 1. Threshold used to determine nesting was Index(A⊆B) >0.9. Finally, features A and B may only partially overlap (although conserved regions may overlap with genes, this is not always the case). To handle this scenario, we first created 3 separate categories: i) regions where A and B overlap; ii) regions covered by A but not overlapping with B; and iii) regions covered by B but not overlapping with A. Next, we choose one category as the background, and the other 2 categories are tested against this reference category. To determine overlap we determined whether either 0.5<Index(A⊆B)<0.9 or 0.5<Index(B⊆A)<0.9.
Disclosure of potential conflicts of interest
No potential conflicts of interest were disclosed.
Availability of materials and data
The data are available from GEO under accession number GSE94866.
KEPI_A_1335849_s02.docx
Download MS Word (36.4 KB)Acknowledgments
This work was supported by the National Institute of Mental Health and this paper is subject to the NIH Public Access Policy.
Additional information
Funding
References
- Feinberg AP. Phenotypic plasticity and the epigenetics of human disease. Nature 2007; 447(7143):433-40; PMID:17522677; https://doi.org/10.1038/nature05919
- Laird PW. Principles and challenges of genomewide DNA methylation analysis. Nat Rev Genet 2010; 11(3):191-203; PMID:20125086; https://doi.org/10.1038/nrg2732
- Feber A, Wilson GA, Zhang L, Presneau N, Idowu B, Down TA, Rakyan VK, Noon LA, Lloyd AC, Stupka E, et al. Comparative methylome analysis of benign and malignant peripheral nerve sheath tumors. Genome Res 2011; 21(4):515-24; PMID:21324880; https://doi.org/10.1101/gr.109678.110
- Beck S, Rakyan VK. The methylome: Approaches for global DNA methylation profiling. Trends Genet 2008; 24(5):231-7; PMID:18325624; https://doi.org/10.1016/j.tig.2008.01.006
- Rakyan VK, Down TA, Balding DJ, Beck S. Epigenome-wide association studies for common human diseases. Nat Rev Genet 2011; 12(8):529-41; PMID:21747404; https://doi.org/10.1038/nrg3000
- Walker DL, Bhagwate AV, Baheti S, Smalley RL, Hilker CA, Sun Z, Cunningham JM. DNA methylation profiling: Comparison of genome-wide sequencing methods and the infinium human methylation 450 bead chip. Epigenomics 2015;7(8):1287-302. doi:10.2217/EPI.15.64. Epub 2015/07/20.
- Mohn F, Weber M, Schubeler D, Roloff TC. Methylated DNA immunoprecipitation (MeDIP). Methods Mol Biol 2009; 507:55-64; PMID:18987806; https://doi.org/10.1007/978-1-59745-522-0_5
- Serre D, Lee BH, Ting AH. MBD-isolated genome sequencing provides a high-throughput and comprehensive survey of DNA methylation in the human genome. Nucleic Acids Res 2010; 38(2):391-9; PMID:19906696; https://doi.org/10.1093/nar/gkp992
- Brinkman AB, Simmer F, Ma K, Kaan A, Zhu J, Stunnenberg HG. Whole-genome DNA methylation profiling using MethylCap-seq. Methods 2010; 52(3):232-6; PMID:20542119; https://doi.org/10.1016/j.ymeth.2010.06.012
- Harris RA, Wang T, Coarfa C, Nagarajan RP, Hong C, Downey SL, Johnson BE, Fouse SD, Delaney A, Zhao Y, et al. Comparison of sequencing-based methods to profile DNA methylation and identification of monoallelic epigenetic modifications. Nat Biotechnol 2010; 28(10):1097-105; PMID:20852635; https://doi.org/10.1038/nbt.1682
- Chan RF, Shabalin AA, Xie LY, Adkins DE, Zhao M, Turecki G, Clark SL, Aberg KA, van den Oord EJ. Enrichment methods provide a feasible approach to comprehensive and adequately powered investigations of the brain methylome. Nucleic Acids Res. Epub 2017/02/25; [Epub ahead of print] PMID:28334972; https://doi.org/10.1093/nar/gkx143
- Aberg KA, Xie L, Chan RF, Zhao M, Pandey AK, Kumar G, Clark SL, van den Oord EJ. Evaluation of methyl-binding domain based enrichment approaches revisited. PLoS One 2015; 10(7):e0132205; PMID:26177298; https://doi.org/10.1371/journal.pone.0132205
- van den Oord EJ, Bukszar J, Rudolf G, Nerella S, McClay JL, Xie LY, Aberg KA. Estimation of CpG coverage in whole methylome next-generation sequencing studies. BMC Bioinformatics 2013; 14(1):50; PMID:23398781; https://doi.org/10.1186/1471-2105-14-50
- Aberg KA, Xie LY, Nerella S, Copeland WE, Costello EJ, van den Oord EJ. High quality methylome-wide investigations through next-generation sequencing of DNA from a single archived dry blood spot. Epigenetics 2013; 8(5):542-7; PMID:23644822; https://doi.org/10.4161/epi.24508
- Langmead B, Salzberg SL. Fast gapped-read alignment with Bowtie 2. Nat Methods 2012; 9(4):357-9; PMID:22388286; https://doi.org/10.1038/nmeth.1923
- Shabalin A, C S, Hattab M, Aberg K, van den Oord E. RaMWAS: Fast methylome-wide association study pipeline for enrichment platforms. https://bioconductor.org/packages/ramwas/. 2017
- Li H, Handsaker B, Wysoker A, Fennell T, Ruan J, Homer N, Marth G, Abecasis G, Durbin R, Genome Project Data Processing S. The sequence alignment/map format and SAMtools. Bioinformatics 2009; 25(16):2078-9; PMID:19505943; https://doi.org/10.1093/bioinformatics/btp352
- Frommer M, McDonald LE, Millar DS, Collis CM, Watt F, Grigg GW, Molloy PL, Paul CL. A genomic sequencing protocol that yields a positive display of 5-methylcytosine residues in individual DNA strands. Proc Natl Acad Sci U S A 1992; 89(5):1827-31; PMID:1542678; https://doi.org/10.1073/pnas.89.5.1827
- Yu M, Hon GC, Szulwach KE, Song CX, Jin P, Ren B, He C. Tet-assisted bisulfite sequencing of 5-hydroxymethylcytosine. Nat Protoc 2012; 7(12):2159-70; PMID:23196972; https://doi.org/10.1038/nprot.2012.137
- Guo W, Fiziev P, Yan W, Cokus S, Sun X, Zhang MQ, Chen PY, Pellegrini M. BS-Seeker2: A versatile aligning pipeline for bisulfite sequencing data. BMC Genomics 2013; 14:774; PMID:24206606; https://doi.org/10.1186/1471-2164-14-774