
ABSTRACT
Lsh is a chromatin remodeling factor that regulates DNA methylation and chromatin function in mammals. The dynamics of these chromatin changes and whether they are directly controlled by Lsh remain unclear. To understand the molecular mechanisms of Lsh chromatin controlled regulation of gene expression, we established a tethering system that recruits a Gal4-Lsh fusion protein to an engineered Oct4 locus through Gal4 binding sites in murine embryonic stem (ES) cells. We examined the molecular epigenetic events induced by Lsh binding including: histone modification, DNA methylation and chromatin accessibility to determine nucleosome occupancy before and after embryonic stem cell differentiation. Our results indicate that Lsh assists gene repression upon binding to the Oct4 promoter region. Furthermore, we detected less chromatin accessibility and reduced active histone modifications at the tethered site in undifferentiated ES, while GFP reporter gene expression and DNA methylation patterns remained unchanged at this stage. Upon differentiation, association of Lsh promotes transcriptional repression of the reporter gene accompanied by the increase of repressive histone marks and a gain of DNA methylation at distal and proximal Oct4 enhancer sites. Taken together, this approach allowed us to examine Lsh mediated epigenetic regulation as a dynamic process and revealed chromatin accessibility changes as the primary consequence of Lsh function.
Introduction
In multicellular organisms, cells from different tissues are genetically homogeneous but functionally heterogeneous through differential gene expression programs. Unique gene expression patterns are established during development and retained through mitosis by epigenetic regulation. Embryonic stem (ES) cells derived from the inner cell mass are widely used as an in vitro model system to study epigenetic regulation during cellular differentiation and embryonic development. In recent years, great progress has been made in understanding the epigenetic mechanisms in ES cells, which include changes of histone modifications, nucleosome positioning and DNA methylation.Citation1
Oct4 (Pou5f1) has been identified as a key regulator for preimplantation development and its activation and maintenance of expression are required for cellular pluripotency, especially in the early stages of ES differentiation.Citation2 In addition, Oct4 is the one of the ‘Yamanaka factors’ for reprogramming of somatic cells into induced pluripotent stem cells (iPS) and it is the only factor that cannot be replaced by other proteins.Citation3 Oct4 expression in ES cells is subject to a tight regulatory control,Citation4 which includes several epigenetic mechanisms.Citation5-8 Oct4 has also been known to act synergistically to regulate its own transcriptionCitation9 and can act as a core protein in a complex linking multiple epigenetic pathways to the pluripotency network.Citation10-14 To reveal the underlying molecular mechanisms of Oct4 repression upon cellular differentiation would expand our understanding of epigenetic memory, iPS reprogramming and in vitro lineage commitment for purposes of tissue engineering.
Lsh, a member of the SNF2 family of chromatin remodeling proteins,Citation15-17 has been demonstrated as an important epigenetic regulator.Citation17,18 Mutations of human Lsh (HELLS) cause ICF (immunodeficiency, centromeric instability, facial anomalies) syndrome, a severe human disease that is frequently lethal at an early age.Citation19 Lsh has been reported to regulate DNA de novo methylationCitation20-22 and nucleosome density at repeat sequences during mouse development and cellular differentiation.Citation23 It is also involved in the regulation of histone modifications.Citation24 In addition, Lsh association could be detected upstream of the transcriptional start site (around-570 to −175bp) of the Oct4 gene and knockdown of Lsh delayed repression of Oct4 during ES cell differentiation.Citation25
To understand the molecular mechanism of epigenetic regulation, genetic methods have been applied including knockout, mutant or overexpression of genes of interest. However, these approaches may not discern between direct specific effects and indirect subsequent secondary effects. Here we choose a molecular tethering approach to study direct consequences of Lsh tethering and subsequent epigenetic changes on an endogenous allele. The Crabtree laboratory had previously developed a tethering system in mice by introducing multiple Gal4 sites at the Oct4 promoter region with an in-frame nuclear enhanced green fluorescent protein (GFP) reporter gene replacing the first exon of Oct4. This system provided a real time GFP based readout of Oct4 gene expression. GFP was rapidly repressed upon retinoic acid (RA)-induced differentiation and followed a similar kinetic of repression than the wild type allele. In addition, gene silencing at the GFP allele was accompanied by a series of epigenetic events including histone 3 lysine 9 (H3K9) methylation, heterochromatin formation and DNA methylation, which resembled the epigenetic changes of the Oct4 wild type allele.Citation26
In this study, we established an Lsh tethering approach capable of recruiting Lsh to the Oct4 promoter region. This approach allowed us to examine Lsh mediated epigenetic changes at the Oct4 promoter and enhances our understanding of the molecular function of Lsh and its role in the ICF syndrome in the future.
Results
Generation of a Lsh tethering system at the murine Oct4 gene
To investigate the kinetics of epigenetic regulation by Lsh at the Oct4 gene, we used a tethering system in murine ES cells that allowed specific recruitment of Lsh to the engineered Oct4 locus. One allele of Oct4 had been previously genetically modifiedCitation26 by introduction of 5 Gal4 binding sites upstream of the transcriptional start site (TSS) of the Oct4 gene (). In addition, a green fluorescence protein (GFP) reporter gene had been inserted, replacing the first exon of the Oct4 gene, and allowing to monitor gene expression at the single cell level. The locus harboring the Gal4 binding sites and the GFP reporter gene was termed Oct4: GFP allele. ES cells were transduced with a lentiviral construct expressing full length Lsh protein fused to the Gal4-DNA binding domain (Gal4-Lsh), whereas control cells expressed only the DNA binding domain of Gal4 (Gal4). Expression of the Gal4-Lsh fusion protein and Gal4 was detected by western blot analysis () and the nuclear localization were confirmed by immunofluorescence analysis ().
Figure 1. Establishment and characterization of a Gal4-Lsh tethering system. A. Schematic graph of a Lsh tethering system at murine Oct4 sites. The Oct4: GFP ES cell was developed in the Crabtree laboratory with one modified Oct4 allele harboring 5 Gal4 binding sites at the promoter region upstream of the EGFP reporter. We established a Lsh tethering system by ectopic expression of Gal4-Lsh in Oct4: GFP ES cells. B. Western analysis for detection of the Gal4-Lsh or Gal4 protein in Oct4: GFP ES cells transduced with Gal4-Lsh or Gal4 vectors using anti-Lsh antibody or Gal4 antibody. C. Detection of the nuclear location of Gal4-Lsh and Gal4 in Oct4: GFP ES cells by immune fluorescence analysis. Gal4-Lsh contains the flag epitope sequence between Gal4 and the Lsh protein and can be recognized by an anti-flag antibody. Nuclei were stained with DAPI. The controls were only stained with the secondary antibodies (right panel). D. ChIPs analysis followed by real-time PCR analysis to assess Gla4-Lsh or Gal4 enrichment at GFP or 3 kb upstream sequences in Gal4-Lsh or Gal4 expressing ES cell. The Gal4 immunoprecipitation signal at the 3 kb upstream region is not significantly increased compared with the IgG control. ChIPs results represent the mean ± SD of 3 independent samples. SD, standard deviation. *P < 0.05; **P < 0.01.
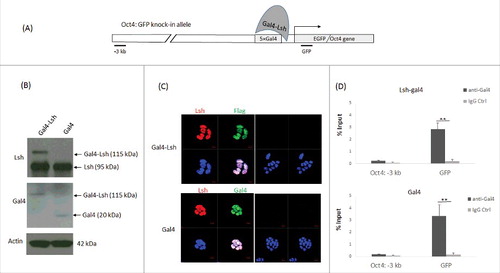
To examine whether Gal4-Lsh is successfully tethered to the 5 Gal4 binding sites of the Oct4 promoter region in Oct4: GFP ES cells, we performed ChIPs analysis on sonicated DNA using Gal4 antibodies. We examined 2 regions at the Oct4 locus, the GFP knock-in site (GFP) in proximity to the Gal4 binding sites and a region about 3 kb upstream of the TSS (−3 kb), serving as a negative control. The Gal4-Lsh fusion protein and Gal4 showed at least 12- to 16-fold higher occupancy at the GFP knock-in site compared with the 3-kb upstream region, respectively (). This indicated that ectopically expressed forms of Gal4-Lsh and Gal4 proteins could be specifically recruited to the Oct4: GFP allele.
Repression of Oct4: GFP reporter after tethering of Lsh in differentiated ES cells
Lsh is highly expressed in ES cells and critical for complete DNA methylation of pluripotency-associated genes, including the Oct4 gene.Citation25 To test whether Lsh could promote gene silencing after tethering at the Oct4: GFP allele, we determined GFP expression using flow cytometry analysis. Expression of Gal4 alone does not affect GFP expression as previously reportedCitation26 (, ). Notably, expression of Gal4-Lsh does not alter GFP expression in undifferentiated ES with 99.2% of cells are GFP positive compared with 99.8% in the control (, ). Fluorescence microscopy, demonstrated universal GFP expression at the single cell level in Gal4-Lsh as well as Gal4 expressing cells (). In addition, GFP mRNA and protein were unaltered comparing Gal4-Lsh and Gal4 undifferentiated ES cells (, ). This data indicates that recruitment of Lsh alone does not induce reporter gene silencing in undifferentiated ES cells.
Figure 2. Association of Lsh at the Oct4 site represses GFP expression during ES differentiation. A-B. GFP expression was measured by flow cytometry analysis upon recruitment of Gal4-Lsh or Gal4 protein in Oct4: GFP ES cells before and after differentiation. Mouse ES cell without GFP knockin were used as the negative control. Flow cytometry results represents the mean ± SD n = 3, **P < 0.01. C-E. Determination of GFP mRNA and protein level in Gal4-Lsh or Gal4 expressing ES cell before and after RA treatment by fluorescence microscopy (C), real-time PCR (D) and western blot analysis (E). RT-PCR result represents the mean ± SD n = 4, *P < 0.05.
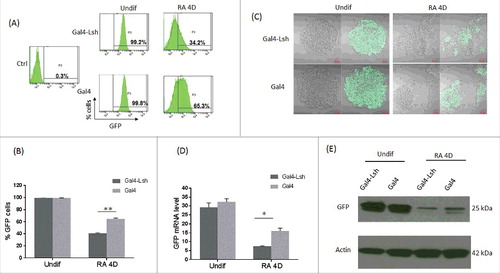
To examine whether Lsh recruitment could influence gene expression during ES differentiation, we used a retinoic acid (RA) induced ES differentiation protocol. RA is a vitamin A metabolite that promotes cell lineage specification by repressing pluripotency-associated genes while activating ectoderm markers in mouse ES cells.Citation27 After removal of LIF and treatment with RA for 4 d (RA 4D), only 34.2% of Gal4-Lsh ES cells were confirmed GFP positive whereas about 65.3% still expressed GFP in Gal4 ES cells. This suggested tethering of Lsh to the Oct4: GFP allele had a repressive function during ES differentiation (, ). This result was further confirmed by fluorescence imaging of Gal4-Lsh and Gal4 ES cells after 4 d of RA treatment (). Furthermore, we determined GFP expression in Gal4-Lsh and Gal4 ES clones by reverse transcription-PCR and western blot analysis (, ), and observed more than 50% reduction of GFP mRNA and GFP protein level after 4 d of RA treatment comparing Gal4-Lsh to Gal4 expressing cells. We also examined time and dose dependent repression of GFP expression by flow cytometry analysis in cells treated with 1 µM or 5 µM RA for 2 d and 4 d (Supplement Fig 1A). This result revealed that higher doses or longer treatment with RA amplified gene suppression, and Gal4-Lsh yielded a greater fraction of GFP negative cells compared with Gal4 alone (Supplement Fig 1B). After 8 d of RA treatment, differences of GFP expression between Gal4-Lsh and Gal4 ES cells were no longer significant, and GFP expression was undetectable at 14 d (Supplement Fig 1C). This indicated that silencing was achieved in both ES clones, but Gal4-Lsh followed a more rapid repression kinetic compared with Gal4 alone. Moreover, when we sorted GFP+ and GFP- cells from Gal4-Lsh ES clones after RA treatment of 4 d, we found that the transgene was expressed in both fractions as expected (Supplement Fig 1D). A slight (not significant) increase of the Gal4-Lsh transgene in GFP negative cells indicated heterogeneity of transgene expression and suggested a predilection toward better repression in high transgene expressing cells, consistent with the proposed effect of tethered Lsh on Oct4 gene silencing. It should be also noted that there was no difference in endogenous Oct4 expression (mRNA or protein) comparing Gal4-Lsh to Gal4 expressing cells before and after RA treatment (Supplement Fig 2A-B), since the engineered allele does not affect the wild type allele. Incidentally, the reduction of the Oct4 protein was more pronounced than that of the GFP protein, most likely due to the higher protein stability of GFP protein compared with Oct4 protein that undergoes proteolytical degradation.Citation28 Our results confirm that the Oct4: GFP allele faithfully reflected physiologic regulation upon differentiation,Citation26 and tethering of Lsh to the Oct4 locus reinforced reporter gene silencing.
Change of histone modification at the Gal4-Lsh targeted Oct4 locus
Histone modification at the Oct4 gene locus have been examined in a variety of mouse ES cells.Citation29 H3K4m3 modification marks an active gene status while H3K9me3 and H3K27me3 are indicative of gene silencing. To gain a better understanding of how Lsh tethering boosts gene silencing, we performed ChIPs analysis to determine histone modifications at 3 locations of the Oct4: GFP allele: 2 knock-in specific regions, in proximity to the 5 Gal4 DNA binding sites in the promoter region (−259) and downstream of TSS (+489), and the third site, 1.5 kb upstream of the TSS in both Oct4: GFP and the wild type allele (). Since ectopic expression of Gal4-Lsh did not have effect on Oct4 expression of the wild-type allele, we reasoned that epigenetic changes, if present, may rather represent the Oct4: GFP allele at this upstream site.
Figure 3. Lsh recruitment induces histone modification changes at the Oct4 locus. A. Regions analyzed by the ChIP assay are shown in the schematic graph. B-E. ChIPs analysis followed by real-time PCR analysis to assess H3K4m3 (B), H3K9m3 (C) and H3K27me3 (D) enrichment at 3 different regions in Gal4-Lsh or Gal4 ES cell before and after RA treatment. IgG antibody served as the ChIP control (E). The ChIP results represent the mean ± SD, n = 4. SD, standard deviation. *P < 0.05; **P < 0.01.
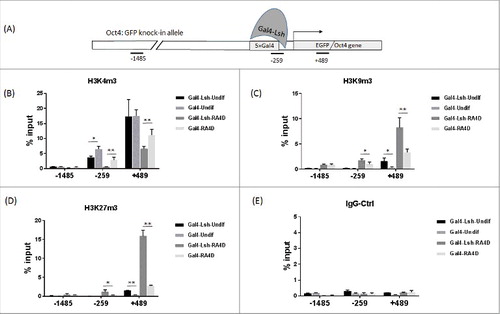
Initially, we investigated the effect of Lsh tethering in undifferentiated cells. ChIP analysis for detection of H3K4me3 showed strong enrichment of this active chromatin mark downstream of TSS (+489) in Gal4-Lsh and Gal4 expressing cells (). The high level of H3K4me3 modification is consistent with the strong GFP expression in both samples. We also observed a significant 50% diminution of H3K4me3 level at the promoter region (−259) in the immediate vicinity of the Gal4 tethering site, whereas H3K4me3 modification was not detectable at 1.5 kb upstream of TSS. In addition, small amounts of H3K9me3 and H3K27me3 histone modification were measurable at downstream of TSS (+489) and significantly increased in Gal4-Lsh infected cells compared with Gal4 control cells and IgG controls (). This suggested that tethering of Lsh in undifferentiated ES cells augmented repressive histone marks and decreased active marks, but did not override the strong Oct4 promoter activity with unaltered GFP expression.
After RA treatment, the Gal4 infected control cells showed an 8- to 12-fold gain of H3K9me3 and H3K27me3 enrichment in proximity of TSS (−259 and +489), consistent with promoter repression (). Remarkably, Gal4-Lsh infected cells displayed a 2- to 4-fold increase of H3K9me3 and H3K27me3 enrichment relative to the Gal4 expressing cells. In addition, H3K4me3 was significantly reduced by about 80% at −259 site and 40% at +489 sites, comparing Gal4-Lsh to Gal4 cells (). Since our previous analysisCitation26 showed a decrease of H3K27ac at enhancers (DE and PE) upon differentiation, we examined H3K27ac, and found a reduction of H3K27ac after Gal4 ES cell differentiation at DE and PE sites by about 42% and 35%, respectively (Supplement Figure 3A, B). Likewise, Gal4-Lsh expressing ES cells showed a decrease of H3K27ac suggesting a functional role in Oct4 regulation. Interestingly, tethering of Lsh reduced H3K27ac modification at DE and PE sites after differentiation (P < 0.02) compared with Gal4 control cells suggesting the repressive effects of Lsh may be, in part, mediated through modulation of both enhancers. The changes in histone modifications in Gal-Lsh expressing cells are consistent with our finding that Lsh recruitment induced repression of GFP reporter gene expression during ES differentiation. Overall, Lsh mediated chromatin states changes were observed at Oct4 sites before differentiation occurred, which may reflect that tethering of Lsh can initiate a repressive chromatin environment, even though it is not sufficient to silence Oct4 transcription. Our results imply that the presence of tethered Lsh augmented the dynamic epigenetic changes occurring upon differentiation, and thus fortified suppression.
Increased nucleosome occupancy at the Oct4 knock-in allele after tethering of Lsh
To address the question whether tethering of Lsh could alter nucleosome density and chromatin compaction, we applied a Nucleosome Occupancy and Methylome (NOMe) sequencing assay. This approach provides the nucleosome footprint and DNA methylation profile simultaneously.Citation30-32 Fixed chromatin was treated with bacterial GpC methyltransferase (M.CviPI) to methylate GpC dinucleotides that were not protected by nucleosomes or strong DNA binding proteins. Treated DNA was subjected to bisulfite conversion, followed by PCR amplification and sequencing. The profiles of nucleosome occupancy and DNA methylation for a specific gene locus can be determined according to sequencing analysis of GpC sites and CpG sites.
We selected 4 sites at the Oct4 locus for the NOMe assay: 2 sites were specific for the knock-in allele, the proximal promoter region with the 5 gal4 binding sites (PP) and part of the sequence of GFP insertion; 2 additional sites comprised the distal enhancer (DE) and the proximal enhancer (PE) regions, present on both wild type allele and Oct4: GFP allele. We detected increased inaccessibility to M.CviPI in a 840 bp long region comprising the Gal4 binding sites when Gal4-Lsh was recruited compared with Gal4 alone (94.7% vs. 71.2%) in undifferentiated cells (). The chromatin inaccessibility gain by tethering Gal4-Lsh was even more striking in the immediate vicinity of the Lsh binding site (within 507 bp), varying between 98.5% with Gal4-Lsh and 63.0% with Gal4 alone, suggesting increased nucleosome occupancy after Lsh recruitment. The effect was strictly localized since the other more distant sites displayed indistinguishable nucleosome patterns comparing Gal-Lsh to Gal4 expressing cells, with a nucleosome occupancy of 39.0% vs. 38.6% at the DE site, 45.9% vs. 44.9% at the PE sequence and 87.9% vs. 82.2% at the GFP region (). These results indicate reduced chromatin accessibility after Lsh recruitment and suggest increased nucleosome density at the tethered site of the Oct4 locus.
Figure 4. Lsh enhances nucleosome occupancy at the tethering site. A-B. Nucleosome occupancy (NO) was analyzed at the Oct4 enhancer, promoter region and GFP region in undifferentiated (A) and differentiated Gal4-Lsh and Gal4 expressing ES cells (B). Schematic graph indicates the locations of the distal enhancer (DE), proximal enhancer (PE), and proximal promoter (PP) and EGFP sequence of the Oct4: GFP allele. Arrow indicates the transcription start site. GpC methylation profiles were generated for Gal4-Lsh and Gal4 expressing ES cells. The green filled circles represent those GpC sites that are accessible to GpC methyltransferase, indicating nucleosome free region. Pink color areas represent the regions of inaccessibility that are large enough (> 147 bp) to accommodate a nucleosome. NO: Nucleosome Occupancy. Statistical test was performed for NO assay at indicated 507bp region in undifferentiated cells (P = 0.004, Gal4-Lsh Vs. Gal4).
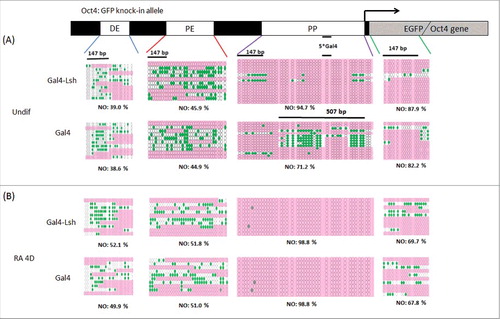
To examine changes in nucleosome occupancy during differentiation, we next performed the NOMe-assay at these 4 sites in Gal4-Lsh and Gal4 expressing ES cells after treatment with RA for 4 d. While the distant sites, DE, PE and GFP, were indistinguishable before and after RA treatment, chromatin inaccessibility was increased to almost 100% around the Gal4 binding sites of the GFP: Oct4 allele. Differentiated Gal4 expressing cells exhibited a similar level of nucleosome density compared with the undifferentiated Gal4-Lsh cells, suggesting that nucleosomes enrichment near the proximal promoter region by Lsh tethering may contribute to transcriptional downregulation. Thus increase in nucleosome occupancy is associated with a repressed chromatin state and augmented gene silencing in Gal4-Lsh expressing cells. Our results suggest that Lsh induced chromatin remodeling precedes and reinforces chromatin repression during ES differentiation.
Tethering of Lsh promotes DNA methylation at enhancer sites during ES differentiation
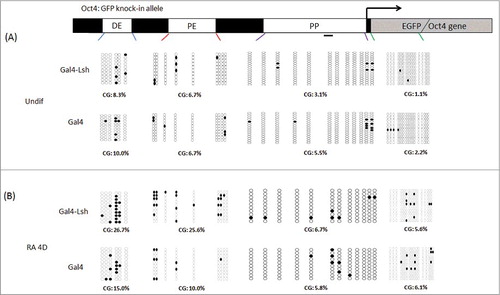
Next, we sought to address the question whether Lsh recruitment could lead to an increase of CpG methylation at the Oct4 locus, an epigenetic modification which is thought to stabilize gene silencing. We detected very low DNA methylation level and did not observe significant differences at the distal enhancer (DE) region (8.3% vs. 10.0%), proximal enhancer (PE) site (6.7% vs. 6.7%), proximal promoter (PP) region (3.1% vs. 5.5%) and EGFP sequence (1.1% vs. 2.2%) in undifferentiated Gal4-Lsh and Gal4 expressing ES cells (). This suggested that tethering of Lsh did not change methylation at any regulatory elements of Oct4 gene before ES cell differentiation, while the Oct4 promoter was active. In contrast, when ES cells were treated with RA, we found that Gal4-Lsh expressing cells had higher DNA methylation levels at the Oct4 enhancer regions compared with Gal4 alone at the DE site (26.7% vs. 15.0%) and PE region (25.6% vs. 10.0%). The proximal promoter (PP) region near the Gal4 binding sites (6.7% vs. 5.8%) and EGFP sequence (5.6% vs. 6.1%) was unaltered, suggesting tethering of Lsh did not alter DNA methylation in immediate vicinity. Since DNA methylation changes follow transcriptional downregulation,Citation33 upstream DNA methylation changes in differentiating ES cells with tethered Lsh may be a consequence of Lsh mediated transcriptional suppression.
Figure 5. Lsh binding increases Oct4 enhancer DNA methylation after ES differentiation. A-B. Schematic graph representing CG methylation level at the Oct4 distal enhancer, proximal enhancer, proximal promoter and EGFP region which were analyzed by the bisulfite sequencing analysis of CpG sites in Gal4-Lsh or Gal4 expressing ES cell before (A) and after RA treatment (B). The CpG methylation profiles are shown with black filled (methylated) and white open (unmethylated) circles. Each sample includes at least 10 sequenced clones and is represented as percentage of methylated CpGs. Statistical test was performed for CG methylation assay at DE and PE sites in differentiated cells (Gal4-Lsh Vs. Gal4, DE, P = 0.177; PE, P = 0.011).
In summary, our findings from the NOMe-assay uncovered that tethering of Lsh promoted nucleosome occupancy at the recruitment site. While these chromatin changes were independent of cellular differentiation and DNA methylation, they were associated with an increase in transcriptional repression and with exacerbated histone modification changes upon differentiation. These results are consistent with a model of primary chromatin remodeling function of Lsh which contributes to gene silencing during ES cell differentiation.
Discussion
Epigenetic modifications, which are generated upon cellular differentiation, create unique specific patterns in every cell type and are thought to maintain the epigenetic memory during cell division. Identifying epigenetic regulators that induce chromatin structure changes and participate in pluripotent gene silencing, contribute to our understanding of how epigenetic patterns are established in normal development, altered during iPS reprogramming and impaired in human diseases.
Here, we explored the direct molecular function of Lsh, a chromatin remodeling protein of the SNF2 family. We applied a tethering system in an engineered ES cells in which one allele had been modified to contain a DNA binding array for tethering and the GFP gene as reporter, whereas the other Oct4 allele remained unmodified. Both alleles (wild type and engineered) show gradual complete repression upon differentiation accompanied by a similar gain and loss of epigenetic marks indicating that the Oct4: GFP allele faithfully reflects physiologic regulation of the wild type Oct4 locus. By introducing Gal4-Lsh in this system, we dynamically examined epigenetic changes induced by targeted recruitment of Lsh at the Oct4 locus in ES cells. We observed reinforced gene suppression after association of Lsh with its target site upon ES differentiation. Furthermore, we demonstrated that tethering of Lsh (but not Gal4) in undifferentiated cells impaired chromatin accessibility, promoted nucleosome occupancy, and altered histone marks, implying a direct (local) epigenetic function of Lsh.
While Lsh tethering induced epigenetic changes were significant, they were not sufficient to override transcription on their own. Unlike Hp126, Lsh tethering was not able to induce heterochromatization and gene silencing by itself. Other additional factors are required to reinforcement of gene silencing. Several DNA binding factors, including the orphan nuclear cell factors GCNF, ARP-1/COUP-TFII and EAR-3/COUP-TFI have been implicated in the repression of the Oct4 gene and, furthermore, removal of LRH-1(liver receptor homolog 1) may contribute to gene repression.Citation34 It remains currently unknown if higher nucleosome occupancy induced by Lsh could alter the balance of DNA binding factors and thus reinforces silencing upon differentiation, or if it facilitates the recruitment of histone methyltransferases, such as GLP/G9a, EED or Ezh2, that play a role in Oct4 gene silencing.Citation5,35 Once H3K9me3 level are established, HP1 (heterochromatin protein 1) is recruited and forms large heterochromatin domains that promotes gene silencing.Citation26,36
Interestingly, we observed higher nucleosome occupancy induced by Lsh before differentiation, but no effect on repression, we noted a similar nucleosome density at the Oct4 promoter region upon ES cell differentiation (with or without Lsh tethering). However, the effect of Lsh tethering was detectable due to significant changes in H3K9, H3K27 methylation and gene expression. This suggests that Lsh induced chromatin remodeling rather “primes” or prepares the chromatin for subsequent faster repression, than inducing a repressive chromatin state on its own. Potential mechanisms may include exclusion of DNA binding factors, facilitation of recruiting of histone methyltransferases, the polycomb repressive complex (PRC) and other chromatin-related regulators.Citation33,35 In contrast to Lsh effects, targeting of HP1α to the Oct4 promoter region led to complete repression of the Oct4: GFP allele within 5 d.Citation26 While Lsh is critical for repression of retrotransposons, and acts as a guardian of heterochromatin,Citation37 it has a distinct molecular function from HP1α on gene transcription.Citation26
In summary, we demonstrate here that Lsh recruitment can alter chromatin accessibility in proximity to its imposed binding site, which is accompanied with alterations of chromatin marks, distal gain of CG methylation and augmented gene repression upon ES differentiation. We conclude that Lsh recruitment at a specific site can enforce a repressive chromatin state in the context of cellular differentiation. How Lsh is recruited to chromatin remains largely unknown.
Materials and methods
ES cell culture and differentiation
Oct4: GFP mouse ES cells were generated as described previously (Hathaway et al. 2012). Mouse ES cells were grown on gelatin coated 6 well plates in high-glucose Dulbecco's Modified Eagle's Medium (Invitrogen, 11960) supplemented with ESC-Sure FBS (Applied Stemcell, ASM-5007), 10 mM HEPES (pH 7.5, Gibco, 15630), NEAA (Gibco, 11400), GlutaMAX (Gibco, 35050), Na Pyruvate (Gibco, 11360), Pen/Strep (Gibco, 15140), 2-Mercaptoethanol (55nM) and 1:10000 LIF (Millipore). Cells were split every 1–2 d and cultured in fresh media. For the ES cell differentiation assay, LIF was removed and cells were treated with 5µM retinoic acid and harvested at indicated time points, while the cell culture medium was changed every other day.
Plasmid construct and generation of stably transduced ES cells
O109-UNI-GAL4 plasmid (a gift from the Crabtree laboratory) contains a EF1-a promoter which drives expression of the Gal4 DNA binding domain fusions. We inserted 3 × flag-tagged mouse Lsh sequence in frame into the multiple cloning site following the Gal4 binding sequences to generate the Gal4-Lsh plasmid. Lentivirus was produced by co-transfection of 293T cell with the Gal4-Lsh (or Gal4) plasmid and the helper plasmids encoding the proteins required for viral packaging. Oct4: GFP ES cells were subsequently infected with Gal4-Lsh or Gal4 lentivirus and selected using blasticidin at a concentration of 10 µg/ml to obtain Gal4-Lsh and Gal4 stably transduced ES clones.
Western blot analysis
Cells were lysed in buffer containing 150 mM NaCl, 50 mM Tris-HCl, pH 7.5, 0.5% Triton X-100 (v/v) and protease-inhibitor cocktail (Roche). Equal amounts of protein samples were loaded onto a 10% acrylamide/bis gel and transferred to a PVDF membrane after electrophoresis. Following blocking with 5% nonfat milk for 1 h, membranes were incubated at 4°C overnight with primary antibodies: Lsh (polyclonal rabbit-antiserum raised against recombinant murine Lsh from our laboratory), GFP (Clontech, Cat. 632375), Oct-3/4 (Santa Cruz Biotech, SCBT-9081), and Actin (Sigma, A2228). HRP-conjugated secondary antibodies were incubated for 1 h at room temperature and the Amersham ECL western blotting analysis system was used for signal detection.
Immunofluorescence staining
ES cells grown on chamber slides were briefly washed in PBS and fixed in 4% paraformaldehyde in PBS for 20–25 min at room temperature. Cells were permeabilized with 0.2% Triton X-100 in PBS for 15 min, washed in PBS and blocked in 1% BSA for 30 min, then incubated with the indicated antibody in the same buffer at 4°C overnight. The slides were subsequently washed 3 times in 1% BSA-PBS and incubated with Alexa fluorophore–conjugated secondary antibodies (Invitrogen) for 1 h at room temperature in the dark and washed 3 times. Finally, the slides were stained with DAPI and imaged by confocal microscopy. The following antibodies were used: Flag M2 (Sigma, F1804); Lsh (polyclonal rabbit-antiserum). Gal4 (Santa Cruz, sc510), Oct4 (Stemgent, 09–0023);
Flow cytometry analysis
Flow cytometry analysis was performed on an LSR II (BD Biosciences) and analyzed with FlowJo software. The cell population of an individual sample was gated using murine ES cells that were not engineered, as a negative control. The shifted cell population at FITC channel indicated GFP expression.
qRT-PCR analysis
For qRT-PCR, total RNA was isolated using RNeasy Mini kit (Qiagen) and reverse transcription was performed by using the Superscript III kit (Invitrogen). Real time quantitative PCR analysis was applied using SYBR Green dye in the Bio-Rad MyiQ2 system. Primers are listed in Supplementary Table 1. Relative expression was normalized to internal Gapdh abundance.
ChIP-qPCR assay
ChIP (chromatin immunoprecipitation) assays were performed as described for the EZ Chip kit (Milipore). Briefly, cells were cross-linked with 1% formaldehyde, lysed, and sonicated on ice to generate DNA fragments with an average length of 200–800 bp. Twenty percent of each sample was saved as input fraction. Immunoprecipitation was performed using specific antibodies against the indicated proteins or IgG was used as control. After reversal of cross-linking, DNA was prepared for qPCR analysis. The following antibodies were used: H3K4me3 (Abcam, ab8580), H3K27me3 (Millipore, 07–449), H3K9me3 (Abcam, ab8898), Gal4 (Santa Cruz, sc510), Rabbit/Mouse IgG (Millipore). Precipitated DNA was suspended in 50 μl of Nuclease-Free water (Invitrogen) and analyzed by qPCR using the specific primers shown in Supplementary Table 1. The normalization method for ChIP analysis is percent of input. Each ChIP result represents the average of 4 samples (mean ± SD). For P-value computation, the student t-test was applied.
Nucleosome occupancy assay
Nucleosome occupancy assay was performed using NoMe-Seq kit (Active Motif) as described previously.Citation23 Briefly, cells were trypsinized, centrifuged for 3 min at 500 × g, then washed in ice-cold PBS and re-suspended in 1 ml ice-cold nuclei buffer (10 mM Tris [pH 7.4], 10 mM NaCl, 3 mM MgCl2, 0.1 mM EDTA, and 0.5% NP-40, plus protease inhibitors) per 5 × 10⁶ cells. Cells were incubated on ice for 10 min and nuclei were recovered by centrifugation at 900 × g for 3 min and washed in nuclei wash buffer (10 mM Tris [pH 7.4], 10 mM NaCl, 3 mM MgCl2, and 0.1 mM EDTA containing protease inhibitors). Freshly prepared nuclei (2 × 10⁵ cells) were sonicated to generate fragments of more than 1 kb, treated with 200 U of M.CviPI (NEB) in 15 μl 10 × reaction buffer, 45 μl 1 M sucrose, and 0.75 μl SAM in a volume of 150 μl. Reactions were quenched by the addition of an equal volume of Stop Solution (20 nM Tris-HCl [pH 7.9], 600 mM NaCl, 1% SDS, 10 mM EDTA, 400 μg/ml Proteinase K) and incubated at 55°C overnight. The chromatin was subjected to reversal-crosslink, RNAase A and Protein K treatment then purified by phenol/chloroform extraction and ethanol precipitation. Bisulfite conversion was performed using the MethylDetector kit (Active Motif) according to the manufacturer's instruction. PCR products were separated in agarose gels, purified and cloned using the TA Kit (Qiagen). More than 10 clones for each sample were sequenced to assess the CpG and GpC methylation profiles.
Disclosure of potential conflicts of interest
No potential conflicts of interest were disclosed
KEPI_A_1338234_supplementary_data.zip
Download Zip (322.9 KB)Acknowledgments
We thank Sarah Anstett for excellent English reviewing of this manuscript. The content of this publication does not necessarily reflect the views or policies of the Department of Health and Human Services, nor does mention of trade names, commercial products or organizations imply endorsement by the US Government.
Additional information
Funding
Related Research Data
References
- Bibikova M, Laurent LC, Ren B, Loring JF, Fan JB. Unraveling epigenetic regulation in embryonic stem cells. Cell Stem Cell 2008; 2(2):123-34; PMID:18371433; https://doi.org/10.1016/j.stem.2008.01.005
- Nichols J, Zevnik B, Anastassiadis K, Niwa H, Klewe-Nebenius D, Chambers I, Schöler H, Smith A. Formation of pluripotent stem cells in the mammalian embryo depends on the POU transcription factor Oct4. Cell 1998; 95(3):379-91; PMID:9814708; https://doi.org/10.1016/S0092-8674(00)81769-9
- Takahashi K, Yamanaka S. Induction of pluripotent stem cells from mouse embryonic and adult fibroblast cultures by defined factors. Cell 2006; 126(4):663-76; PMID:16904174; https://doi.org/10.1016/j.cell.2006.07.024
- Niwa H, Miyazaki J, Smith AG. Quantitative expression of Oct-3/4 defines differentiation, dedifferentiation or self-renewal of ES cells. Nat Genet 2000; 24(4):372-6; PMID:10742100; https://doi.org/10.1038/74199
- Feldman N, Gerson A, Fang J, Li E, Zhang Y, Shinkai Y, Cedar H, Bergman Y. G9a-mediated irreversible epigenetic inactivation of Oct-3/4 during early embryogenesis. Nat Cell Biol 2006; 8(2):188-94; PMID:16415856; https://doi.org/10.1038/ncb1353
- Scarola M, Comisso E, Pascolo R, Chiaradia R, Marion RM, Schneider C, Blasco MA, Schoeftner S, Benetti R. Epigenetic silencing of Oct4 by a complex containing SUV39H1 and Oct4 pseudogene lncRNA. Nat Commun 2015; 6:7631; PMID:26158551; https://doi.org/10.1038/ncomms8631
- Liu D, Zhou P, Zhang L, Gong W, Huang G, Zheng Y, He F. HDAC1/DNMT3A-containing complex is associated with suppression of Oct4 in cervical cancer cells. Biochemistry (Mosc) 2012; 77(8):934-40; PMID:22860916; https://doi.org/10.1134/S0006297912080159
- Myant K, Termanis A, Sundaram AY, Boe T, Li C, Merusi C, Burrage J, de Las Heras JI, Stancheva I. LSH and G9a/GLP complex are required for developmentally programmed DNA methylation. Genome Res 2011; 21(1):83-94. Epub 2010/12/15; PMID:21149390; https://doi.org/10.1101/gr.108498.110
- Chew JL, Loh YH, Zhang W, Chen X, Tam WL, Yeap LS, Li P, Ang YS, Lim B, Robson P, et al. Reciprocal transcriptional regulation of Pou5f1 and Sox2 via the Oct4/Sox2 complex in embryonic stem cells. Mol Cell Biol 2005; 25(14):6031-46; PMID:15988017; https://doi.org/10.1128/MCB.25.14.6031-6046.2005
- Ho L, Jothi R, Ronan JL, Cui K, Zhao K, Crabtree GR. An embryonic stem cell chromatin remodeling complex, esBAF, is an essential component of the core pluripotency transcriptional network. Proc Natl Acad Sci U S A 2009; 106(13):5187-91; PMID:19279218; https://doi.org/10.1073/pnas.0812888106
- Ding J, Xu H, Faiola F, Ma'ayan A, Wang J. Oct4 links multiple epigenetic pathways to the pluripotency network. Cell Res 2012; 22(1):155-67; PMID:22083510; https://doi.org/10.1038/cr.2011.179
- Esch D, Vahokoski J, Groves MR, Pogenberg V, Cojocaru V, Vom Bruch H, Han D, Drexler HC, Araúzo-Bravo MJ, Ng CK, et al. A unique Oct4 interface is crucial for reprogramming to pluripotency. Nat Cell Biol 2013; 15(3):295-301; PMID:23376973; https://doi.org/10.1038/ncb2680
- Pardo M, Lang B, Yu L, Prosser H, Bradley A, Babu MM, Choudhary J. An expanded Oct4 interaction network: implications for stem cell biology, development, and disease. Cell Stem Cell 2010; 6(4):382-95; PMID:20362542; https://doi.org/10.1016/j.stem.2010.03.004
- van den Berg DL, Snoek T, Mullin NP, Yates A, Bezstarosti K, Demmers J, Chambers I, Poot RA. An Oct4-centered protein interaction network in embryonic stem cells. Cell Stem Cell 2010; 6(4):369-81; PMID:20362541; https://doi.org/10.1016/j.stem.2010.02.014
- Eisen JA, Sweder KS, Hanawalt PC. Evolution of the SNF2 family of proteins: subfamilies with distinct sequences and functions. Nucleic Acids Res 1995; 23(14):2715-23. Epub 1995/07/25; PMID:7651832; https://doi.org/10.1093/nar/23.14.2715
- Jeddeloh JA, Stokes TL, Richards EJ. Maintenance of genomic methylation requires a SWI2/SNF2-like protein. Nat Genet 1999; 22(1):94-7; PMID:10319870; https://doi.org/10.1038/8803
- Dennis K, Fan T, Geiman T, Yan Q, Muegge K. Lsh, a member of the SNF2 family, is required for genome-wide methylation. Genes Dev 2001; 15(22):2940-4. Epub 2001/11/17; PMID:11711429; https://doi.org/10.1101/gad.929101
- Sun LQ, Lee DW, Zhang Q, Xiao W, Raabe EH, Meeker A, Miao D, Huso DL, Arceci RJ. Growth retardation and premature aging phenotypes in mice with disruption of the SNF2-like gene, PASG. Genes Dev 2004; 18(9):1035-46. Epub 2004/04/24; PMID:15105378; https://doi.org/10.1101/gad.1176104
- Thijssen PE, Ito Y, Grillo G, Wang J, Velasco G, Nitta H, Unoki M, Yoshihara M, Suyama M, Sun Y, et al. Mutations in CDCA7 and HELLS cause immunodeficiency-centromeric instability-facial anomalies syndrome. Nat Commun 2015; 6:7870. Epub 2015/07/29; PMID:26216346; https://doi.org/10.1038/ncomms8870
- Termanis A, Torrea N, Culley J, Kerr A, Ramsahoye B, Stancheva I. The SNF2 family ATPase LSH promotes cell-autonomous de novo DNA methylation in somatic cells. Nucleic Acids Res 2016; 44(16):7592-604. Epub 2016/05/15; PMID:27179028; https://doi.org/10.1093/nar/gkw424
- Yu W, McIntosh C, Lister R, Zhu I, Han Y, Ren J, Landsman D, Lee E, Briones V, Terashima M, et al. Genome-wide DNA methylation patterns in LSH mutant reveals de-repression of repeat elements and redundant epigenetic silencing pathways. Genome Res 2014; 24(10):1613-23. Epub 2014/08/30; PMID:25170028; https://doi.org/10.1101/gr.172015.114
- Dunican DS, Cruickshanks HA, Suzuki M, Semple CA, Davey T, Arceci RJ, Greally J, Adams IR, Meehan RR. Lsh regulates LTR retrotransposon repression independently of Dnmt3b function. Genome Biol 2013; 14(12):R146. Epub 2013/12/26; https://doi.org/10.1186/gb-2013-14-12-r146
- Ren J, Briones V, Barbour S, Yu W, Han Y, Terashima M, et al. The ATP binding site of the chromatin remodeling homolog Lsh is required for nucleosome density and de novo DNA methylation at repeat sequences. Nucleic Acids Res. 2015; 43(3):1444-55. PubMed PMID:25578963; PubMed Central PMCID:PMC4330352; https://doi.org/10.1093/nar/gku1371
- Yan Q, Huang J, Fan T, Zhu H, Muegge K. Lsh, a modulator of CpG methylation, is crucial for normal histone methylation. EMBO J 2003; 22(19):5154-62. Epub 2003/10/01; PMID:14517253; https://doi.org/10.1093/emboj/cdg493
- Xi S, Geiman TM, Briones V, Guang Tao Y, Xu H, Muegge K. Lsh participates in DNA methylation and silencing of stem cell genes. Stem Cells 2009; 27(11):2691-702. Epub 2009/08/04; PMID:19650037; https://doi.org/10.1002/stem.183
- Hathaway NA, Bell O, Hodges C, Miller EL, Neel DS, Crabtree GR. Dynamics and memory of heterochromatin in living cells. Cell 2012; 149(7):1447-60. Epub 2012/06/19; https://doi.org/10.1016/j.cell.2012.03.052
- Zhang J, Gao Y, Yu M, Wu H, Ai Z, Wu Y, Liu H, Du J, Guo Z, Zhang Y. Retinoic Acid Induces Embryonic Stem Cell Differentiation by Altering Both Encoding RNA and microRNA Expression. PLoS One 2015; 10(7):e0132566; PMID:26162091; https://doi.org/10.1371/journal.pone.0132566
- Xu H, Wang W, Li C, Yu H, Yang A, Wang B, Jin Y. WWP2 promotes degradation of transcription factor OCT4 in human embryonic stem cells. Cell Res 2009; 19(5):561-73; PMID:19274063; https://doi.org/10.1038/cr.2009.31
- Smith ZD, Sindhu C, Meissner A. Molecular features of cellular reprogramming and development. Nat Rev Mol Cell Biol 2016; 17(3):139-54; PMID:26883001; https://doi.org/10.1038/nrm.2016.6
- Kelly TK, Liu Y, Lay FD, Liang G, Berman BP, Jones PA. Genome-wide mapping of nucleosome positioning and DNA methylation within individual DNA molecules. Genome Res 2012; 22(12):2497-506. Epub 2012/09/11; https://doi.org/10.1101/gr.143008.112
- Kelly TK, Miranda TB, Liang G, Berman BP, Lin JC, Tanay A, Jones PA. H2A.Z maintenance during mitosis reveals nucleosome shifting on mitotically silenced genes. Mol Cell 2010; 39(6):901-11. Epub 2010/09/25; PMID:20864037; https://doi.org/10.1016/j.molcel.2010.08.026
- Taberlay PC, Kelly TK, Liu CC, You JS, De Carvalho DD, Miranda TB, Zhou XJ, Liang G, Jones PA. Polycomb-repressed genes have permissive enhancers that initiate reprogramming. Cell 2011; 147(6):1283-94. Epub 2011/12/14; https://doi.org/10.1016/j.cell.2011.10.040
- Athanasiadou R, de Sousa D, Myant K, Merusi C, Stancheva I, Bird A. Targeting of de novo DNA methylation throughout the Oct-4 gene regulatory region in differentiating embryonic stem cells. PLoS One 2010; 5(4):e9937; PMID:20376339; https://doi.org/10.1371/journal.pone.0009937
- Kellner S, Kikyo N. Transcriptional regulation of the Oct4 gene, a master gene for pluripotency. Histol Histopathol 2010; 25(3):405-12. PMID:20054811
- Obier N, Lin Q, Cauchy P, Hornich V, Zenke M, Becker M, Müller AM. Polycomb protein EED is required for silencing of pluripotency genes upon ESC differentiation. Stem Cell Rev 2015; 11(1):50-61; PMID:25134795; https://doi.org/10.1007/s12015-014-9550-z
- Smallwood A, Esteve PO, Pradhan S, Carey M. Functional cooperation between HP1 and DNMT1 mediates gene silencing. Genes Dev 2007; 21(10):1169-78; PMID:17470536; https://doi.org/10.1101/gad.1536807
- Muegge K. Lsh, a guardian of heterochromatin at repeat elements. Biochem Cell Biol 2005; 83(4):548-54; PMID:16094458; https://doi.org/10.1139/o05-119