
ABSTRACT
DNA methylation (5-methylcytosine, 5 mC) is involved in many cellular processes and is an epigenetic mechanism primarily associated with transcriptional repression. The recent discovery that 5 mC can be oxidized to 5-hydromethylcytosine (5hmC) by TET proteins has revealed the “sixth base” of DNA and provides additional complexity to what was originally thought to be a stable repressive mark. However, our knowledge of the genome-wide distribution of 5hmC in different tissues is currently limited. Here, we sought to define loci enriched for 5hmC in the placenta genome by combining oxidative bisulphite (oxBS) treatment with high-density Illumina Infinium HumanMethylation450 methylation arrays and to compare our results with those obtained in brain. Despite identifying over 17,000 high-confidence CpG sites with consistent 5hmC enrichment, the distribution of this modification in placenta is relatively sparse when compared to cerebellum and frontal cortex. Supported by validation using allelic T4 β-glucosyltransferase assays we identify 5hmC at numerous imprinted loci, often overlapping regions associated with parent-of-origin allelic 5 mC in both placenta and brain samples. Furthermore, we observe tissue-specific monoallelic enrichment of 5hmC overlapping large clusters of imprinted snoRNAs-miRNAs processed from long noncoding RNAs (lncRNAs) within the DLK1-DIO3 cluster on chromosome 14 and SNRPN-UBE3A domain on chromosome 15. Enrichment is observed solely on the transcribed alleles suggesting 5hmC is positively associated with transcription at these loci. Our study provides an extensive description of the 5hmC/5 mC landscape in placenta with our data available at www.humanimprints.net, which represents the most comprehensive resource for exploring the epigenetic profiles associated with human imprinted genes.
Introduction
DNA methylation occurs primarily at cytosines (5-methylcytosine, 5 mC) within CpG dinucleotides and is a major modification in the mammalian genome. This covalent modification plays a vital role in many cellular processes, including gene expression, repeat silencing, X chromosome inactivation in females, and genomic imprinting [Citation1]. Studies in recent years have revealed that 5-hydroxymethylcytosine (5hmC), an oxidized derivative of 5 mC, is present in many tissues [Citation2,Citation3]. The ten-eleven translocation (TET) proteins are responsible for converting 5 mC to 5hmC through fe(II)/α-ketoglutarate-dependent hydroxylation [Citation4]. The 5-hydroxy modification can eventually lead to demethylation by two different pathways. Additional oxidative steps to generate 5-formylcytosine (5fC) and 5-carboxylcytosine (5caC) are followed by a base excision repair mechanism, with direct removal of the methylated base and its replacement with an unmethylated cytosine in a DNA replication-independent manner [Citation5]. Alternatively, Tet-driven cytosine demethylation may involve a passive mechanism in which 5hmC is diluted through rounds of DNA replication due to the low enzymatic activity of DNMT1 for hemi-hydroxymethylated DNA templates [Citation6]. However, it is unclear whether 5hmC is simply an intermediate of the DNA demethylation process, or if it possesses its own singular epigenetic function, with increasing evidence supporting this possibility. The 5hmC modification displays varying abundance between tissues and genomic locations, it is associated with gene transcription with strand bias accumulation on the antisense strand of intragenic regions [Citation7], and it has been recently shown that it can be specifically recognized by several DNA-binding proteins [Citation8,Citation9].
Methylation levels of cytosines are commonly quantified using methods that involve exposing single-stranded DNA to sodium bisulphite, which deaminates cytosine bases to uracils. Converted cytosines are subsequently read as thymines in PCR and sequence protocols. Methylated cytosines are resistant to bisulphite conversion and maintained as cytosines in subsequent sequencing steps, enabling the quantitative discrimination of unmethylated cytosines from 5 mC [Citation10]. Importantly, bisulphite treatment cannot distinguish between 5 mC and 5hmC because 5hmC is also resistant to deamination [Citation11], so that analyses on classic bisulphite converted DNA will provide combined data for 5 mC plus 5hmC. Oxidative bisulphite (oxBS) treatment of DNA allows for discrimination between 5 mC and 5hmC via selective chemical oxidation of 5hmC to 5fC. The latter derivative deaminates to uracil during bisulphite treatment, so that the only cytosine base not deaminated following oxBS is 5 mC [Citation12]. Recently, several publications have demonstrated the oxBS conversion can be incorporated into the Illumina Infinium HumanMethylation450 BeadChip array protocol to facilitate the quantification of both 5 mC and 5hmC [Citation13–15]. Subtraction of oxBS-generated methylation from standard bisulphite profiles allows for the detection of 5hmC at cytosine positions throughout the genome. This approach has been used to characterize the 5hmC patterns in different tissues, revealing that 5hmC is substantially enriched in brain compared to leukocytes [Citation13], an observation that confirms initial reports using both mass spectrometry and antibody-based technologies [Citation2,Citation3].
Overall 5hmC content, as quantified by mass spectrometry and stable isotope labeling, varies among tissues with highest levels observed in the brain, where it constitutes up to 0.9% of all cytosines [Citation16,Citation17]. This is in contrast to 5 mC, which is relatively consistent between tissues, with ∼4-5% of cytosines being methylated [Citation16,Citation17]. The placenta is an exception, relatively hypomethylated compared to all other tissues, with 5 mC being present at ∼2.8% of cytosines [Citation18,Citation19]. Intriguingly, placenta has an intermediate level of 5hmC [Citation3], which is lower than brain but higher than most somatic tissues, suggesting that this modification may be relatively more abundant in this extra-embryonic tissue.
In this study, we combine the TrueMethyl-CEGX oxBS kit with the Illumina Infinium HumanMethylation450 array (HM450K) platform to characterize the distribution of 5hmC in the human placenta and compare the profiles with brain. We subsequently confirm the most significantly enriched loci using both hydroxymethylated DNA immunoprecipitation sequence (hMeDIP-seq) datasets and T4 β-glucosyltransferase (T4-BGT) assays which distinguish 5 mC from 5hmC by the enzymatic addition of a glucose moiety to the hydroxyl group of 5hmC. This revealed that the distribution of 5hmC in placenta is relatively sparse compared to brain and, surprisingly, that several imprinted domains are enriched for allelic 5hmC in frontal cortex, cerebellum, and placenta.
Results
Identification of 5hmC in placenta
The levels of 5hmC were calculated for four placenta samples as the differentially methylated CpG sites between standard bisulphite and oxBS-treated replicates for each sample as follows. Beta (β) values from the Illumina Infinium HumanMethylation450 arrays (HM450K) represent the methylation level at a particular probe site on a scale or 0 (unmethylated) to 1 (fully methylated). The β values from the standard bisulphite (BS) treatment represent the aggregate methylation score for both 5 mC and 5hmC. In contrast the β values after oxBS treatment represent only 5 mC. Therefore, normalized delta β (Δβ) values for each probe were calculated by subtracting the oxBS β value from the standard bisulphite treated β value (ΔβBS-oxBS). Resulting β value density plots show a reduction in the oxBS β values compared to standard bisulphite β values, corresponding to lower global 5 mC and the presence of 5hmC in the placenta. As previously reported, both positive and negative the Δβ values were calculated [Citation13,Citation14]. Positive Δβ values represent enrichment of 5hmC, whereas a negative Δβ value reflects technical variance of the technique. Of the negative skewed values, 50% are below Δβ = −0.006 (≤0.6%), with 98.8% of negative Δβ values greater than −0.1 (Figure S1).
To ensure we were detecting 5hmC abundance above the sensitivity of the array platform, we set a stringent threshold for calling 5hmC above Δβ > 0.1. Using these criteria we observe 17,252 probes with an average Δβ > 0.1 in all four samples (mean 5hmC: 0.145) and 1,928 probes with an average Δβ > 0.2 (mean 5hmC: 0.239), which were classified as having abundant 5hmC in the four placenta samples analyzed. When levels of 5 mC were taken into account, 5hmC enriched regions localized at hypermethylated positions with 5 mC in the 60–80% range (BS β = ∼0.6–0.8).
A comparison between 5hmC in brain and placenta
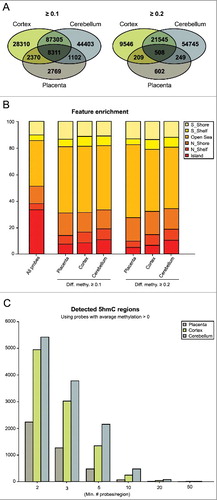
We utilized a previously published dataset that characterized 5hmC in eight cerebellum biopsies, five of them with paired prefrontal cortex samples [Citation14]. After performing probe filtering and bioinformatics analysis for 5hmC enrichment as previously described for the placenta samples, we identified 148,516 probes with an average Δβ > 0.1 (mean 5hmC: 0.227) and 79,733 probes with an average Δβ > 0.2 (mean 5hmC: 0.298) in cerebellum and 131,781 probes with an average Δβ > 0.1 (mean 5hmC: 0.168) and 32,595 probes with an average Δβ > 0.2 (mean 5hmC: 0.246) in cortex. Therefore, the human placenta contains ∼10-fold less 5hmC than brain, consistently with levels reported using immuno-blotting [Citation3]. To explore if these differences may be due to the difference in the relative abundance of the three TET enzymes, we performed qRT-PCR. This revealed that there were marked differences in expression of all TETs between placenta and brain, with TET2 and 3 being highly abundant in placenta (Figure S2). When we compared the probe lists that presented with an average >0.1 in placenta, 81% were also enriched in at least one of the two brain regions, with 57% being observed in both cerebellum and cortex samples ((A)). When individual samples from each tissue were compared, the eight cerebellum samples had the highest correlation (R2 = 0.51–0.82, P<0.001) whilst placenta biopsies were more varied (R2 = 0.17–0.30, P<0.001) suggesting inter-individual variation.
Figure 1. Quantifying 5hmC in human placenta and brain regions. (A) Venn diagrams illustrating the number of probes detected using the threshold Δβ > 0.1 and >0.2 after combined QC filtering for the three datasets. The figures represent the number of probes with an average greater than the threshold value in each tissue. (B) All probes classified according to their genomic location. The bar chart illustrates probe enrichment classified by Illumina Infinium annotation in placenta, frontal cortex and cerebellum. (C) Inclusion criteria for Bumphunter function with the number of probes contained within each 800 bp window.
Distribution of 5hmC in placenta
We investigated the location of 5hmC with their annotated probe positions. Although this does not allow for a complete unbiased 5hmC profiling, the HM450K array does include ∼17 probes per RefSeq transcript distributed across the entire genome [Citation20]. We observe that 5hmC in placenta is primarily located in “open sea” probes that map outside defined gene and promoter intervals and is enriched in CpG island shelves, but depleted in CpG islands themselves ((B)). This is consistent with previous studies in brain samples that demonstrated a depletion of 5hmC in CpG islands and enrichment in CpG-poor regions [Citation14,Citation21]. Furthermore, similar to cerebellum and cortex, 5hmC in all four placental samples is enriched in gene bodies and 5’- and 3’-UTRs and decreased in proximal promoters (∼200–1500 bp from transcriptional start site), which is in agreement with the inverse correlation between 5hmC and CpG density at promoters (Figure S3) [Citation21]. Gene ontology analysis was performed for the three most enriched genetic elements, the 5’-, 3’-UTRs, and gene bodies for both Δβ > 0.1 and >0.2 datasets (Table S1). After corrected for multiple testing, several biological processes and molecular function categories were enriched including regulation of metabolic processes in placenta and Rho protein signal transduction in cerebellum and cortex.
Validation of 5hmC tissue profiles
To determine if any regions are enriched for clusters of probes we used Bumphunter function adapted for the HM450K arrays [Citation22] with further characterization of different criteria filtering for a minimal number of probes within a region ((C)). The candidate regions obtained from Bumphunter with a minimum of two probes can be explored at our laboratory's website (www.humanimprints.net) (Table S2). A comparison of the top 500 “bumps” for cerebellum, cortex and placenta revealed only 48 regions in common (Figure S4).
To confirm the enrichment of 5hmC in normal placenta biopsies we compared our oxBS-450K data with hMeDIP-seq datasets [Citation23]. Ninety-seven of the top 100 placenta loci identified by oxBS-450K were also enriched for precipitated hMeDIP sequences ((A)).
Figure 2. Characterization of 5hmC positive loci in placenta and brain. (A) Genomic interval overlapping the SEMA3B region on chromosome 3 showing the average distribution of 5hmC (green) and 5 mC (black) in placenta samples. The upper panel represents the enrichment defined by oxBS-450K analysis with dots signifying data points for each probe (5hmC Δβ; 5 mC oxBS) and the 95th confidence interval. The lower panel shows the corresponding hMeDIP enrichment in 4 control placenta samples. The Bumphunter-defined interval is highlighted as a yellow shaded region. (B) Overview of the T4 β-glucosyltransferase assay. (C) Quantitative PCR combined with T4-BGT assay targeting the SEMA3B promoter confirms enrichment of both 5hmC and 5 mC in placenta. (D) The distribution of 5hmC and 5 mC at the EHMT2 gene in cerebellum identified by oxBS-450K and Bumphunter analysis. (E) T4-BGT confirmation of 5hmC and 5 mC in frontal cerebellum -DNA. Error bars represent standard error of the mean (SEM) of three PCR replicates.
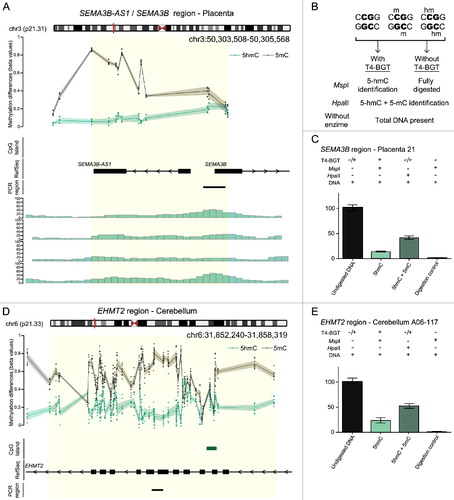
We subsequently selected candidate regions for targeted confirmation using T4-BGT assay and PCR. This method distinguishes 5 mC from 5hmC by the addition of glucose to the hydroxyl group of 5hmC via the catalytic action of T4-BGT. When 5hmC occurs in the context of CCGG, this modification converts a cleavable MspI site to a non-cleavable one that acts as a template for quantitative (q)PCR ((B)). We confirmed the presence of 5hmC at SEMA3 and miR193B loci in placenta, with an abundance of 5hmC/5 mC at similar levels to the ones detected by oxBS-450K ((C); Figure S5). In addition, we performed similar validation for several intervals with Δβ > 0.1 in cerebellum samples, including at EHMT2, G1IBB, PPP1R10, and TNXB for which we also observed high concordance between both techniques ((D,E); Figure S5).
5hmC at imprinted loci
Initial screens for 5hmC at imprinted differentially methylated regions (DMRs) failed to identify robust enrichment in blood-derived DNA [Citation24]. However, a systematic analysis within the H19-IGF2 locus on chromosome 11 revealed widespread enrichment throughout the ∼150 kb interval in brain, but not overlapping the H19 DMR itself [Citation3]. Further interrogation of the placenta and brain profiles revealed that several imprinted domains were in fact enriched for 5hmC, which in most cases was located within the regions of parent-of-origin methylation defined by methyl-seq [Citation19]. Enrichment of 5hmC was observed at several classic ubiquitous DMRs, including at NAP1L5, PEG10, MEST, PEG13, INPP5F, IGF1R, NNAT, L3MBTL1, GNAS A/B, and the SNU13 (previously known as the NH2PL1) in the cerebellum ox-450k datasets ((A); Figure S6; Table S3). Furthermore the 5hmC enrichment was also observed in placenta at the GNAS A/B DMR, the H19 gene body (which is paternally methylated solely in placenta) [Citation19] and at several placenta-specific DMRs, including MCCC1, RHOBTB3, SCIN, DNMT1, and ACTL10 ((C-E); Figure S6; Table S3 and S4).
Figure 3. Enrichment of 5hmC overlapping imprinted DMRs. (A) The Bumphunter defined interval overlapping the GNAS A/B DMR showing the average distribution of h5mC (green) and 5 mC (black) in brain. The upper panels represents the enrichment defined by oxBS-450K analysis with dots signifying individual data points for each probe (5hmC Δβ; 5 mC oxBS) and the 95th confidence interval. Blue lines represent paternally expressed transcripts and red maternally expressed genes. (B) Analysis of allelic 5hmC and 5 mC using T4-BGT genotyping in cerebellum-derived DNA heterozygous for the variant rs6026578. The sequence trace of PCR amplicons generated using HpaII digested DNA (representing 5 mC+5hmC) and MspI T4-BGT (5hmC) PCRs are shown. (C) The Bumphunter defined interval overlapping the MCCC1 DMR in placenta. (D) Allelic enrichment of 5hmC and 5 mC confirmed using T4-BGT genotyping in a placenta sample heterozygous for the SNP rs937652. (E) Additional imprinted DMRs showing monoallelic enrichment of 5 mC and 5hmC in cerebellum (NNAT and NAP1L5) and placenta (SCIN, ACTL10, and H19) samples, respectively.
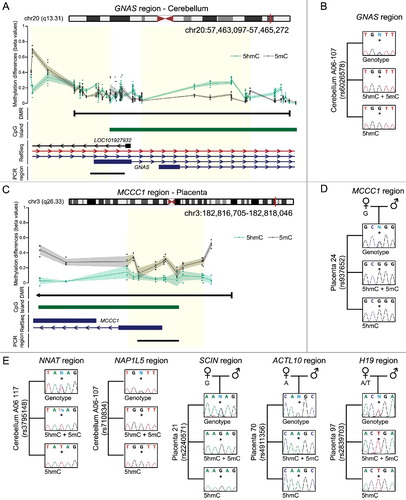
To confirm allelic enrichment at these regions we performed methylation-sensitive genotyping adapted for the T4-BGT assay [Citation25]. DNA samples heterozygous for polymorphic variants were used for PCR following digestion with MspI so that the allelic origin of 5hmC could be ascertained. We observe that the 5hmC is robustly enriched on the maternal alleles of GNAS and NAP1L5 in cerebellum and at MCCC1, SCIN, DNMT1, and ACTL10 in placenta ((B–E)). This indicates that the methylation at these imprinted promoters is a mix of both 5 mC and 5hmC. To determine if 5hmC enrichment is specifically associated with imprinted DMRs or is enriched due to one heavily methylated allele, we screened for CpG islands that are fully methylated in the three tissues types (average >75% methylated) and examined the 5hmC content. In each of the tissues more than 2,000 loci were identified. When utilizing our minimal threshold, 71% of cerebellum regions, 34% in cortex, and 0.2% in placenta reached Δβ > 0.1, while 49%, 0.8%, and 0% were in excess of the Δβ > 0.2 cut-off, respectively (Figure S7). This suggests that 5hmC enrichment at some imprinted DMRs is associated with possessing a fully methylated allele rather than an underlying sequence or chromatin signature.
The 5hmC modification is enriched on the transcribed alleles of imprinted C/D-box small nucleolar RNAs in brain
We observed multiple Bumphunter hits mapping to the large clusters of small noncoding RNAs within the DLK1-DIO3 cluster on chromosome 14 and SNRPN-UBE3A cluster on chromosome 15 (Table S5). We initially focused on the large 5hmC block encompassing the SNORD114 and miRNA cluster located on chromosome 14 between miR370 and miR410/MEG9. The presence of 5hmC was confirmed using qPCR overlapping miR409 and miR1185 on T4-BGT treated DNA in cerebellum-derived DNA ((A-C)). We identified two heterozygous samples for the single nucleotide polymorphism (SNP) rs10144831 within the miR409 amplicon that would allow for allelic discrimination. We observed biallelic enrichment of 5 mC+5hmC as revealed by PCR on HpaII digested DNA, consistent with the region being highly methylated (15 probes with methylation between 43–89%, mean 65%). The 5hmC modification was enriched only on one allele in the MspI TG-BGT samples ((D)). Unfortunately, we did not have parental DNA samples for our brain cohort, so parental origin of the 5hmC could not be directly determined. However, RT-PCR encompassing the same polymorphism revealed monoallelic expression from the same assigned allele as the 5hmC, presumably the maternal chromosome, since the snoRNAs-miRNAs are expressed solely from the maternal allele in brain ((D)) [Citation26].
Figure 4. Enrichment of 5hmC overlapping imprinted SNORD-miRNA clusters. (A) A map of the DLK1-DIO3 imprinted domain on chromosome 14 revealing the location of the associated Bumphunter hits in frontal cortex. The location of the known genes and DMRs are shown. Blue lines represent paternally expressed transcripts and red lines maternally expressed genes. (B) The enrichment of methylation defined by oxBS-450K analysis with dots signifying individual data points for each probe (5hmC Δβ; 5 mC oxBS) and the 95th confidence interval. (C) Quantitative PCR combined with T4-BGT assays targeting the SNORD114 region reveals enrichment of 5hmC. Error bars represent SEM of three PCR replicates. (D) Analysis of allelic 5hmC and 5 mC using T4-BGT genotyping in cerebellum-derived DNA heterozygous for the variant rs10144831 reveals enrichment of 5 mC on both alleles consistent with the high 5 mC levels, whilst 5hmC is only observed on the expressed G allele. (E) A map of the SNRPN-UBE3A imprinted domain on chromosome 15. (F) The enrichment of methylation defined by oxBS-450K analysis with dots signifying individual data points for each probe (5hmC Δβ; 5 mC oxBS) and the 95th confidence interval. (G) Quantitative PCR combined with T4-BGT assays targeting the SNORD116 cluster reveals enrichment of 5hmC. Error bars represent SEM of three PCR replicates. (H) Analysis of allelic 5hmC and 5 mC using T4-BGT genotyping in cerebellum-derived DNA heterozygous for the variant rs4344720 reveals biallelic enrichment of 5 mC but monoallelic 5hmC on the expressed A allele.
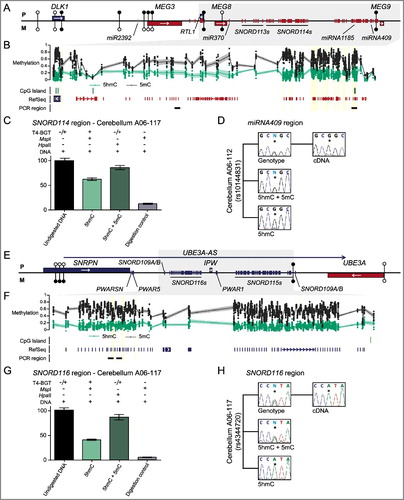
In addition, we observed prominent 5hmC at multiple regions in the chromosome 15 imprinting cluster in brain, including intervals overlapping the SNORD115 (previous known as HBII-52) and SNORD116 (previously known as HBII-85) ((E-G); Table S5). We identified control cerebellum samples heterozygous for the SNP rs4344720 in SNORD116/IPW and confirmed the monoallelic enrichment of 5hmC. Consistent with our observations for miR409, the interval was highly methylated (30 probes with methylation between 40–90%, mean 70%) with 5hmC present only on the transcribed allele ((H)). Since our PCR primers detected the lncRNA UBE3A-AS (also known as LNCAT), the monoallelic expression in this instance is presumably from the paternal chromosome [Citation27].
Discussion
Epigenome-wide studies have highlighted that various layers of epigenetic modifications regulate expression in the placenta. Previous reports have shown that comparison between standard BS and oxBS converted DNA hybridized on HM450K arrays can faithfully differentiate 5hmC, 5 mC, and unmodified cytosine bases [Citation13–15]. However, the majority of methylation studies to date using BS conversion to detect methylation are complicated by the presence of confounding 5hmC that may influence their results. In this study, we have identified loci within the placenta that demonstrate reproducible levels of 5hmC and compared these to profiles obtained from brain. In both tissues, we observe that most regions with 5hmC map to intervals with elevated 5 mC, typically with values of 60–80%. The exception was for probes mapping to imprinted DMRs, where the 5 mC levels are typically ∼50%, representing one fully methylated and one unmethylated allele, with 5hmC observed solely on the methylated allele. The 5hmC modification has been reported to be higher in the promoter of silenced genes, which may reflect the elevated levels of 5 mC and transient intermediate levels of 5 mC demethylation. The distinct distribution patterns we observe for 5hmC in both the placenta and brain samples suggests, however, that this modification is stable and not random, as would be expected for loci undergoing active demethylation.
Recently, a similar oxBS-450K approach has been used to map 5hmC in term placenta, demonstrating the genome-wide distribution of this modification [Citation15]. In tune with our results, Green et al. also observed significant enrichment at open sea regions and CpG island shelves, also reporting that 5hmC is present at poised enhancer elements decorated by H3K4me1 [Citation15]. A comparison between single CpG positions enriched for 5hmC described by Green et al. and our analysis reveals considerable overlap, with 66% identified in at least one of our placenta samples when using the Δβ > 0.1 criteria (Figure S8). Furthermore, both studies suggest that there is large inter-individual variability at sites associated with 5hmC in placenta, which we do not observe in brain. This inter-individual variability may have functional significance and may be linked with environmental influences or exposures, which could in turn have the potential to affect the course of pregnancy.
Epigenetic variance or aberrant gestational dynamics may alter transcriptional output, affecting birth weight and pregnancy outcomes. Among these, targeted analysis of both 5 mC and 5hmC within the imprinted H19/IGF2 domain highlights a potential link to infant birth weight [Citation28,Citation29]. However, at the genome-wide level, very little is known about the distribution and function of placental 5hmC. We observe reproducible enrichment of 5hmC on the methylated allele at specific imprinted DMRs in both placenta and brain. This has important implications for rare imprinting disorders caused by epimutations. For example, loss-of-methylation at the GNAS A/B DMR, a region enriched for 5hmC in both placenta and brain, is associated with Pseudohypoparathyroidism type 1B (PHP1B) (OMIM 603233) [Citation30]. Future studies should address if aberrant 5hmC and/or 5 mC occurs at this specific DMR in target tissues in PHP1B patients. Furthermore, it is plausible that epigenetic defects associated with placenta-specific DMRs could influence fetal growth or that the absence of 5hmC could explain the curious observation of polymorphic placenta imprinting, which has been described for the SCIN and MCCC1 genes [Citation31]. Recently, in mouse embryonic stem cells, the H3K9 methyltransferases G9a/GLP have been shown to maintain methylation at imprinted DMRs by recruiting the de novo methyltransferase complexes that antagonize TET-dependent erosion of methylation [Citation32]. Based on these observations, it would be interesting to compare the H3K9me2 status at DMRs to see if the absence of this histone modification is enriched at loci with detectable 5hmC.
Our studies revealed abundant 5hmC mapping within imprinted domains but outside well-defined allelic DMRs. At two well-characterized clusters, the SNRPN domain on chromosome 15 (also referred to as PWS/AS region in human) and the DLK1-DIO3 domain on chromosome 14, we observed large blocks of 5hmC on the expressed alleles of processed huge lncRNAs in brain [Citation26,Citation27,Citation33]. This is consistent with previous reports that genes undergoing active transcription have increased 5hmC, similar to what has been observed for 5 mC in gene bodies [Citation21,Citation34]. However, the coexistence of 5hmC on the expressed allele of imprinted lncRNAs may be restricted to brain, since no 5hmC was observed overlapping the C19MC, a cluster of 52 miRNAs processed from a single ∼100 kb transcript exclusively expressed from the paternal allele in placenta (Table S5) [Citation35,Citation36].
In summary, our studies have presented a genome-wide map of 5hmC in human placenta. Systematic comparison of 5hmC distribution between placenta and brain indicate that 5hmC is less abundant in placenta but is reproducibly enriched not only at intervals associated with high 5 mC, but also at imprinted DMRs and transcribed lncRNA gene bodies. Our analysis offers a high-confidence list of intervals enriched for 5hmC for future validation in patient cohorts to help understand the function of 5hmC in development and disease.
Material and methods
Tissue samples
Following informed consent from the parents, 32 placental samples with corresponding maternal blood samples were collected at Hospital St Joan De Deu (Barcelona, Spain) with DNA extracted using standard phenol/chloroform extraction. Four of these placenta DNA samples were subjected to standard and TrueMethyl-CEGX oxBS bisulphite conversion and hybridized to Illumina Infinium HumanMethylation450 arrays. All placenta samples were used for T4-BGT assays if heterozygous for SNPs in candidate regions. A total of 20 normal adult brain samples were obtained from BrainNet Europe/Barcelona Brain Bank. The dissection of frontal cortex was performed by an experienced pathologist on cadavers within 14 hours of death. Approval for collecting placental biopsies, brain samples and adult blood samples was granted by the ethical committee of Hospital St Joan De Deu Ethics Committee (Study number 35/07) and IDIBELL (PR006/08 and PR048/13).
Sample preparation and array hybridization
For each placenta sample 1 μg of DNA was processed using the Cambridge Epigenetix TrueMethyl kit following manufacturer's instructions. Briefly, DNA was cleaned using provided magnetic beads and divided into two aliquots. Both aliquots were denatured and 1 μl of oxidant solution was added to one of the aliquots (oxBS) while the other (BS) underwent a mock oxidation process by adding 1 μl of ultrapure water. After incubating both aliquots at 40°C for 30 minutes, and centrifuged to eliminate precipitates, a bisulphite conversion reaction was performed on the supernatant using the supplied reagents. Desulfonation and clean-up process were applied using provided reagents before eluting the DNA in 10-μl elution buffer. The converted DNAs were then hybrized to the HM450K array following kit instructions from Illumina. The resulting datasets have been uploaded to GEO data repository and are available under the accession number GSE93429.
Epigenetic bioinformatics analysis
Standard and TrueMethyl-CEGX oxBS HM450K datasets for cerebellum and frontal cortex were downloaded from the NCBI GEO repository (GSE74368). Enrichment of 5hmC from in-house processed or publically available datasets was identified by subtracting the oxBS β value form the standard BS β value at each probe position on the HM450K array following quality control for probes with bad P>0.01 in any of the samples, standard GenomeStudio normalization and removal of probes containing SNP (within the interrogation or extension base), cross-reactivity or mapping to the sex chromosomes. In total 387978 probes in common for cerebellum, frontal cortex and placenta datasets were analyzed. Enriched region for 5hmC were identified using Bumphunter with the maximum allowed gap between two consecutive probes being 800 bp defined by 1000 permutations and a cut-off defined by the 95th centile from the permutation distribution.
Genomic data for MeDIP-seq and hMeDIP-seq in control placenta samples were retrieved from GSE63743. Genomic mapping of all reads and data analysis was done with Minfi [Citation22] and in-house R statistical package scripts for loci identified using oxBS-450K Bumphunter analysis.
Genotyping for allele-specific T4-BGT PCRs
Genotypes of potential SNPs identified in the UCSC hg19 browser were obtained by PCR and direct sequencing. Amplicons were designed to include the SNP and at least two Msp1/HpaII sites. Sequence traces were interrogated using Sequencher v4.6 (Gene Codes Corporation, MI) to distinguish heterozygous and homozygous samples. Heterozygous tissue samples were analyzed for T4-BGT assays incorporating the polymorphism within the final PCR amplicon so that parental alleles could be distinguished (for primer sequences see Table S6).
T4-BGT Epimark 5hmC assay
A total of 5 μg of DNA was mixed with UDP-glucose to a final volume of 310 μl prior to splitting the sample. One half was incubated with 30 units of T4 β-glucosyltransferase and 3 μl of nuclease-free water was added to the second control tube. Both were subsequently incubated at 37°C for 18 hours. The DNA was then split into 50 μl aliquots for Msp1, HpaII (100 units) and non-digestion control. Restriction endonuclease digestions were performed for 16 hours at 37°C, followed by a 1 hour boost with 1 unit of enzyme to ensure complete digestion. The DNA was then subject to either quantitative or allele-specific PCR using 1 μl as template.
T4-BGT PCR
Enrichment of 5hmC was analyzed by qRT-PCR with a fluorochrome (SYBR® Green) assay and normalized against PCR amplicons not containing Msp1/HpaII sites (for primer sequence see Table S6). The assays were run in triplicate in 384 well plates in 7900HT Fast Real Time PCR System (Applied Biosystems). Only samples with two or more valid readings per triplicate were included. Dissociation curves were obtained at the end of each reaction to rule out the presence of primer dimers or unexpected DNA species in the reaction. Both genomic DNA and a non-template control were included in each assay alongside the six samples from the T4-BGT assays. Results were analyzed with the SDS 2.3 software (Applied Biosystems) and Excel.
Allelic expression analysis
Expression of the UBE3A-AS (rs434470) incorporating the SNORD116/IPW RNAs and the SNORD114-miRNA (rs10144831) primary transcript were assessed in heterozygous frontal cortex samples by RT-PCR and direct sequencing (for primer sequence see Table S6). RNA was extracted using Trizol reagent (Invitrogen) following manufacturers recommendations. The resulting RNA was subject to DNAse treatment (Turbo DNAse I, Invitrogen) and cDNA was synthesized as previously described [Citation37]. Duplicate samples were generated, one with the omission of MMLV enzyme to enable contamination DNA to be detected. The resulting RT-PCR amplicons were sequenced in both directions. The amplification cycle numbers for each transcript were determined to be within the exponential phase of the PCR, which varied for each gene, but was between 32–38 cycles.
TaqMan qPCR
Five different placenta, frontal cortex and cerebellum samples were used to determine TET family RNA abundance. A total of 1 μl of diluted cDNA (1:4) was used per PCR reaction using TaqMan universal PCR Master Mix (Life technologies, Ref. 4324018) with probes for TET1 (hs04189344_g1), TET2 (hs00758658_m1), TET3 (hs00379125) and GAPDH (NM_002046.3) purchased from Thermo Fisher Scientific. Each sample was run in triplicate using the Quantstudio 5 real-time PCR detector (Applied Biosystems). Serial dilutions of cDNA were used to confirm the efficiency of amplification and dissociation curves were obtained at the end of each reaction to rule out the presence of primer dimers. Amplification plots, automatic baseline and threshold values were individually checked and only samples with two or more valid readings per triplicate were included. The qRT-PCR results were averaged for each tissue type and normalized to GAPDH expression.
Disclosure of potential conflicts of interest
No potential conflicts of interest were disclosed.
KEPI_A_1344803_supplementary_data.zip
Download Zip (4.2 MB)Acknowledgements
We would like to thank all the families that participated in this study and the perinatal nurses at Hospital Sant Joan de Deú who contributed to the collection of placenta samples. This work was supported by Spanish Ministerio de Educación y Competitividad (MINECO) (BFU2014-53093 to DM) and the ISCIII (National Plan of R+D+I) (PI13/-1562 to IIP) co-funded with the European Union Regional Development Fund (FEDER). Brain samples were obtained from the Xarxa de Bancs de Tumors de Catalunya, which is sponsored by Pla Director d'Oncologia de Catalunya (XBTC).
Additional information
Funding
Related Research Data
References
- Monk D. Germline-derived DNA methylation and early embryo epigenetic reprogramming: The selected survival of imprints. Int J Biochem Cell Biol. 2015;67:128–138. doi:10.1016/j.biocel.2015.04.014. PMID:25966912
- Globisch D, Münzel M, Müller M, et al. Tissue distribution of 5-hydroxymethylcytosine and search for active demethylation intermediates. PLoS One. 2010;5:e15367. doi:10.1371/journal.pone.0015367. PMID:21203455
- Nestor CE, Ottaviano R, Reddington J, et al. Tissue type is a major modifier of the 5-hydroxymethylcytosine content of human genes. Genome Res. 2012;22:467–477. doi:10.1101/gr.126417.111. PMID:22106369
- Tahiliani M, Koh KP, Shen Y, et al. Conversion of 5-methylcytosine to 5-hydroxymethylcytosine in mammalian DNA by MLL partner TET1. Science. 2009;324:930–935. doi:10.1126/science.1170116. PMID:19372391
- He YF, Li BZ, Li Z, et al. Tet-mediated formation of 5-carboxylcytosine and its excision by TDG in mammalian DNA. Science. 2011;333:1303–1307. doi:10.1126/science.1210944. PMID:21817016
- Valinluck V, Sowers LC. Endogenous cytosine damage products alter the site selectivity of human DNA maintenance methyltransferase DNMT1. Cancer Res. 2007;67:946–950. doi:10.1158/0008-5472.CAN-06-3123. PMID:17283125
- Wen L, Li X, Yan L, et al. Whole-genome analysis of 5-hydroxymethylcytosine and 5-methylcytosine at base resolution in the human brain. Genome Biol. 2014;15:R49. doi:10.1186/gb-2014-15-3-r49. PMID:24594098
- Mellén M, Ayata P, Dewell S, et al. MeCP2 binds to 5hmC enriched within active genes and accessible chromatin in the nervous system. Cell. 2012;151:1417–1430. doi:10.1016/j.cell.2012.11.022. PMID:23260135
- Spruijt CG, Gnerlich F, Smits AH, et al. Dynamic readers for 5-(hydroxy)methylcytosine and its oxidized derivatives. Cell. 2013;152:1146–1159. doi:10.1016/j.cell.2013.02.004. PMID:23434322
- Frommer M, McDonald LE, Millar DS, et al. A genomic sequencing protocol that yields a positive display of 5-methylcytosine residues in individual DNA strands. Proc Natl Acad Sci U S A. 1992;89:1827–1831. doi:10.1073/pnas.89.5.1827. PMID:1542678
- Huang Y, Pastor WA, Shen Y, et al. The behaviour of 5-hydroxymethylcytosine in bisulfite sequencing. PLoS One. 2010;5:e8888. doi:10.1371/journal.pone.0008888. PMID:20126651
- Booth MJ, Marsico G, Bachman M, et al. Quantitative sequencing of 5-formylcytosine in DNA at single-base resolution. Nat Chem. 2014;6:435–440. doi:10.1038/nchem.1893. PMID:24755596
- Stewart SK, Morris TJ, Guilhamon P, et al. oxBS-450K: a method for analysing hydroxymethylation using 450K BeadChips. Methods. 2015;72:9–15. doi:10.1016/j.ymeth.2014.08.009. PMID:25175075
- Lunnon K, Hannon E, Smith RG, et al. Variation in 5-hydroxymethylcytosine across human cortex and cerebellum. Genome Biol. 2016;17:27. doi:10.1186/s13059-016-0871-x. PMID:26883014
- Green BB, Houseman EA, Johnson KC, et al. Hydroxymethylation is uniquely distributed within term placenta, and is associated with gene expression. FASEB J. 2016;30:2874–2884. doi:10.1096/fj.201600310R. PMID:27118675
- Kriaucionis S, Heintz N. The nuclear DNA base 5-hydroxymethylcytosine is present in Purkinje neurons and the brain. Science. 2009;324:929–930. doi:10.1126/science.1169786. PMID:19372393
- Bachman M, Uribe-Lewis S, Yang X, et al. 5-Formylcytosine can be a stable DNA modification in mammals. Nat Chem Biol. 2015;11:555–557. doi:10.1038/nchembio.1848. PMID:26098680
- Fuke C, Shimabukuro M, Petronis A, et al. Age related changes in 5-methylcytosine content in human peripheral leukocytes and placentas: an HPLC-based study. Ann Hum Genet. 2004;68:196–204. doi:10.1046/j.1529-8817.2004.00081.x. PMID:15180700
- Court F, Tayama C, Romanelli V, et al. Genome-wide parent-of-origin DNA methylation analysis reveals the intricacies of human imprinting and suggests a germline methylation-independent mechanism of establishment. Genome Res. 2014;24:554–569. doi:10.1101/gr.164913.113. PMID:24402520
- Sandoval J, Heyn H, Moran S, et al. Validation of a DNA methylation microarray for 450,000 CpG sites in the human genome. Epigenetics. 2011;6:692–702. doi:10.4161/epi.6.6.16196. PMID:21593595
- Yu M, Hon GC, Szulwach KE, et al. Base-resolution analysis of 5-hydroxymethylcytosine in the mammalian genome. Cell. 2012;149:1368–1380. doi:10.1016/j.cell.2012.04.027. PMID:22608086
- Aryee MJ, Jaffe AE, Corrada-Bravo H, et al. Minfi: a flexible and comprehensive Bioconductor package for the analysis of Infinium DNA methylation microarrays. Bioinformatics. 2014;30:1363–1369. doi:10.1093/bioinformatics/btu049. PMID:24478339
- Zhu L, Lv R, Kong L, et al. Genome-Wide Mapping of 5 mC and 5hmC identified differentially modified genomic regions in late-onset severe preeclampsia: A pilot study. PLoS One. 2015;10:e0134119. doi:10.1371/journal.pone.0134119. PMID:26214307
- Matsubara K, Kagami M, Nakabayashi K, et al. Exploration of hydroxymethylation in Kagami-Ogata syndrome caused by hypermethylation of imprinting control regions. Clin Epigenetics. 2015;7:90. doi:10.1186/s13148-015-0124-y. PMID:26322139
- Sanchez-Delgado M, Martin-Trujillo A, Tayama C, et al. Absence of Maternal Methylation in Biparental Hydatidiform Moles from Women with NLRP7 Maternal-effect mutations reveals widespread placenta-specific imprinting. PLoS Genet. 2015;11:e1005644. doi:10.1371/journal.pgen.1005644. PMID:26544189
- Cavaillé J, Seitz H, Paulsen M, et al. Identification of tandemly-repeated C/D snoRNA genes at the imprinted human 14q32 domain reminiscent of those at the Prader-Willi/Angelman syndrome region. Hum Mol Genet. 2002;11:1527–1538. doi:10.1093/hmg/11.13.1527. PMID:12045206
- Cavaillé J, Buiting K, Kiefmann M, et al. Identification of brain-specific and imprinted small nucleolar RNA genes exhibiting an unusual genomic organization. Proc Natl Acad Sci U S A. 2000;97:14311–14316. doi:10.1073/pnas.250426397. PMID:11106375
- Guo L, Choufani S, Ferreira J, et al. Altered gene expression and methylation of the human chromosome 11 imprinted region in small for gestational age (SGA) placentae. Dev Biol. 2008;320:79–91. doi:10.1016/j.ydbio.2008.04.025. PMID:18550048
- Piyasena C, Reynolds RM, Khulan B, et al. Placental 5-methylcytosine and 5-hydroxymethylcytosine patterns associate with size at birth. Epigenetics. 2015;10:692–697. doi:10.1080/15592294.2015.1062963. PMID:26091021
- Turan S, Bastepe M. GNAS spectrum of disorders. Curr Osteoporos Rep. 2015;13:146–158. doi:10.1007/s11914-015-0268-x. PMID:25851935
- Sanchez-Delgado M, Court F, Vidal E, et al. Human oocyte-derived methylation differences persist in the placenta revealing widespread transient imprinting. PLoS Genet. 2016;12:e1006427. doi:10.1371/journal.pgen.1006427. PMID:27835649
- Zhang T, Termanis A, Özkan B, et al. G9a/GLP Complex maintains imprinted DNA methylation in embryonic stem cells. Cel Reports. 2016;77–85. doi:10.1016/j.celrep.2016.03.007. PMID: 27052169
- Vitali P, Royo H, Marty V, et al. Long nuclear-retained non-coding RNAs and allele-specific higher-order chromatin organization at imprinted snoRNA gene arrays. J Cell Sci. 2010;123:70–83. doi:10.1242/jcs.054957. PMID:20016068
- Pastor WA, Pape UJ, Huang Y, et al. Genome-wide mapping of 5-hydroxymethylcytosine in embryonic stem cells. Nature. 2011;473:394–397. doi:10.1038/nature10102. PMID:21552279
- Bortolin-Cavaillé ML, Dance M, Weber M, et al. C19MC microRNAs are processed from introns of large Pol-II, non-protein-coding transcripts. Nucleic Acids Res. 2009;37:3464–3473. doi:10.1093/nar/gkp205. PMID:19339516
- Noguer-Dance M, Abu-Amero S, Al-Khtib M, et al. The primate-specific microRNA gene cluster (C19MC) is imprinted in the placenta. Hum Mol Genet. 2010;19:3566–3582. doi:10.1093/hmg/ddq272. PMID:20610438
- López-Abad M, Iglesias-Platas I, Monk D. Epigenetic characterization of CDKN1C in Placenta samples from non-syndromic intrauterine growth restriction. Front Genet. 2016;7:62. doi:10.3389/fgene.2016.00062. PMID:27200075