
ABSTRACT
Aberrant methylation is one of the most frequent epigenetic alterations that can contribute to tumor formation. Cell-free DNA can originate from tumor tissue; therefore, the evaluation of methylation markers in cell-free DNA can be a promising method for cancer screening. Our aim was to develop a panel of biomarkers with altered methylation along the colorectal adenoma-carcinoma sequence in both colonic tissue and plasma. Methylation of selected CpG sites in healthy colonic (n = 15), adenoma (n = 15), and colorectal cancer (n = 15) tissues was analyzed by pyrosequencing. MethyLight PCR was applied to study the DNA methylation of SFRP1, SFRP2, SDC2, and PRIMA1 gene promoters in 121 plasma and 32 biopsy samples. The effect of altered promoter methylation on protein expression was examined by immunohistochemistry. Significantly higher (P < 0.05) DNA methylation levels were detected in the promoter regions of all 4 markers, both in CRC and adenoma tissues compared with healthy controls. Methylation of SFRP1, SFRP2, SDC2, and PRIMA1 promoter sequences was observed in 85.1%, 72.3%, 89.4%, and 80.9% of plasma samples from patients with CRC and 89.2%, 83.8%, 81.1% and 70.3% from adenoma patients, respectively. When applied as a panel, CRC patients could be distinguished from controls with 91.5% sensitivity and 97.3% specificity [area under the curve (AUC) = 0.978], while adenoma samples could be differentiated with 89.2% sensitivity and 86.5% specificity (AUC = 0.937). Immunohistochemical analysis indicated decreasing protein levels of all 4 markers along the colorectal adenoma-carcinoma sequence. Our findings suggest that this methylation biomarker panel allows non-invasive detection of colorectal adenoma and cancer from plasma samples.
Introduction
Colorectal cancer (CRC) is one of the most common cancers in both men and women worldwide with nearly 1.4 million new cases in 2012.Citation1 In the European Union, 345,000 newly diagnosed cases and 152,000 deaths were estimated for 2012. These statistics emphasize the importance of screening and early detection of precancerous stages. Colonoscopy, as the gold standard method for detection of CRC is widely used for screening. However, endoscopic procedures involve a significant time commitment, requiring bowel preparation, and are invasive and uncomfortable for patients, which create a barrier to participation.Citation2-4 Radiologic examinations including computed tomographic colonography (CTC) and double-contrast barium enema (DCBE) are relatively cost-effective and have high sensitivity for detection of larger polyps (over 10 mm). However, in case of smaller polyps and flat adenomas, the sensitivity is lower than colonoscopy; moreover, findings often require a follow-up colonoscopy, and these methods require radiation exposure.Citation5-7 Currently, CRC screening with non-invasive methods using stool and blood test are more popular and widespread. Globally, guaiac-based fecal occult blood test (gFOBT) is among the most commonly used methods, despite its low sensitivity for advanced adenoma, though this is being replaced by immunochemical fecal occult blood testing (FIT).Citation8 These tests are used to detect hidden blood in the stool, which can be a sign of colorectal cancer. Another CRC screening technique is stool-based analysis of abnormal DNA modifications, such as DNA mutation and methylation, as these alterations have an essential role in tumor formation.Citation9-12 Cologuard® (Exact Sciences Corporation, Madison, WI, United States) is a US FDA approved multitarget stool DNA test, which includes molecular assays for the detection of aberrantly methylated and mutated genes. As Imperiale et al. showed in their recent work, the test has higher sensitivity for finding CRC in comparison to FIT; however, the detection of adenoma patients is less effective.Citation10
Recently, blood-based assays have come into focus as screening tools for colorectal adenoma and cancer. The approach, called “liquid biopsy,” is minimally invasive, quick, and may provide assistance to clinicians to detect cancer.Citation13 Furthermore, blood tests may be more acceptable for patients than fecal-based tests. Determination of genetic and epigenetic changes can be performed from plasma or serum fraction through the examination of circulating cell-free DNA (cfDNA). In human plasma, cfDNA was first detected in the 1940sCitation14 and its increased concentration was measured in many cancers.Citation15 In patients with different cancers (including CRC), cfDNA can be described with neoplastic characterization suggesting elevated cfDNA level originates mainly from tumorous cells.Citation16 In the past 15 years, analysis of cfDNA as a potential diagnostic marker was reported, as the genetic changes of DNA (e.g., KRAS, APC, and p53 mutations) during carcinogenesis can be detected also in plasma.Citation17-21
Besides these genetic alterations, carcinoma-associated epigenetic changes, such as abnormal DNA methylation can contribute to cancer formation. DNA hypermethylation typically occurs at specific CpG-rich regions in gene promoters called ‘CpG islands’ and causes reduced or silenced gene expression.Citation22 Several specific DNA methylation markers have already been reported in plasma samples including Septin9 (SEPT9). The performance of methylated SEPT9 was found to be a highly sensitive marker for CRC in case-control studiesCitation23-26 and it was developed as Epi proColon, the first commercial blood test for colorectal cancer. While early versions of the test had moderate sensitivity, the improved product approved by the US FDA has a sensitivity of 68–72% at a specificity of 80% in the prospective screening.Citation27-29 However, methylated SEPT9 has shown a moderate sensitivity (30.8%) for colorectal adenomasCitation26 and, therefore, new markers are needed to improve detection. The above- mentioned data indicate that most tests are suitable for cancer detection with high sensitivity, but the efficacy for adenoma recognition is quite low. As sporadic colorectal cancer principally develops through adenoma-dysplasia-carcinoma sequence, it is crucial to identify precancerous lesions as early as possible. The detection of early lesions can contribute to successful polypectomy that prevents cancer development.
In the present study, we report on the development of a panel of epigenetic biomarkers showing altered plasma and tissue methylation patterns in both adenoma and tumor samples compared with healthy specimens. Three candidate genes—Secreted frizzled-related protein 1 (SFRP1), Secreted frizzled-related protein 2 (SFRP2), and Proline-rich membrane anchor 1 (PRIMA1) —were selected for methylation analysis based on the previous results of our research group.Citation30-32 One additional potentially hypermethylated biomarker, Syndecan 2 (SDC2), was chosen according to literature data describing it as a potential plasma marker for early CRC detection.Citation33,Citation34 The Wnt antagonists, SFRP1 and SFRP2, are tumor suppressors that play an important role in the regulation of proliferation and apoptosis of cancer cells through binding to Wnt-1 and Wnt-5 ligands.Citation31,Citation35 These genes are proven to play an important role in colorectal cancer development, and altered DNA methylation patterns of these genes have already been reported in CRC tissue samples. The protein product of PRIMA1 anchors acetylcholinesterase to cell membranes,Citation36 while SDC2 encodes a transmembrane proteoglycan molecule participating in cell migration, proliferation, and cell-matrix interaction and acts as a cell-to-cell signaling molecule, such as a growth factor.Citation37 Hypermethylation of sequences in the promoter regions of these genes has already been reported in CRC tissue specimens; however, limited information is available from adenoma tissues. In this study, we have specifically focused on the analysis of plasma samples since methylation status of these markers in plasma fraction has not been studied thoroughly yet.Citation30,Citation38-43
Results
DNA methylation marker discovery and analysis by pyrosequencing
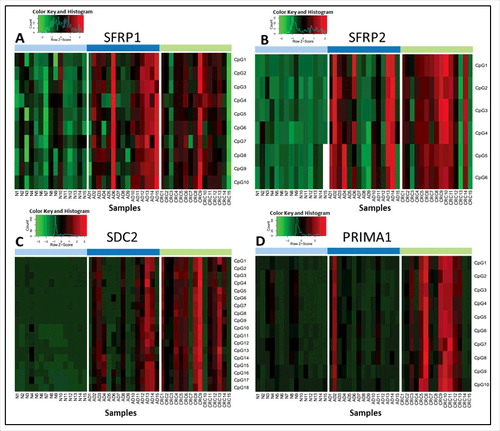
A total of 44 CpGs located in the selected parts of the SFRP1, SFRP2, SDC2, and PRIMA1 promoter regions were analyzed using bisulfite pyrosequencing. The methylation pattern of each CpG site was determined separately and compared between the clinical groups (Table S1). The heatmaps for representing the methylation percentages based on pyrosequencing of 15 healthy, 15 adenoma (AD) and 15 CRC tissue samples are shown in . In the case of SFRP1 and SFRP2 (/A, B), all analyzed CpG sites showed significantly increased methylation in adenoma tissue, with the exception of one CpG site (SFRP1, CpG7) in CRC compared with healthy normal (N) samples (P < 0.02). Eleven CpG sites in the SDC2 promoter (/C) were found to be hypermethylated in adenoma vs. normal and CRC vs. normal comparisons. Further, 6 CpG sites in SDC2 promoter showed significantly higher methylation percentages in CRC samples compared with adenomas, and the methylation difference of one CpG site (CpG4) was significant only in CRC vs. normal, but not in adenoma vs. normal comparison (P < 0.02). All CpG sites of the PRIMA1 promoter (/D) had significantly increased methylation in CRC specimens compared with control samples (P < 0.02) and indicated moderately elevated methylation levels in adenoma tissue.
Figure 1. Methylation percentage data of selected CpG sites of the 4 markers analyzed by pyrosequencing method. Heatmaps representing the methylation pattern of each CpG site of SFRP1 (A), SFRP2 (B), SDC2 (C), and PRIMA1 (D) separately in colon tissue samples using a bisulfite pyrosequencing method. Methylation levels on the color scale are as follows: red: high methylation; black: intermediate methylation; green: low methylation level. Samples are presented in columns. Clinical groups are color coded on the top blocks and represent normal (light blue), adenoma (dark blue), and CRC (light green) tissue samples. CpG sites are shown in rows, indicated on the right side of each panel. Significantly higher methylation levels were observed for 43 of the 44 studied CpG sites located in the promoter regions of SFRP1, SFRP2, SDC2, and PRIMA1 in CRC tissue samples compared with healthy controls, and 33 CpG sites had elevated methylation level in adenomas in comparison to normal samples (P < 0.05). N: normal; AD: adenoma; CRC: colorectal cancer; CpG: cytosine phosphate guanine
In silico validation of DNA methylation on independent sets of colonic tissue samples
DNA methylation status (β-values) of the promoter regions of the 4 markers were verified using methyl capture sequencing data from our research group.Citation39 These regions were further studied by MethyLight (ML) PCR analysis in tissue and plasma samples. Differentially methylated regions (DMRs) overlapping with the analyzed sequences of the 4 methylation markers were evaluated (Table S2). The selected regions of SFRP1 and SDC2 promoters showed intensive and highly significant hypermethylation, both in adenoma (SFRP1 Δβ = 0.60; SDC2 Δβ = 0.65 and 0.50) and CRC (SFRP1 Δβ = 0.49; SDC2 Δβ = 0.59 and 0.37) tissues compared with normal adjacent tissue (NAT) samples (P < 0.01). DNA methylation of the PRIMA1 promoter was intensely increased in adenomas (Δβ = 0.29 and 0.43) (P < 0.01) as they compared with NAT specimens. Not significantly, but remarkably higher PRIMA1 promoter methylation levels (Δβ = 0.07 and 0.18) could be detected in CRC tissue compared with NAT controls. Moderate hypermethylation of the examined SFRP2 region was found both in adenoma and CRC samples, but it was significant only in adenoma vs. NAT comparison (P < 0.05).
In addition to our own results, these regions were analyzed using Illumina HumanMethylation450K DNA methylation array data from The Cancer Genome Atlas (TCGA) database. Methylation levels (β-values) of 99 CpG sites located in the promoter sequences of SFRP1, SFRP2, SDC2, and PRIMA1 genes were determined (Table S3). In the promoter region of SFRP1, 16 of the 24 studied CpG sites showed significantly higher methylation in CRC samples in comparison to NAT samples (average Δβ = 0.21, P < 0.05). Forty-two out of 47 evaluated CpG sites in SFPR2 promoter were hypermethylated in CRC samples, including 7 positions that are located in the DNA sequence further analyzed by ML. In the case of SDC2, all 17 examined CpG sites had significantly higher methylation levels in CRC samples compared with controls (P < 0.05). Significantly elevated (P < 0.05) DNA methylation levels were detected for 91% of the CpG sites (10/11) located in the PRIMA1 promoter. In addition to TCGA data set, the methylation array data (GSE48684) of Luo et al.Citation44 were assessed and methylation differences (Δβ) were determined in adenoma vs. normal, CRC vs. normal, and CRC vs. adenoma comparisons (Table S4). Twenty-two CpG sites of the SFRP1 promoter were highly methylated in CRC samples compared with normals. In CRC vs. adenoma comparison, 2 CpG sites (cg07935886, cg23359714) had significantly higher methylation in CRCs, and 2 CpG sites (cg02388150, cg24319902) were hypomethylated in CRC (P < 0.05). In the SFRP2 promoter, 45 CpG sites were intensively methylated in adenoma tissues compared with healthy controls (average Δβ = 0.23, P < 0.05), and 42 CpGs were found to be hypermethylated in tumorous samples. In the SDC2 promoter, all CpG sites except one had significantly higher DNA methylation levels in adenoma and CRC samples than in controls (P < 0.05). The cg16935295 site, which was examined by ML, showed hypermethylation both in adenoma (Δβ = 0.41, P < 0.05) and in CRC (Δβ = 0.39, P < 0.05) samples. In the promoter of PRIMA1, all CpGs were hypermethylated in adenomas (average Δβ = 0.17, P < 0.05), and 10 CpG sites in cancerous samples compared with normal controls (average Δβ = 0.21, P < 0.05).
Methylation status of the 4 markers in colonic tissues and matched plasma samples analyzed by MethyLight PCR
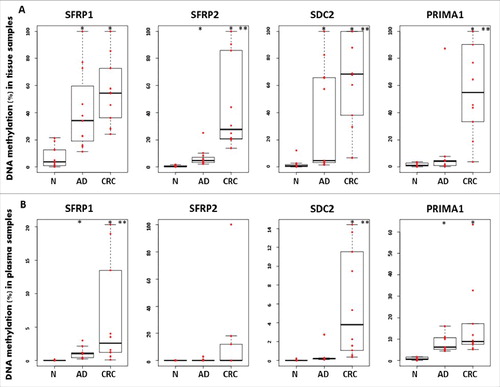
The methylation pattern of 4 marker gene promoters was examined in 32 colonic biopsy specimens by MethyLight technology. The average methylation rate of SFRP1, SFRP2, SDC2, and PRIMA1 in adenoma samples was 41.39 ± 29.58%; 6.7 ± 6.61%; 35.48 ± 38.69%, and 10.76 ± 25.46%, respectively. The percentage methylation in tumor tissue samples was significantly higher compared with controls (P < 0.05). In healthy controls, we observed decreased methylation percentages for all 4 markers (/A). Three (SFRP1, SFRP2, and SDC2) of the markers also had significantly elevated DNA methylation levels in adenomas in comparison to normal samples (P < 0.05). In paired plasma samples, the DNA methylation rates for SFRP1, SFRP2, SDC2, and PRIMA1 were 6.5 ± 7.92%; 13.01 ± 31.23%; 6.01 ± 5.69%, and 16.89 ± 18.27% in CRC patients, and 1.16 ± 0.82%; 0.36 ± 0.87%; 0.44 ± 0.8%, and 8.03 ± 3.87% in adenomas, respectively (/B). Only the promoter region of PRIMA1 gene had a very low average methylation percentage (0.83 ± 0.68%) in healthy controls.
Figure 2. Illustration of DNA methylation differences for the 4 markers in colonic biopsies and paired plasma samples using MethyLight assays. Boxplots illustrate the methylation percentage data of SFRP1, SFRP2, SDC2, and PRIMA1 in colonic tissue (A) and paired plasma (B) samples. Red dots indicate individual DNA methylation percentage values, and the boxplots show the median and standard deviation of the data. Asterisks (*) represent significant differences (P < 0.05) for the adenoma vs. normal and tumor vs. normal comparisons; double asterisks (**) indicate significance (P < 0.05) in tumor samples compared with adenomas. The methylation status of all 4 markers presented a continuous increase during normal-adenoma-carcinoma sequence in tissue samples. Plasma samples showed similar trend; however, lower methylation percentages were observed. N: normal; AD: adenoma; CRC: colorectal cancer
Cell-free DNA levels in plasma samples
All together, 121 plasma samples were collected and studied in the present study. The cfDNA concentration in plasma varied widely in all sample groups. The average total cfDNA level was 33.41 ± 15.49 ng in normal samples, 58.03 ± 36.49 ng in adenoma, and 75.98 ± 30.74 ng in CRC samples. In detailed analysis of the histological subtypes, the cfDNA level of tubular and tubulovillous adenoma groups was 56.01 ± 36.9 ng and 60.68 ± 36.98 ng, respectively. In CRC samples, cfDNA amount in early (Dukes A, B) and late (Dukes C, D) cancer stages was 75.99 ± 28.5 ng and 75.97 ± 34.7 ng, respectively. Significant differences were found in the comparison of neoplastic vs. normal, early cancer stages vs. tubulovillous adenoma, and cancer groups vs. tubular adenoma (Mann-Whitney U test, P < 0.01). Moreover, moderately elevated cfDNA amounts were observed in patients with multiple adenomas compared with patients with single adenoma (P = 0.05) ().
Table 1. Association between the cell-free DNA level, methylation status of SFRP1, SFPR2, SDC2, and PRIMA1 in the plasma of colorectal adenoma and cancer patients and their clinicopathological parameters
DNA methylation frequencies and profiles of SFRP1, SFRP2, SDC2, and PRIMA1 promoters in plasma samples
The methylation status of the promoters of the 4 selected genes was determined by ML assays in 121 plasma samples (Table S5). DNA methylation of SFRP1, SFRP2, SDC2, and PRIMA1 was observed in 85.1% (40/47), 72.3% (34/47), 89.4% (42/47), and 80.9% (38/47) in the plasma fraction of patients with CRC, and 89.2% (33/37), 83.8% (31/37), 81.1% (30/37), and 70.3% (26/37) of adenoma patients, respectively. Nevertheless, the 4 markers were found to be methylated in only 18.9% (7/37), 10.8% (4/37), 2.7% (1/37), and 27% (10/37) of healthy control samples, respectively (/A). The methylation frequencies of all 4 genes were significantly higher in both adenoma and CRC samples in comparison with normal controls (P < 0.0002, in all cases). The level of methylation in the promoter regions of SFRP1 and PRIMA1 genes was significantly higher in advanced-stage cancers (Dukes C, D) compared with early stages (Dukes A, B) (P < 0.05). However, no statistically significant difference was found in SFRP2 (P = 0.35) and SDC2 (P = 0.28) methylation level between early and late CRC stages. Using combined analysis, at least 3 of the 4 epigenetic markers were found to be methylated in 89% of CRC (42/47) and 81% of adenoma (30/37) samples. Four controls (11%) showed elevated methylation level in 3 out of 4 genes. These participants were diagnosed with inflammatory diseases after the analysis.
Figure 3. Frequency and level of DNA methylation of SFRP1, SFRP2, SDC2, and PRIMA1 promoters in plasma samples. Presence (A) of all 4 genes' promoter methylation was significantly higher in adenoma and cancer cases compared with healthy controls in 121 plasma samples (P < 0.05, in all cases). Panel A: Using MethyLight assays, methylation of SFRP1, SFRP2, SDC2, and PRIMA1 was detected in 85.1% (40/47), 72.3% (34/47), 89.4% (42/47), and 80.9% (38/47) in the plasma fraction of patients with CRC and 89.2% (33/37), 83.8% (31/37), 81.1% (30/37), and 70.3% (26/37) of adenoma patients, respectively. Panel B: The average percentage of DNA methylation (B) showed continuous increase along the adenoma-carcinoma sequence. N: normal; AD: adenoma; CRC: colorectal cancer.
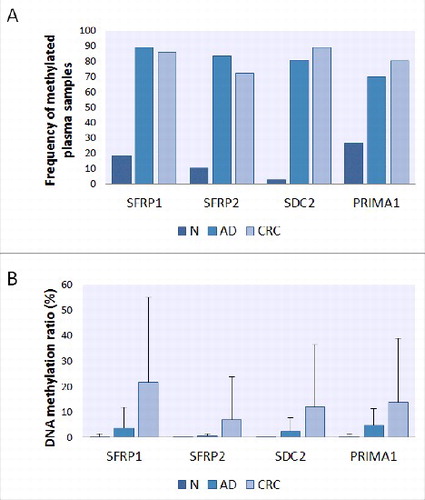
The DNA methylation status of the genes showed a continuous increase across the normal-adenoma-carcinoma sequence. Average percentage DNA methylation was < 1% for all 4 markers in healthy control samples. In adenomas, the highest methylation rate was found in the PRIMA1 promoter (4.73 ± 6.41%), while in CRC plasma samples, aberrant hypermethylation of SFRP1, SFRP2, SDC2, and PRIMA1 was observed with methylation percentage values of 21.77 ± 33.32%, 6.82 ± 17.1%, 12.06 ± 24.37%, and 13.66 ± 25.14%, respectively (/B). Detailed methylation rates of the 4 markers and cell-free DNA levels in adenoma and CRC samples and their association with different clinicopathological features are summarized in . There was no significant association between methylation levels of the 4 markers and the analyzed clinicopathological parameters; however, the average methylation percentage of all 4 markers was higher in advanced-stage (Dukes C, D) cancer than in early stages (Dukes A, B).
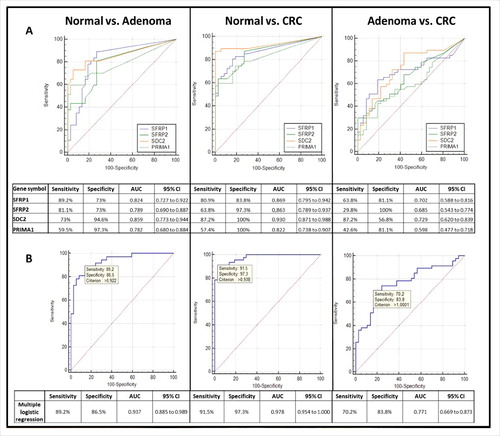
Receiver operating characteristic (ROC) curves were applied to determine the sensitivity and specificity of the 4 markers in plasma samples (). In case of adenoma vs. normal comparison, SFRP1 showed the highest sensitivity (89.2%), with 73% specificity [AUC = 0.824, 95% confidence interval (CI): 0.727 to 0.922], and PRIMA1 presented the lowest sensitivity (59.5%), though at the highest specificity (97.3%, AUC = 0.782, 95% CI: 0.680 to 0.884) (/A). In CRC vs. normal comparison, SDC2 was found to be the most reliable marker with 87.2% sensitivity and 100% specificity (AUC = 0.930, 95% CI: 0.871 to 0.988). CRC could be separated from adenoma samples with 29.8%–87.2% sensitivity and 56.8–100% specificity. In multiple logistic regression analysis (/B), applying the 4 markers together we observed highly sensitive and specific differentiation of CRC patients both from healthy controls (91.5% sensitivity, 97.3% specificity; AUC = 0.978, 95% CI: 0.954 to 1.000) and from adenomas (70.2% sensitivity, 83.8% specificity; AUC = 0.771, 95% CI: 0.669 to 0.873). Adenoma samples could be differentiated from controls with 89.2% sensitivity and 86.5% specificity (AUC = 0.937, 95% CI: 0.885 to 0.989).
Figure 4. Receiver operating characteristic (ROC) curves for the 4 DNA methylation markers and the combined biomarker panel in plasma samples. ROC curves illustrate the sensitivity and specificity of SFRP1, SFRP2, SDC2, and PRIMA1 individually (A) and combined logistic regression analysis (B) in adenoma vs. normal, CRC vs. normal, and CRC vs. adenoma comparison in plasma samples. The calculated values for sensitivity, specificity, AUC, and the 95% confidence interval (CI) are tabulated in each panel. Using combined approach, the 4 markers together were able to distinguish CRC patients from normal individuals with 91.5% sensitivity and 97.3% specificity (AUC = 0.978, 95% CI: 0.954 to 1.000), and could differentiate adenoma samples from healthy controls with 89.2% sensitivity and 86.5% specificity (AUC = 0.937; 95% CI: 0.885 to 0.989). CRC: colorectal cancer; ROC: Receiver operating characteristic; AUC: Area under the curve; CI: Confidence interval.
Effect of promoter methylation of SFRP1, SFRP2, SDC2, and PRIMA1 on protein expression
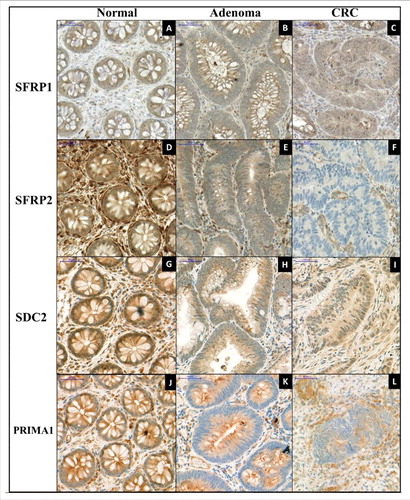
To examine the effect of promoter hypermethylation on protein expression of the 4 genes, immunohistochemical analyses were performed (). SFRP1 expression was cytoplasmic and moderate (intensity: +2) in healthy epithelium. The majority of stromal cells showed low (+1) SFRP1 expression, but a few cells had strong (+3) protein expression (ΣQ-score: 281.50 ± 45.03; /A). Decreased SFRP1 expression was observed (+2 and +1) in both cell types of adenoma (ΣQ-score: 237.22 ± 51.96; /B) and CRC samples (ΣQ-score: 199.16 ± 54.71; /C); however, significant differences occurred only between CRC and normal samples (P < 0.001). The cytoplasmic cell type expression was strong (+3) in healthy surface, and moderate (+2) in glandular epithelium, whereas the most stromal cells exhibited strong (+3) protein expression (ΣQ-score: 433.33 ± 39.15; /D). Lower (P < 0.001) SFRP2 expression (+1 and 0) was seen primarily in epithelial components of adenomas and CRCs (ΣQ-scores: 253.34 ± 43.01 and 228.75 ± 40.86, respectively; /E and F). SDC2 showed moderate (+2) cytoplasmic and nuclear protein expression in epithelial and stromal components of normal colonic samples (ΣQ-score; 281.42 ± 44.13; /G). Significantly decreased (P < 0.001) SDC2 expression levels (+2 and +1) were detected in adenoma (ΣQ-score: 202.00 ± 30.84; /H) and CRC tissues (ΣQ-score: 198.34 ± 53.14; /I). Strong cytoplasmic PRIMA1 expression was found in normal colonic samples (ΣQ-score: 416 ± 32.86; /J). Significantly lower (P < 0.05) protein expression was observed both in adenoma (ΣQ-score: 305 ± 33.91; /K) and in CRC samples (ΣQ-score: 281.66 ± 64.93; /L).
Figure 5. Immunohistochemical staining of SFRP1, SFPR2, SDC2, and PRIMA1 on representative colonic biopsy specimens. Immunohistochemical analyses were performed to determine the protein expression changes of SFRP1 (A, B, C), SFRP2 (D, E, F), SDC2 (G, H, I), and PRIMA1 (J, K, L) in normal, colorectal adenoma, and cancer samples. Decreasing protein levels of all 4 markers were observed along the colorectal adenoma-carcinoma sequence. Digital microscopy images, 30 x magnification; scale bar: 50 μm.
Discussion
Aberrant DNA methylation occurring at CpG sites within promoter regions is a frequent phenomenon in human cancers, including CRC. Promoter hypermethylation can influence transcription of tumor suppressor genes, potentially playing a role in tumor and progression.Citation45 Circulating cell-free DNA in the bloodstream can be derived from tumor tissue, thus carrying molecular alterations, such as aberrant DNA methylation found in cancer cells. Analysis of cfDNA can therefore be an ideal method for detecting and screening for cancer.Citation46 Although a wide range of methylated genes are known in literature that would be capable of identifying CRC, only a few are commercially available, such as SEPT9 (Epi proColon 2.0., Epigenomics AG) with high sensitivity and specificity for CRC detection, though with much lower sensitivity for adenomas.Citation23-26 Some studies are focusing on assembling a panel of methylated biomarkers to achieve a higher sensitivity instead of single markers to detect pancreatic adenocarcinomaCitation47 and non-small cell lung cancer.Citation48
In the present study, the promoter methylation status of SFRP1, SFRP2, SDC2, and PRIMA1 genes was examined in tissue and plasma samples of colorectal adenoma and cancer patients. All 4 markers showed increased methylation in adenoma and tumorous samples both in tissue and plasma specimens, as confirmed with diverse techniques including pyrosequencing, MethyLight PCR, and in silico analyses.
The SFRP1 gene encodes a tumor suppressor protein that acts as a modulator of the Wnt signaling pathway. It contains a cysteine-rich domain homologous to the putative Wnt-binding site of Frizzled proteins. SFRP1 plays an important role in cell growth, apoptosis, and differentiation regulation; therefore, epigenetic silencing of the SFRP1 gene can cause deregulated activation of the Wnt-pathway related to cancer formation, including CRC. Several studies reporting increased methylation of SFRP1 promoter focused primarily on the analysis of cancer tissue samples.Citation32,Citation35,Citation43,Citation49,Citation50 In our study, a region within a 1287-bp CpG island (chr8:41,308,334–41,309,621; GRCh38/hg38) in the SFRP1 promoter was examined. All of the CpG sites, which showed significantly higher methylation level in adenoma or CRC samples compared with controls using Illumina HumanMethylation450 array data, are located in this CpG island. To date, only a few studies examined the methylation pattern alterations of SFRP1 in plasma or serum fraction.Citation51,Citation52 Bedin et al. applied methylation-specific PCR to determine the methylation profile of SFRP1 and OSMR gene in CRC.Citation52 They found methylated SFRP1 in 17% (3/18) of adenoma and 63% (44/70) of CRC plasma specimens; however, in tissue samples, a higher frequency of methylation was detected (92%; 23/25). In the present study, we could detect higher SFRP1 promoter methylation frequencies both in adenoma (89.2%; 33/37) and CRC plasma samples (85.1%; 40/47). Gonzalo et al. clustered the CRC samples to multiple and solitary CRC, and examined the methylation level of 8 genes, including SFRP1, and reported frequent SFRP1 methylation in both CRC subgroups with 89.4% and 82.9%.Citation53 Interestingly, 3 out of 4 analyzed genes were found to be methylated in 4 control samples without adenoma or CRC. Two of the patients had chronic gastritis, and two were diagnosed with inactive ulcerative colitis during the follow-up period. Methylated SFRP1 was detected in 3 plasma samples. In a previously published study our research group reported low methylation level of SFRP1 in tissue samples of ulcerative colitis patients (n = 4) (8.16 ± 12.89%);Citation30 however, in the case of gastritis, there are no studies describing elevated methylation level of SFRP1. Our results indicate that inflammatory diseases may influence the methylation pattern of certain genes; nevertheless, further analyses are required to confirm this hypothesis.
The altered methylation profile of SFRP1 was described not only in CRC but also in other cancer types, such as non-small cell lung cancer,Citation48 cholangiocarcinoma,Citation54 and multiple myelomaCitation55 with diverse methylation frequency values (14–85%).
The SFRP2 gene also encodes a soluble protein member of the SFRP family with a similar function to SFRP1. The methylation status of SFRP2 was reported for fecal samples from CRC.Citation56-59 For plasma samples, the methylation frequencies of SFRP2 were reported to be 54.39% (31/57) in CRC and 40% (12/30) in adenomas, Citation60 while a much higher level of SFRP2 promoter methylation in both CRC and adenoma samples could be detected in our study (72.3% and 83.8%, respectively). In addition to SFRP2, the DNA methylation pattern of GATA5 and ITGA4 genes was also analyzed in the study of Zhang et al., and with the combination of the above-mentioned 3 genes, the study reported 6.67% sensitivity and 93.62% specificity for adenoma, and 15.79% and 93.62% for CRC detection. In our study, with the combined analysis of 4 markers, 89.2% sensitivity and 86.5% specificity could be achieved for adenoma detection, while CRC samples could be identified with 91.5% sensitivity and 97.3% specificity.Citation60
Syndecan 2 protein is a transmembrane heparan sulfate proteoglycan that has a key role in the regulation of cell proliferation, migration, and cell-matrix interplay via its interaction with extracellular matrix proteins.Citation37,Citation61 Huang et al. observed that the downregulation of SDC2 was associated with poor prognosis in esophageal squamous cell carcinoma.Citation62 Another study showed that SDC2 was hypermethylated in tumor tissue samples of gastric cancer patients compared with the corresponding non-tumor mucosa (CNM).Citation63 As the first step in our study, the SDC2 promoter was found to be strongly hypermethylated by pyrosequencing both in colonic adenoma and CRC samples compared with unmethylated healthy controls. These results have inspired us to analyze the methylation pattern of SDC2 using ML assays in cell-free DNA fraction. In plasma specimens, the methylation of SDC2 was detected in 89.4% (42/47) of CRC and 81.1% (30/37) of adenoma samples. These values are in accordance with Oh et al., as they assessed the methylation status of 6 genes (including SDC2) in tissue samples using bisulfite pyrosequencing, and further analyzed the methylation status of this gene in serum samples of CRC patients by quantitative methylation-specific PCR.Citation33 They estimated the overall sensitivity and specificity to be 87% and 95.2% for CRC samples, respectively, and these values are similar to our results, as we calculated 87.2% sensitivity and 100% specificity for detection of tumorous samples.
PRIMA1 encodes a protein that functions to organize acetylcholinesterase (AChE) into tetramers and to anchor to neural cell membranes. Underexpression of PRIMA1 leads to decreased AChE activity causing more cholinergic transmission, which is associated with mental disorders, mainly with depression.Citation64-66 Sabunciyan et al. studied the methylation pattern of 224 genes, including PRIMA1, in frontal cortex brain tissue from individuals with major depressive disorder and from healthy controls.Citation40 Among the 17 genes that were examined by pyrosequencing, PRIMA1 hypermethylation was found to be the largest in patients with depression. Furthermore, decreased mRNA expression level and elevated DNA methylation of PRIMA1 were observed in tissue samples of prostate cancer patients,Citation41 in individuals with chronic lymphocytic leukemia (CLL),Citation42 and in tissue specimens of CRC patients, described previously by our research group.Citation32 In the present study, in addition to tissue samples, PRIMA1 methylation level was examined also in plasma samples, and its increased methylation was found in 80.9% of CRC and in 70.3% of adenoma patients. To the best of our knowledge, this is the first study to report the elevated level of PRIMA1 methylation in plasma samples of colorectal adenoma and cancer patients.
Here we described a biomarker panel of 4 genes that is able to distinguish adenoma and CRC samples from healthy controls with high specificity and sensitivity in both tissue and plasma samples based on their promoter DNA methylation levels. Cologuard® test also detects aberrant methylation of several genes supplemented with mutation analysis of selected genes from stool samples. A clinical study involving 10,000 participants showed that the test can identify CRC samples with 92.3% and advanced precancerous lesions with 42.2% sensitivity.Citation10 The sensitivity for distal advanced precancerous lesions showed higher values (54.5%) than for proximal lesions (33.2%). In contrast, our marker panel could separate the adenoma samples from controls, with 89.2% sensitivity and 86.5% specificity. The sensitivity of the detection of CRC samples is similar in our study (91.5%) to the above-mentioned stool-based test.
In comparison with single marker analysis, the primary advantage of the construction of a diagnostic panel is the higher sensitivity and specificity values for the detection of colorectal adenoma and cancer cases. Using a 2-step amplification method and standard mixtures containing methylated and unmethylated DNA in different ratios, the methylation pattern of plasma samples could be determined despite the low amount of cfDNA. In silico analysis of methylation data of tissue samples confirmed our findings for the altered methylation levels of the 4 markers on large independent sets of samples. Immunohistochemical analysis revealed that the changes in promoter DNA methylation patterns have an effect on the protein expression.
In conclusion, the present study offers the possibility to measure the hypermethylation of the marker panel in plasma cfDNA from colorectal adenoma and cancer patients providing a potential non-invasive, epigenetic diagnostic test. Our results provide evidence that the altered methylation pattern can also be observed in adenoma stages with high sensitivity and specificity, which might serve as a key for early diagnosis of precancerous stages.
Methods
Patients and samples
All together, 166 patients undergoing screening colonoscopy were enrolled in this study, and samples were classified based on histological diagnoses by expert pathologists (Table S6). Fifteen NAT, 15 adenomas and 15 colorectal cancer fresh-frozen tissue specimens were obtained for the pyrosequencing study. For MethyLight PCR, blood samples were collected from 47 CRC, 37 AD, and 37 control patients, and matched biopsy samples (n = 32) were obtained from 10 patients with colorectal cancer, 11 patients with adenoma, and 11 healthy individuals. Blood samples were taken in 6 ml K3EDTA Vacuette tubes (Greiner Bio-One Gmbh, 456038), and the plasma fraction was separated by double centrifugation at 1350 rcf for 12 min and stored at −20°C until DNA isolation. For validation, DNA methylation data of further 192 patients were evaluated in silico (). Tumor stages were specified by the tumor node metastasis (TNM) system of the Union for International Cancer Control (UICC). CRC patients with other types of primary tumors or chronic disease, treated with chemotherapy or radiotherapy were excluded. The study was approved by the local ethics committee and government authorities (Regional and Institutional Committee of Science and Research Ethics; TUKEB Nr: 69/2008; 116/2008; 23.970/2011). Written informed consent was obtained from all patients before sample collection.
Table 2. Clinical samples used in the study.
Selection and experimental verification of target hypermethylated gene promoters
SFRP1, SFRP2, and PRIMA1 were chosen for further examination based on pyrosequencing data of our previously published study analyzing the methylation status of 18 genes with altered expression in CRC.Citation32 One additional marker, SDC2 was selected on the basis of literature data. Citation33,Citation34 To verify the promoter methylation of SDC2, pyrosequencing was also performed using GS Junior System (Roche Applied Science, 05922160001) using the 454 technology on 15 NAT, 15 adenoma, and 15 CRC fresh frozen samples. Detailed protocols were described previously by Kalmár et al.Citation32 Selected regions of SFRP1, SFRP2, PRIMA1, and SDC2 gene promoters were examined by pyrosequencing and additional methods as MethyLight PCR. The specific sequence regions were chosen based on literature dataCitation32 and using UCSC Genome Browser database (Table S7). In silico CpG island prediction was performed by CpG Plot EMBOSS Application (http://www.ebi.ac.uk/Tools/emboss/cpgplot/index.html).Citation67
In silico validation of DNA methylation results
Previous methyl capture sequencing dataCitation39 were reanalyzed to confirm the DNA methylation status of the 4 markers on an independent set of colonic tissues (6 NAT, 15 adenomas, and 9 CRC). The same regions were examined by pyrosequencing and further by MethyLight PCR. Furthermore, the methylation status of the 4 candidate genes' whole promoter regions was analyzed using Illumina Infinium HumanMethylation450 BeadChip methylation array data of colonic tissue samples downloaded from The Cancer Genome Atlas (TCGA) database (https://genome-cancer.ucsc.edu/proj/site/hgHeatmap/) and from NCBI Gene Expression Omnibus database (GEO accession number: GSE48684).Citation44 The TCGA data set included DNA methylation array data from 39 patients with CRC and 39 paired NAT samples, while the methylation array data set of Luo et al.Citation44 contains 123 colonic biopsy specimens, including normal, adenoma, and CRC samples. All together, 99 cg IDs (CpG sites) located in the promoter regions of SFRP1, SFRP2, SDC2, and PRIMA1 genes were studied. Nine were localized on SFRP2 and SDC2 promoter sequences amplified by MethyLight assays. β-values were defined with respect to genome-wide CpG density dependent Poisson distributions in NAT and CRC samples, and Δβ-values were calculated by the differences of the β-values of samples groups.
DNA isolation from colonic tissue and plasma samples
For MethyLight reactions, colonic biopsies were lysed and digested with 4 mg/mL proteinase K for 16 h at 56°C, and DNA was extracted using High Pure PCR Template Preparation Kit (Roche Applied Science, 11796828001) according to the instructions of the manufacturer. DNA was eluted in 100 µl RNase- and DNase-free water and was stored at −20°C until use. DNA concentration was measured by NanoDrop-1000 spectrophotometer (Thermo Fisher Scientific). Cell-free DNA was isolated from 3.5 ml plasma samples using High Pure Viral Nucleic Acid Large Volume Kit (Roche Applied Science, 05114403001) and was eluted in 100 µl Elution Buffer. The quantity of cfDNA was measured by Qubit 1.0 fluorometer using Qubit dsDNA High Sensitivity Assay Kit (Thermo Fisher Scientific, Q32854).
Bisulfite conversion
Bisulfite conversion of tissue and plasma DNA samples was performed using EZ DNA Methylation Direct Kit (Zymo Research, D5021) according to the manufacturer's instructions. Bisulfite converted DNA was eluted in 20 µl elution buffer and was stored at −80°C in aliquots.
Multiplex bisulfite-specific pre-amplification
The low amount of cfDNA in plasma samples necessitated a more sensitive detection method.Citation68,Citation69 For this reason, a multiplex pre-amplification protocol was developed. Bisulfite-specific (BS) primers were designed with PyroMark Assay Design 2.0 software (Qiagen) to non-CpG regions of the 4 analyzed genes promoters, providing amplification of both methylated and non-methylated sequences (, Fig. S1). Primer pairs were tested in silico by BiSearch software (http://bisearch.enzim.hu).Citation70
Table 3. Position of pre-amplified and MethyLight reaction templates (human reference genome: GRCh38/hg38).
The pre-amplification was performed in 30 µl reaction volume containing 15 µl of Multiplex PCR Master Mix (2x) (Qiagen, 206143), the mixture of 4 BS primers (each 10 µM) in 200 nM final concentration (Table S7) and 10 ng of bisulfite-modified DNA. The bisulfite-specific PCR was performed with a Mastercycler ep Gradient S instrument (Eppendorf, 950010070). The amplification included a denaturation step at 95°C for 15 min; then 8 cycles of 95°C for 30 sec, touchdown step from 60°C to 56°C with a 0.5°C decrease/cycle for 2 min, 72°C for 30 sec; followed by 27 cycles of 95°C for 30 sec, 56°C for 2 min, and 72°C for 30 sec. PCR products were analyzed by gel electrophoresis using 2% agarose gels. For methylation status determination, EpiTect Methylated and Unmethylated Controls (Qiagen, 59695) were pre-amplified simultaneously in parallel with the samples as described above. Mixtures of methylated (M) and unmethylated (UM) DNA (10 ng) were prepared in the following combinations: 100% M; 50% M-50% UM; 25% M-75% UM; 10% M-90% UM; 5% M-95% UM; 2.5% M-97.5% UM; 100% UM. After pre-amplification, samples were diluted in 1:10,000 in RNase- and DNase-free water, and stored at −20°C until use.
MethyLight assay
MethyLight primers and probes, specific for the potentially methylated CpG dinucleotides located in the pre-amplified regions were designed using Primer Express 3.0.1. (ThermoFisher Scientific, 4363991) (, Table S7, Fig. S1). Each of the 20 µl PCR reactions contained 5 µl diluted DNA template; 10 µl LightCycler® 480 Probes Master (2x) (Roche Applied Science, 04887301001); 1.8 µl of each primer (10 µM) and 0.5 µl MGB TaqMan Probes (ThermoFisher Scientific, 4316034) in 250 nM final concentration which was 5' labeled with FAM or VIC as reporter dye. The MethyLight reaction was performed with LightCycler 480 System (Roche Applied Science, 5015278001). PCR conditions were as follows: 95°C for 10 min, 40 cycles of 95°C for 15 sec, 55°/60°C for 1 min, 72°C for 30 sec, and 40°C for 30 sec. The annealing temperature was 55°C in case of SFRP1 and SDC2, and 60°C in case of SFRP2 and PRIMA1, respectively. Each reaction was measured in duplicates, and non-templated control was used in every plate as well as methylated and non-methylated controls. The methylation levels of the samples were determined based on the standard curves generated from the mixtures of methylated and non-methylated standards pre-amplified in parallel with the analyzed samples. Valid methylation percentage range was defined by the Cp values between 0 and 100% methylated standard samples, and methylation level of all biologic specimens that fulfilled these criteria were calculated.
Immunohistochemical analysis
Colonic biopsies from the same patients whose biopsy samples were analyzed by MethyLight PCR (11 normal, 11 AD, and 10 CRC) were fixed in formalin and embedded in paraffin. All samples were diagnosed using hematoxylin and eosin (H&E) serial sections by an expert pathologist. Following deparaffinization and rehydration, microwave based antigen retrieval was performed in Tris-EDTA buffer (pH 9.0) (900 W/10 min, then 340 W/40 minutes). Samples were immunostained with SFRP1 (Abcam, ab4193; 1:50), SFRP2 (Sigma-Aldrich, HPA002652; 1:80), SDC2 (Abcam, ab191062; 1:80) and PRIMA1 (Sigma-Aldrich, HPA060047; 1:80) antibodies, which were visualized with diaminobenzidine - hydrogen peroxidase - chromogenic-substrate system (HISTOLS-DAB, Histopathology Ltd., 30014.K) and digitalized by Pannoramic 250 Flash II scanner (3DHISTECH Ltd). Digital slides were semi-quantitatively analyzed with Pannoramic Viewer (ver.:1.15.3; 3DHISTECH Ltd.) based on Quick-score (Q) method [scored by multiplying the percentage of positive cells (P) by the intensity (I: +3 for strong diffuse, +2 for moderate, +1 for weak, 0 for no immunostaining); formula: Q = P x I; Maximum = 300]. Primarily, we examined separately the epithelial and stromal compartment, then, these scores were summarized (Σ Q-score maximum: 600) to get comparable data with biopsy samples analyzed by ML.
Statistical analysis
For pyrosequencing analysis, heatmap representation R 3.3.1 was applied, illustrating the methylation pattern of selected CpG sites of SFRP1, SFRP2, SDC2, and PRIMA1 in normal, adenoma and CRC tissue samples. To determine methylation percentage values of plasma samples from MethyLight PCR cycles, linear derivation formula was applied from dilution series of each potential biomarker. For ROC curve analysis and for determination of sensitivity and specificity Medcalc 17.1 software was applied. Results of each marker were calculated as sole markers and combined as a panel. Multiple logistic regression equation was applied to analyze combined effects. In the case of in silico analysis of methylation array data, after normality checking, pairwise comparisons (AD vs. NAT/N, CRC vs. NAT/N, and CRC vs. AD) were applied using Student's t-test with a significance criterion P < 0.05. Mean Δβ-values were calculated by the differences of the average β-values of samples groups. The distribution of immunohistochemical Q-scores of different sample groups was evaluated using the Kolmogorov-Smirnov test. As all 4 examined potential biomarkers showed normal distribution, ANOVA and Tukey-Kramer post-hoc tests were applied (significance criterion P < 0.05).
Disclosure of potential conflicts of interest
No potential conflicts of interest were disclosed.
KEPI_A_1356957_Supplementary_materials.zip
Download Zip (329 KB)Acknowledgments
The authors declare that they have no competing interests. This study was supported by the ÚNKP 16–3 New National Excellence Program of The Ministry of Human Capacities, by the National Research, Development and Innovation Office (KMR-12–1–2012–0216 grant) and by the Hungarian Scientific Research Fund (OTKA-K111743 grant). The authors would like to thank Gabriella Kónyáné Farkas (2nd Department of Internal Medicine, Semmelweis University) for her technical assistance in immunohistochemical staining and Bernadett Tóth for the collection of blood samples and plasma preparation. We also thank Theo deVos (Epigenomics AG, Seattle, WA, USA) for his help and scientific comments.
References
- Ferlay J, Shin HR, Bray F, Forman D, Mathers C, Parkin DM. Estimates of worldwide burden of cancer in 2008: GLOBOCAN 2008. Int J Cancer. 2010;127(12):2893-917. doi:10.1002/ijc.25516. PMID:21351269.
- Siegel RL, Miller KD, Jemal A. Cancer statistics, 2015. CA Cancer J Clin 2015;65:5-29. doi:10.3322/caac.21254.
- Vermeer NC, Snijders HS, Holman FA, Liefers GJ, Bastiaannet E, van de Velde CJ, Peeters KC. Colorectal cancer screening: Systematic review of screen-related morbidity and mortality. Cancer Treat Rev. 2017;54:87-98. doi:10.1016/j.ctrv.2017.02.002.
- Hassan C, Quintero E, Dumonceau JM, Regula J, Brandão C, Chaussade S, Dekker E, Dinis-Ribeiro M, Ferlitsch M, Gimeno-García A et al. Post-polypectomy colonoscopy surveillance: European Society of Gastrointestinal Endoscopy (ESGE) Guideline. Endoscopy 2013;45(10):842-51. doi:10.1055/s-0033-1344548.
- Kumar M, Cash BD. Screening and Surveillance of Colorectal Cancer Using CT Colonography. Curr Treat Options Gastroenterol. 2017;15(1):168-83. doi:10.1007/s11938-017-0121-7. PMID:28130651.
- Winawer SJ, Stewart ET, Zauber AG, Bond JH, Ansel H, Wave JD, Hall D, Hamlin JA, Schapiro M, O'Brien MJ et al. A comparison of colonoscopy and double-contrast barium enema for surveillance after polypectomy. N Engl J Med 2000;342:1766-72. doi:10.1056/NEJM200006153422401. PMID:10852998.
- Kahi CJ, Boland CR, Dominitz JA, Giardiello FM, Johnson DA, Kaltenbach T, Lieberman D, Levin TR, Robertson DJ, Rex DK. Colonoscopy Surveillance after Colorectal Cancer Resection: Recommendations of the US Multi-Society Task Force on Colorectal Cancer. Am J Gastroenterol. 2016;111(3):337-46; quiz 347. doi:10.1038/ajg.2016.22. PMID:26871541.
- Ahlquist DA, Sargent DJ, Loprinzi CL, Levin TR, Rex DK, Ahnen DJ, Knigge K, Lance MP, Burgart LJ, Hamilton SR, et al. Stool DNA and occult blood testing for screen detection of colorectal neoplasia. Ann Intern Med. 2008;149:441-50. doi:10.7326/0003-4819-149-7-200810070-00004.
- Robertson DJ, Lee JK, Boland CR, Dominitz JA, Giardiello FM, Johnson DA, Kaltenbach T, Lieberman D, Levin TR, Rex DK. Recommendations on Fecal Immunochemical Testing to Screen for Colorectal Neoplasia: A Consensus Statement by the US Multi-Society Task Force on Colorectal Cancer. Am J Gastroenterol. 2017;112(1):37-53. doi:10.1038/ajg.2016.492.
- Imperiale TF, Ransohoff DF, Itzkowitz SH, Levin TR, Lavin P, Lidgard GP, Ahlquist DA, Berger BM. Multitarget stool DNA testing for colorectal-cancer screening. N Engl J Med. 2014;370(14):1287-97. doi:10.1056/NEJMoa1311194.
- Heigh RI, Yab TC, Taylor WR, Hussain FT, Smyrk TC, Mahoney DW, Domanico MJ, Berger BM, Lidgard GP, Ahlquist DA. Detection of colorectal serrated polyps by stool DNA testing: comparison with fecal immunochemical testing for occult blood (FIT). PLoS One 2014;9:e85659. doi:10.1371/journal.pone.0085659. PMID:24465639.
- Kadiyska T, Nossikoff A. Stool DNA methylation assays in colorectal cancer screening. World J Gastroenterol. 2015;21(35):10057-61. doi:10.3748/wjg.v21.i35.10057.
- Diaz LA Jr, Bardelli A. Liquid biopsies: genotyping circulating tumor DNA. J. Clin. Oncol. 2014;32:579-86. doi:10.1200/JCO.2012.45.2011. PMID:24449238.
- Mandel P, Metais P. Les acides nucleiques du plasma sanguin chez l'homme. C R Acad Sci Paris. 1948;142:241-43.
- Leon SA, Shapiro B, Sklaroff DM, Yaros MJ. Free DNA in the serum of cancer patients and the effect of therapy. Cancer Res. 1977;37:646-50. PMID:837366.
- Stroun M, Anker P, Maurice P, Lyautey J, Lederrey C, Beljanski M. Neoplastic characteristics of the DNA found in the plasma of cancer patients. Oncology. 1989; 46:318-22. doi:10.1159/000226740. PMID:2779946.
- Fujita S, Sugano K, Fukayama N, Moriya Y, Sugihara K, Akasu T. Detection of K-ras point mutations in mesenteric venous blood from colorectal cancer patients by enriched polymerase chain reaction and single-strand conformation polymorphism analysis. Jpn J Clin Oncol. 1996;26:417-21.; doi:10.1093/oxfordjournals.jjco.a023258. PMID: 9001346.
- Kopreski MS, Benko FA, Borys DJ, Khan A, McGarrity TJ, Gocke CD. Somatic mutation screening: identification of individuals harboring K-ras mutations with the use of plasma DNA. J Natl Cancer Inst. 2000;92:918-23. doi:10.1093/jnci/92.11.918. PMID:10841827.
- Borchers R, Heinzlmann M, Zahn R, Witter K, Martin K, Loeschke K, Folwaczny C. K-ras mutations in sera of patients with colorectal neoplasias and long-standing inflammatory bowel disease. Scand J Gastroenterol 2002;37:715-18. doi:10.1080/00365520212505. PMID:12126252.
- Ling E, Fich A, Man S, Wolfson M, Mikhailowsky R, Lamprecht SA. Detection of tumor mutant APC DNA in plasma of patients with sporadic colorectal cancer. In Vivo (Athens, Greece). 2000;14(4):543-6. PMID: 10945171.
- Hammel P, Leroy-Viard K, Chaumette MT, Villaudy J, Falzone MC, Rouillard D, Hamelin R, Boissier B, Remvikos Y. Correlations between p53-protein accumulation, serum antibodies and gene mutation in colorectal cancer. Int J Cancer. 1999;81:712-18. doi:10.1002/(SICI)1097-0215(19990531)81:5<712::AID-IJC7>3.0.CO;2-0. PMID:10328221.
- Patai AV, Molnár B, Kalmár A, Schöller A, Tóth K, Tulassay Z. Role of DNA methylation in colorectal carcinogenesis. Dig Dis. 2012;30(3):310-5. doi:10.1159/000337004. PMID:22722557.
- deVos T, Tetzner R, Model F, Weiss G, Schuster M, Distler J, Steiger KV, Grützmann R, Pilarsky C, Habermann JK et al. Circulating methylated SEPT9 DNA in plasma is a biomarker for colorectal cancer. Clin Chem. 2009;55(7):1337-46. doi:10.1373/clinchem.2008.115808. PMID:19406918.
- Tóth K, Sipos F, Kalmár A, Patai AV, Wichmann B, Stoehr R, Golcher H, Schellerer V, Tulassay Z, Molnár B. Detection of methylated SEPT9 in plasma is a reliable screening method for both left- and right-sided colon cancers. PLoS One. 2012;7(9):e46000. doi:10.1371/journal.pone.0046000. PMID:23049919.
- Tóth K, Wasserkort R, Sipos F, Kalmár A, Wichmann B, Leiszter K, Valcz G, Juhász M, Miheller P, Patai ÁV et al. Detection of methylated septin 9 in tissue and plasma of colorectal patients with neoplasia and the relationship to the amount of circulating cell-free DNA. PLoS One. 2014;9(12):e115415. doi:10.1371/journal.pone.0115415.
- Molnár B, Tóth K, Barták BK, Tulassay Z. Plasma methylated septin 9: a colorectal cancer screening marker. Expert Rev Mol Diagn. 2015;15(2):171-84. doi:10.1586/14737159.2015.975212.
- Potter NT, Hurban P, White MN, Whitlock KD, Lofton-Day CE, Tetzner R, Koenig T, Quigley NB, Weiss G. Validation of a real-time PCR-based qualitative assay for the detection of methylated SEPT9 DNA in human plasma. Clin Chem. 2014;60(9):1183-91. doi:10.1373/clinchem.2013.221044.
- Johnson DA, Barclay RL, Mergener K, Weiss G, König T, Beck J, Potter NT. Plasma Septin9 versus fecal immunochemical testing for colorectal cancer screening: a prospective multicenter study. PLoS One. 2014;9(6):e98238. doi:10.1371/journal.pone.0098238.
- Nian J, Sun X, Ming S, Yan C, Ma Y, Feng Y, Yang L, Yu M, Zhang G, Wang X. Diagnostic Accuracy of Methylated SEPT9 for Blood-based Colorectal Cancer Detection: A Systematic Review and Meta-Analysis. Clin Transl Gastroenterol. 2017;8(1):e216. doi:10.1038/ctg.2016.66.
- Patai ÁV, Valcz G, Hollósi P, Kalmár A, Péterfia B, Patai Á, Wichmann B, Spisák S, Barták BK, Leiszter K et al. Comprehensive DNA Methylation Analysis Reveals a Common Ten-Gene Methylation Signature in Colorectal Adenomas and Carcinomas. PLoS One. 2015;10(8):e0133836. doi:10.1371/journal.pone.0133836.
- Valcz G, Patai AV, Kalmár A, Péterfia B, Fűri I, Wichmann B, Műzes G, Sipos F, Krenács T, Mihály E et al. Myofibroblast-derived SFRP1 as potential inhibitor of colorectal carcinoma field effect. PLoS One. 2014;9(11):e106143. doi:10.1371/journal.pone.0106143.
- Kalmár A, Péterfia B, Hollósi P, Galamb O, Spisák S, Wichmann B, Bodor, Tóth K, Patai ÁV, Valcz G et al. DNA hypermethylation and decreased mRNA expression of MAL, PRIMA1, PTGDR and SFRP1 in colorectal adenoma and cancer. BMC Cancer. 2015;15:736. doi:10.1186/s12885-015-1687-x.
- Oh T, Kim N, Moon Y, Kim MS, Hoehn BD, Park CH, Kim TS, Kim NK, Chung HC, An S.. Genome-wide identification and validation of a novel methylation biomarker, SDC2, for blood-based detection of colorectal cancer. J Mol Diagn. 2013;15(4):498-507. doi:10.1016/j.jmoldx.2013.03.004.
- Mitchell SM, Ross JP, Drew HR, Ho T, Brown GS, Saunders NF, Duesing KR, Buckley MJ, Dunne R, Beetson I et al. A panel of genes methylated with high frequency in colorectal cancer. BMC Cancer. 2014;14:54. doi:10.1186/1471-2407-14-54.
- Silva AL, Dawson SN, Arends MJ, Guttula K, Hall N, Cameron EA, Huang TH, Brenton JD, Tavaré S, Bienz M, et al. Boosting Wnt activity during colorectal cancer progression through selective hypermethylation of Wnt signaling antagonists. BMC Cancer. 2014;14:891. doi:10.1186/1471-2407-14-891.
- Xie HQ, Liang D, Leung KW, Chen VP, Zhu KY, Chan WK, Choi RC, Massoulie J, Tsim KW. Targeting acetylcholinesterase to membrane rafts: a function mediated by the proline-rich membrane anchor (PRiMA) in neurons. J Biol Chem. 2010;285(15):11537-46. doi:10.1074/jbc.M109.038711.
- Rapraeger AC. Syndecan-regulated receptor signaling. J Cell Biol. 2000;149(5):995-8. doi:10.1083/jcb.149.5.995.
- Chen YZ, Liu D, Zhao YX, Wang HT, Gao Y, Chen Y. Aberrant promoter methylation of the SFRP1 gene may contribute to colorectal carcinogenesis: a meta-analysis. Tumour Biol. 2014;35(9):9201-10. doi:10.1007/s13277-014-2180-x.
- Galamb O, Kalmár A, Péterfia B, Csabai I, Bodor A, Ribli D, Krenács T, Patai ÁV, Wichmann B, Barták BK et al. Aberrant DNA methylation of WNT pathway genes in the development and progression of CIMP-negative colorectal cancer. Epigenetics. 2016;11(8):588-602. doi:10.1080/15592294.2016.1190894.
- Sabunciyan S, Aryee MJ, Irizarry RA, Rongione M, Webster MJ, Kaufman WE, Murakami P, Lessard A, Yolken RH, Feinberg AP et al. Genome-wide DNA methylation scan in major depressive disorder. PLoS One. 2012;7(4):e34451. doi:10.1371/journal.pone.0034451. PMID:22511943.
- Vanaja DK, Ballman KV, Morlan BW, Cheville JC, Neumann RM, Lieber MM, Tindall DJ, Young CY. PDLIM4 repression by hypermethylation as a potential biomarker for prostate cancer. Clin Cancer Res. 2006;12(4):1128-36. doi:10.1158/1078-0432.CCR-05-2072.
- Tong WG, Wierda WG, Lin E, Kuang SQ, Bekele BN, Estrov Z, Wei Y, Yang H, Keating MJ, Garcia-Manero G. Genome-wide DNA methylation profiling of chronic lymphocytic leukemia allows identification of epigenetically repressed molecular pathways with clinical impact. Epigenetics. 2010;5(6):499-508. doi:10.4161/epi.5.6.12179.
- Kim J, Kim S. In silico Identification of SFRP1 as a Hypermethylated Gene in Colorectal Cancers. Genomics Inform. 2014;12(4):171-80. doi:10.5808/GI.2014.12.4.171.
- Luo Y, Wong CJ, Kaz AM, Dzieciatkowski S, Carter KT, Morris SM, Wang J, Willis JE, Makar KW, Ulrich CM et al. Differences in DNA methylation signatures reveal multiple pathways of progression from adenoma to colorectal cancer. Gastroenterology. 2014;147(2):418-29. e8. doi:10.1053/j.gastro.2014.04.039.
- Razin A, Kantor B. DNA methylation in epigenetic control of gene expression. Prog Mol Subcell Biol. 2005;38:151-67. doi:10.1007/3-540-27310-7_6. PMID: 15881894.
- Crowley E, Di Nicolantonio F, Loupakis F, Bardelli A. Liquid biopsy: monitoring cancer-genetics in the blood. Nat Rev Clin Oncol. 2013;10(8):472-84. doi:10.1038/nrclinonc.2013.110.
- Henriksen SD, Madsen PH, Larsen AC, Johansen MB, Drewes AM, Pedersen IS, Krarup H, Thorlacius-Ussing O. Cell-free DNA promoter hypermethylation in plasma as a diagnostic marker for pancreatic adenocarcinoma. Clin Epigenetics. 2016;8:117. doi:10.1186/s13148-016-0286-2.
- Zhang Y, Wang R, Song H, Huang G, Yi J, Zheng Y, Wang J, Chen L. Methylation of multiple genes as a candidate biomarker in non-small cell lung cancer. Cancer Lett. 2011;303(1):21-8. doi:10.1016/j.canlet.2010.12.011.
- Qi J, Zhu YQ, Luo J, Tao WH. Hypermethylation and expression regulation of secreted frizzled-related protein genes in colorectal tumor. World J Gastroenterol. 2006;12(44): 7113-17. doi:10.3748/wjg.v12.i44.7113. PMID:17131472.
- Rawson JB, Manno M, Mrkonjic M, Daftary D, Dicks E, Buchanan DD, Younghusband HB, Parfrey PS, Young JP, Pollett A et al. Promoter methylation of Wnt antagonists DKK1 and SFRP1 is associated with opposing tumor subtypes in two large populations of colorectal cancer patients. Carcinogenesis. 2011 May;32(5):741-7. doi:10.1093/carcin/bgr020.
- Lyu Z, Chen H, Jiang L, Zheng H, Hu J. Detection of RASSF2 and sFRP1 promoter region methylation in sporadic colorectal cancer patients. Zhonghua Wei Chang Wai Ke Za Zhi. 2014;17(1):41-4.
- Bedin C, Enzo MV, Del Bianco P, Pucciarelli S, Nitti D, Agostini M. Diagnostic and prognostic role of cell-free DNA testing for colorectal cancer patients. Int J Cancer. 2016;140(8):1888-98. doi:10.1002/ijc.30565. PMID:27943272.
- Gonzalo V, Lozano JJ, Muñoz J, Balaguer F, Pellisé M, Rodríguez de Miguel C, Andreu M, Jover R, Llor X, Giráldez MD et al. Aberrant gene promoter methylation associated with sporadic multiple colorectal cancer. PLoS One. 2010;5(1):e8777. doi:10.1371/journal.pone.0008777.
- Andresen K, Boberg KM, Vedeld HM, Honne H, Hektoen M, Wadsworth CA, Clausen OP, Karlsen TH, Foss A, Mathisen O et al. Novel target genes and a valid biomarker panel identified for cholangiocarcinoma. Epigenetics. 2012;7(11):1249-57. doi:10.4161/epi.22191.
- Chim CS, Pang R, Fung TK, Choi CL, Liang R. Epigenetic dysregulation of Wnt signaling pathway in multiple myeloma. Leukemia. 2007;21(12):2527-36. doi:10.1038/sj.leu.2404939.
- Lu H, Huang S, Zhang X, Wang D, Zhang X, Yuan X, Zhang Q, Huang Z. DNA methylation analysis of SFRP2, GATA4/5, NDRG4 and VIM for the detection of colorectal cancer in fecal DNA. Oncol Lett. 2014;8(4):1751-1756. doi:10.3892/ol.2014.2413.
- Zhang H, Zhu YQ, Wu YQ, Zhang P, Qi J. Detection of promoter hypermethylation of Wnt antagonist genes in fecal samples for diagnosis of early colorectal cancer. World J Gastroenterol. 2014;20(20):6329-35. doi:10.3748/wjg.v20.i20.6329.
- Tang D, Wang D, Li H. Combination analysis of hypermethylated SFRP1 and SFRP2 gene in fecal as a novel epigenetic biomarker panel for colorectal cancer screening. J Nanjing Med Univ (Eng) 2008;22, 96-101. doi:10.1016/S1007-4376(08)60020-9.
- Huang ZH, Li LH, Yang F, Wang JF. Detection of aberrant methylation in fecal DNA as a molecular screening tool for colorectal cancer and precancerous lesions. World J Gastroenterol. 2007 Feb 14;13(6):950-4. doi:10.3748/wjg.v13.i6.950.
- Zhang X, Song YF, Lu HN, Wang DP, Zhang XS, Huang SL, Sun BL, Huang ZG. Combined detection of plasma GATA5 and SFRP2 methylation is a valid noninvasive biomarker for colorectal cancer and adenomas. World J Gastroenterol. 2015 Mar 7;21(9):2629-37. doi:10.3748/wjg.v21.i9.2629.
- Ryu H, Lee J, Yang S, Park H, Choi S, Jung KC, Lee ST, Seong JK, Han IO, Oh ES. Syndecan-2 functions as a docking receptor for promatrix metalloproteinase-7 in human colon cancer cells. J Biol Chem. 2009;284(51):35692-701. doi:10.1074/jbc.M109.054254.
- Huang X, Xiao DW, Xu LY, Zhong HJ, Liao LD, Xie ZF, Li EM. Prognostic significance of altered expression of SDC2 and CYR61 in esophageal squamous cell carcinoma. Oncol Rep. 2009;21:1123-9. doi:10.3892/or_00000332. PMID: 19288017.
- Chong Y, Mia-Jan K, Ryu H, Abdul-Ghafar J, Munkhdelger J, Lkhagvadorj S, Jung SY, Lee M, Ji SY, Choi E, Cho MY. DNA methylation status of a distinctively different subset of genes is associated with each histologic Lauren classification subtype in early gastric carcinogenesis. Oncol Rep. 2014;31(6):2535-44. doi:10.3892/or.2014.3133.
- Dobbertin A, Hrabovska A, Dembele K, Camp S, Taylor P, Krejci E, Bernard V. Targeting of acetylcholinesterase in neurons in vivo: A dual processing function for the proline-rich membrane anchor subunit and the attachment domain on the catalytic subunit. J Neurosci. 2009;29(14):4519-30. doi:10.1523/JNEUROSCI.3863-08.2009.
- Perrier AL, Massoulié J, Krejci E. PRiMA: The membrane anchor of acetylcholinesterase in the brain. Neuron. 33:275-285. doi:10.1016/S0896-6273(01)00584-0. PMID:11804574.
- Janowsky DS, el-Yousef MK, Davis JM, Sekerke HJ. A cholinergicadrenergic hypothesis of mania and depression. Lancet. 1972;2(7778):632-5. doi:10.1016/S0140-6736(72)93021-8.
- Rice P, Longden I, Bleasby A. EMBOSS: the European Molecular Biology Open Software Suite. Trends Genet. 2000;16(6):276-7. doi:10.1016/S0168-9525(00)02024-2.
- Dietrich D, Lesche R, Tetzner R, Krispin M, Dietrich J, Haedicke W, Schuster M, Kristiansen G. Analysis of DNA methylation of multiple genes in microdissected cells from formalin-fixed and paraffin-embedded tissues. J Histochem Cytochem. 2009; 57(5):477-89. doi:10.1369/jhc.2009.953026. PMID:19153192.
- Fackler MJ, Malone K, Zhang Z, Schilling E, Garrett-Mayer E, Swift-Scanlan T, Lange J, Nayar R, Davidson NE, Khan SA, Sukumar, . Quantitative multiplex methylation-specific PCR analysis doubles detection of tumor cells in breast ductal fluid. S Clin Cancer Res. 2006;12(11 Pt 1):3306-10. doi:10.1158/1078-0432.CCR-05-2733.
- Tusnady GE, Simon I, Varadi A, Aranyi T. BiSearch: primer-design and search tool for PCR on bisulfite-treated genomes. Nucleic Acids Res. 2005;33(1):e9. doi:10.1093/nar/gni012.