
ABSTRACT
Recent studies have shown that loss of TET1 may play a significant role in the formation of tumors. Because genomic instability is a hallmark of cancer, we examined the potential involvement of 10-11 translocation 1 (TET1) in the DNA damage response (DDR). Here we demonstrate that, in response to clinically relevant doses of ionizing radiation (IR), human glial cells made TET1-deficient with lentiviral vectors displayed greater numbers of colony forming units and lower levels of apoptotic markers compared with glial cells transduced with control vectors; yet, they harbored greater DNA strand breaks. The G2/M check point and expression of cyclin B1 were greatly diminished in TET1-deficient cells, and TET1-deficient cells displayed lower levels of γH2A.x following exposure to IR. Levels of DNA-PKcs, which are DNA-PK complex members, were lower in TET1-deficient cells compared with control cell lines. However, levels of ATM were similar in both cell lines. Cyclin B1, DNA-PKcs, and γH2A.x levels were each rescued by reintroduction of the TET1 catalytic domain. Finally, cytosine methylation within intron 1 of PRKDC, the gene encoding DNA-PKcs, was significantly higher upon depletion of TET1. Taken together, this study illustrates the involvement of TET1 in the different arms of the DDR and suggests its loss results in the continued survival of cells with genomic instability.
Introduction
The etiologies of numerous cancers and neurologic diseases involve alterations in the DNA methylation landscape.Citation1 Methylation at the carbon-5 position of cytosine (5mC) in a CpG dinucleotide context near a transcriptional start site is associated with repressive modifications in chromatin architecture.Citation2-3 Cancer cells frequently display global cytosine hypomethylation, but they show hypermethylation in CpG islands near gene promoters of tumor suppressor genes.Citation4 Gene-specific changes in methylation may even have functional significance similar to that of mutations,Citation5-6 and efforts are currently directed toward understanding the interface between the genome and epigenome in an attempt to better understand, treat, and prevent diseases such as cancers.Citation5
Although DNA methylation is the best-known epigenetic modification, the discovery that leukemia-associated 10-11 translocation proteins (TET1–3) catalyze the hydroxylation of 5mC to 5-hydroxymethylcytosine (5hmC) in mammalian DNA provided recent insight into active demethylation of cytosines and highlighted the dynamic nature of the epigenetic mark once thought to be static.Citation7-9 The 5hmC modification is found in relatively high levels at enhancers, promoters, and gene bodies of actively transcribed genes, and can be converted to unmodified cytosine through cellular deaminases and base excision repair,Citation9 or by iterative TET activity followed by thymine DNA glycosylase activity and base excision repair.Citation10 Tet1 mediates changes to the DNA methylation landscape in response to environmental and physiologic factors. For example, TET1 activity has been shown to increase in response to reactive oxygen species and environmental insults,Citation11-13 and oncogenic EGFR signaling was shown to decrease Tet1 expression.Citation14
Interestingly, recent studies have shown that Tet1 is a tumor suppressor in B cell lymphomas.Citation15,Citation16 Both 5hmC and TET expression have been shown to be downregulated in human cancers and higher TET mRNA levels in tumors are associated with greater patient survival, suggesting their loss may play a role in tumorigenesis and resistance to therapy.Citation17 Despite the acceptance of a role for TET1 in supporting expression of cytoprotective genes that combat cellular stress, it is unknown how TET1 may be involved in protecting cells against more severe injuries, such as DNA strand breaks. This study focuses on understanding the contribution of TET1 to the DNA damage response (DDR) evoked by ionizing radiation (IR) and topoisomerase inhibition. DNA strand breaks threaten the genome, and the ATM-, ATR-, and DNA-PK-driven pathways have evolved to initiate the DDR, which involves DNA repair, cell cycle arrest, and apoptosis to prevent the survival of cells harboring genomic instability.Citation18 These pathways are regulated by intracellular signals, and, interestingly, epigenetic mechanisms in some contexts.Citation5
This study investigates the involvement of TET1 in the DDR. Using TET1-deficient glial-derived cell lines, we observed a blunted DDR after exposure to IR; the G2/M check point was transient and apoptosis and DNA repair were compromised. Not surprisingly, greater survival was observed in TET1-deficient glial cell lines following exposure to IR. Overall, we report that TET1 has an active role in maintaining genomic stability in proliferating glial cells.
Material and methods
Chemicals and reagents
Unless otherwise stated, all chemicals and reagents were obtained from Sigma-Aldrich. Lentiviral particles were generated according to established protocols, and shRNA and empty vector constructs were obtained from Thermo Scientific. Mouse anti-TET1 antibody (Abnova, #H00080312-M01) recognizes the C-terminus of aminoacids 2038–2136 of the peptide. FLAG-tagged TET1 catalytic domain (TET1-CD)-encoding plasmid was obtained from Dr. Hongjun Song's laboratory (JHU) and used according to published methods. TET1 activities of plasmids were measured by immunodotblotting using rabbit anti-5hmC antibody (Active Motif, #39769) and equal loading was confirmed using mouse anti-ssDNA antibody (Sigma, #MAB3034) according to published methods.
Antibodies used
rabbit anti-cleaved Parp1 (Cell Signaling, #9542), rabbit anti-cleaved Caspase-3 (#9661), mouse anti-GAPDH (Abcam #ab8245), rabbit anti-Mre11 (Cell signaling, #4847), rabbit anti-phospho-Mre11 (Ser676) (Cell Signaling, #4859), rabbit anti-Rad50 (Cell Signaling, #3427), rabbit anti-p95 (Cell Signaling, #14956), rabbit anti-phospho-p95 (Ser343) (Cell Signaling, #3001), mouse anti-γH2A.x (Ser139) (Millipore, #05–636), rabbit anti-cyclinB1 (Abcam, #2949), mouse anti-FLAG (Sigma, #F3165), rabbit anti-phospho-ATM (Cell Signaling, #5883), mouse anti-phospho-p53 (Ser 15) (Cell Signaling, #9286), rabbit anti-p53 (Cell Signaling, #2527), rabbit anti-ATM (Cell Signaling, #2873), mouse anti-DNA-PK (Millipore, #NA-57), rabbit anti-phospho-DNA-PK (Millipore, Ser2056) (Millipore, #E509).
Cell lines and treatments
The human cell lines A172, U373, and HEK293 were obtained from ATCC. The human, glial-derived 10B1 cells were a kind gift from Eugene O. Major (NINDS, NIH). Cell lines were cultured in DMEM supplemented with 10% fetal bovine serum. Ionizing radiation was delivered using a cesium-137 source gammacell irradiator at a dose of 5.55 cGy/sec. Transfections were performed using Lipofectamine 2000 (Life Technologies) according to manufacturer recommendations. Five pLKO plasmids encoding shRNA against Tet1 were screened for knockdown efficiency in HEK293 cells and clone TRCN0000075026 and TRCN0000075027 were used for TET1 knockdown. Control cells were transduced with empty vector pLKO. Following puromycin selection and Tet1 knockdown was validated by qRT-PCR. The catalytic domain of human TET1 was cloned from HEK293 cells. In brief, the TET1 catalytic domain corresponding to aminoacids 1235–2136 was amplified with Taq DNA polymerase and pfu Taq High Fidelity Taq polymerase (Promega) using the following primers:
F: ATACCGGAATTCATGGACTACAAGGACGACGATGACAAGGGAGTATTTCCACCACTCACTCAG
R: ATACCGGGTACC.TCATCAGACCCAATGGTTATAGGG
PCR product was run on a 1% agarose gel to confirm expected size of 2700 bp, purified, and restriction digested with EcoR1 and Kpn1 before insertion into pcDNA3.1(-) mammalian expression vector under control of CMV promoter. Plasmids were sequenced to validate correct orientation and sequence of the insert (JHU DNA Analysis Facility)
Colony formation assay
Cells were irradiated in suspension at the indicated dose, plated in 6-well plates in duplicate at 2000, 1000, or 500 cells per well, and cultured for 12 d. Cells were then fixed with 3.7% formaldehyde for 15 min, permeabilized with ice-cold methanol, and stained with 0.1% Crystal Violet. Cells were destained by washing with water and plates were air-dried. Colonies of ≥50 cells were included in calculating clonogenic potential.
Western blotting
Lysates were prepared using RIPA and included addition of protease inhibitors. Protein concentrations were measured using the Bradford Assay, and 30 μg total protein was separated on a 4–20% Tris-glycine gradient gel (Life Technologies). Protein was transferred to a nitrocellulose membrane, blocked with 0.5% casein, and incubated overnight at 4°C with indicated antibodies. Blots were incubated with secondary antibody (1:10,000) for 1 h before visualization on the Licor Odyssey Imager.
Immunodotblotting
Genomic DNA was isolated using GenElute Mammalian Genomic DNA Kit (Sigma) and measured using a NanoDrop (Thermo Scientific). DNA (250 ng) was denatured with 0.4 M NaOH at 95°C for 10 min. DNA was immobilized on nitrocellulose membrane, dried, and fixed by vacuum baking at 80°C. The membrane was then blocked with 0.5% casein and probed with antibodies against 5hmC (Active Motif; 1:8000) and mouse anti-ssDNA (Abcam; 1:1500) simultaneously for normalizing 5hmC. Antibody binding was measured using the Licor Odyssey. Methylene blue staining of DNA (0.04% with 0.3 M sodium acetate) was used for normalization of 8-oxo-dG and 5mC antibodies. Intensity of methylene blue was measured using ImageJ software (National Institutes of Health). Linear range of detection of DNA was determined by loading increasing amounts of ssDNA and probing with increasing dilutions of anti-ssDNA antibody. Antibody specificity for 5hmC was confirmed by blocking the antibody with 2 µg/ml 5hmC or 5mC at room temperature for 2 h and blotting DNA from mock-transfected and TET1-overexpressing HEK293 cells.
Cell cycle analysis
Cells were harvested using 0.25% trypsin-EDTA, resuspended in 300 μl of PBS at 4°C, and fixed overnight at −20°C in 1:1 methanol:acetone, added drop wise with intermittent vortexing. Cells were washed with cold PBS and incubated with 0.25 ml of 5 μg/ml RNase, 15 min at 37°C. Propidium iodide (0.25 ml of 100 μg/ml; Life Technologies) was added for 60 min at room temperature. DNA content was measured using a FACSCalibur flow cytometer and analyzed using Cell Quest software (BD Biosciences). Doublet discrimination was accomplished by gating on forward scatter-H v. FL3A and FL3A v. FL3-H. At least 10,000 events were analyzed in each sample.
DNA damage assays
DNA double strand breaks were detected using the Trevigen neutral comet assay according to supplier-recommended conditions (Trevigen, 4250–050-K). DNA single strand breaks were detected using the Phoenix Flow Systems APO-BrdU assay (Phoenix Flow Systems, AU-1001) using the supplied protocol. DNA content and FITC-labeled single strand breaks were detected and quantified using a FACSCalibur flow cytometer and Cell Quest software (BD Biosciences).
Immunofluorescence
Cells (5 × 10⁴)were plated on glass coverslips in 35-mm dishes and allowed to adhere overnight. Cells were irradiated at the indicated dose and time and fixed with 3.7% formaldehyde for 15 min. Cells were washed with PBS and permeabilized with 1% Triton-X 100 in PBS. Following blocking with 2.5% BSA, cells were incubated with mouse anti-γH2A.x (Ser139, Millipore clone JBW301) 1:400, at room temperature. Coverslips were washed and then incubated with 1:150 Alexa-Fluor 568 (Life Technologies) anti-mouse secondary antibody for 30 min. Coverslips were washed and mounted with ProLong-Gold Antifade with DAPI (Cell-Signaling). Images (20X) were taken using a fluorescent microscope (Zeiss Apotome System).
Hoechst staining for apoptotic nuclei
Apoptosis was measured by scoring nuclear morphology as described previously.Citation33 Briefly, cells were incubated with Hoechst 33342 (1 μg/ml, Sigma) for 10–15 min at 37°C. Using a fluorescent microscope, 3 different viewings were randomly chosen and photographed, with each area containing between 300 and 500 cells. The percentage of cells undergoing nuclear condensation was calculated for each viewing area.
qRT-PCR - Total RNA was extracted from cells using RNeasy Mini Kit (Qiagen). cDNA was made by reverse-transcribing 1 µg of total RNA using MuLV Reverse Transcriptase and Oligo (dT) primers (Applied Biosystems). qRT-PCR was performed with a Bio-Rad CFX detection System (Bio-Rad) and expression of target genes was measured using Power SYBR green PCR kit (Applied Biosystems). Samples were amplified in triplicate and relative gene expression was analyzed using Bio-Rad CFX manager software and normalized to 18S RNA. Primer sequences (IDT) are as follows:
TET1 F: GAGCCTGTTCCTCGATGTGG
TET1 R: CAAACCCACCTGAGGCTGTT
TET2 F: CACTGCATGTTTGGACTTCTG
TET2 R: TGCTCATCCTCAGGTTTTCC
PRKDC F: CATGGAAGAAGATCCCCAGA
PRKDC R: TGGGCACACCACTTTAACAA
18S F: ACAGGATTGACAGATTGATAGCTC
18S R: CAAATCGCTCCACCAACTAAGAA
GAPDH F: ACATCGCTCAGACACCATG
GAPDH R: GTAGTTGAGGTCAATGAAGGG
Bisulfite pyrosequencing assay
DNA methylation was assessed by pyrosequencing of the PCR products. DNA (500ng) was bisulfite-converted using the EZ DNA Methylation-Gold Kit, according to the manufacturer's protocol (Zymo Research). Primers were designed against regions within the promoter CpG island and the first intron of the PRKDC gene. For each region, 2 sets of primers were designed. Thermocycling was performed using the Veriti thermal cycler (Life Technologies), and 25 ng of bisulfite-treated DNA was used with the first outer set of primers. An additional nested PCR was performed with 2 µL of the first PCR reaction and one biotinylated primer (other primer being unmodified). Amplification for both PCR steps consisted of 40 cycles (94ºC for 1 min, 53ºC for 30 sec, 72ºC for 1 min). PCR products were confirmed on agarose gels. Pyro Gold reagents were used to prepare samples for pyrosequencing according to manufacturer's instructions (Qiagen). For each sample, biotinylated PCR product was mixed with streptavidin-coated sepharose beads (GE Healthcare), binding buffer, and Milli-Q water, and shaken at room temperature. A vacuum preptool was used to isolate the sepharose bead-bound single-stranded PCR products. PCR products were then released into a PSQ HS 96-plate containing pyrosequencing primers in annealing buffer. Pyrosequencing reactions were performed on the PyroMark MD System (Qiagen). CpG methylation quantification was performed with the Pyro Q-CpGt 1.0.9 software (Qiagen). An internal quality-control step was used to disqualify any assays that contained unconverted DNA. Percentage of methylation at each CpG as determined by pyrosequencing was compared among DNA from empty vector and shRNA-mediated Tet1 knockdown cell line samples.
Primer sequences are provided below:
CGI Outside Primers
F: GGTTATTTGGTGTTGGATTTGGTTA
R: ACACCAACTCTCCAAATATATTCCTCT-AAC
CGI Inside Primers
F: AGATAAAATAAGAGAGGGGTTTAGGT-TAAG
R: BH-ATCTCATTATATTACCCAAACTAA-TCT
CGI Pyro Primer
One-GGTTAAGAGTTTTAAGTTTGTTTTT
Two-GTAGTTTTAATATTTTAGGAAGTTGAG
Int1 Outside Primers
F: ATAGGAGATTTATATAATTAAGTATT-TG
R: CTCCCCAATTCAAACTATTCTCCTACC
Int1 Inside Primers
F: TAGGTATTGTTAAAGAGTTA
R: BH-AATTTCACCATATTAATCAAACTA-ATCTC
Int1 Pyro Primers
One-ATTTTTTTTAAAGTAGGAA
Two-AAAGGTATTGGTGGGATTAGG
Three-GAGATTTAGGTGAAAGAA
Four-TTTGTAATTTTAGTATTTTGGGAGGT
CGI: CpG Island; Int1: Intron 1; BH: Biotinylated and HPLC-purified
Statistical analyses
All statistical tests were performed using GraphPad Prism 6 software (Graphpad Software, Inc.), and included Student's t-test or one-way ANOVA with Dunnett post-test when making multiple comparisons.
Results
TET1-deficient cells display selective growth advantage following exposure to ionizing radiation
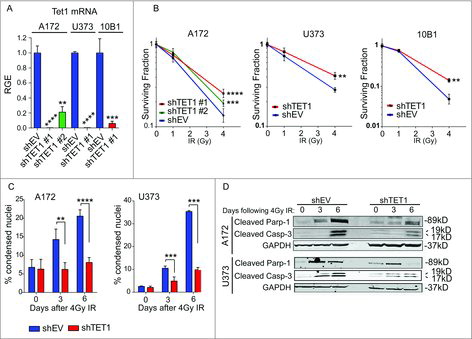
We recently showed that TET1 plays a protective role in response to reactive oxygen species via 5hmC-mediated demethylation of stress-response genes.Citation11 To further explore the cytoprotective role of TET1, we measured the effect of TET1 deficiency on responses to DNA damaging agents. TET1-deficient cell lines were established with lentiviral particles encoding shRNA hairpins against TET1 and controls were established in a similar fashion, but with constructs lacking the Tet1 shRNA sequence. TET1-deficient glioblastoma cell lines A172 and U373 as well as the non-tumor-derived 10B1 line formed significantly more colonies than control cells following 4Gy IR (). We hypothesized that the increase in clonogenic survival observed in TET1-deficient cells reflected the loss of regulatory pathways involved in the DDR. Because the clonogenic assay results could be due to changes in senescence, necrosis, or programmed cell death, subsequent experiments were designed to discriminate between these outcomes over the course of the clonogenic assay. To this end, markers of apoptosis were measured in the cell lines treated with 4Gy IR. TET1-deficient A172 and U373 cell lines displayed fewer condensed nuclei at 3 and 6 d after IR treatment compared with control cells (). Additionally, robust caspase-3 and PARP-1 cleavage were observed in control cells 3 and 6 d after IR, yet these markers of apoptosis were markedly decreased in TET1-deficient cells (). Taken together, these results show TET1 expression is required for an efficient apoptotic response to IR. We next investigated how TET1 affects responses to DNA damage upstream of cell death.
Figure 1. TET1-deficient cells display selective growth advantage following exposure to ionizing radiation. (A) qRT-PCR was conducted to measure TET1 knockdown following transduction with lentivirus encoding empty vector (shEV) or 1 of 2 shRNA constructs targeting TET1 (shTET1 #1 and #2) in A172 and U373 glioblastoma cells and non-tumor-derived 10B1 glial cells. TET1 mRNA levels are relative to GAPDH and normalized to shEV control (RGE, Relative Gene Expression). Asterisks indicate significance by Student's t-test and error bars represent the standard error of the mean (SEM). We performed 3 technical replicates and 3 biologic replicates.**P < 0.01, ***P < 0.001, ****P < 0.0001. (B) Colony formation was measured in control or TET1-deficient cells following 0, 1, or 4 Gy IR. Results are expressed as average of 3 independent experiments, and statistical significance was determined by Student's t-test. Error bars represent SEM. **P < 0.01, ***P < 0.001, ****P < 0.0001. (C) Quantification of condensed nuclei in A172 and U373 glioblastoma cells with control or TET1 knockdown is shown to the right from 3 independent experiments; significance was determined by Student's t-test and error bars are SEM. **P < 0.01, ***P < 0.001, ****P < 0.0001. (D) Representative Western blot images of apoptotic markers following 4 Gy IR in control or TET1-deficient A172 and U373 cells at 0, 3, and 6 d. GAPDH was used as a loading control. Two independent experiments were conducted.
TET1-deficiency diminishes cell cycle arrest and attenuates γH2A.x formation in response to ionizing radiation
A key step in the DDR involves cell-cycle checkpoint activation, which enables cells to asses DNA integrity and undergo DNA repair or apoptosis if repair is not sufficient.Citation18 To test the involvement of TET1 in cell cycle kinetics, control and TET1-deficient A172 cells were treated with 4Gy IR and cell cycle progression was measured by flow cytometry. At 20 and 30 h after IR, an increase was observed in the percentage of TET1-deficient and control cells accumulating in G2/M. The percent increase was greater in control cells than in TET1-deficient cells. The blunted G2/M accumulation displayed by TET1-deficient A172 cells was transient, however, returning to levels that were not statistically significant compared with unirradiated cells by 48 h (). No change in the sub-G0 fraction was observed in control or TET1-deficient cells at this time (data not shown), suggesting that viability was not affected.
Figure 2. TET1-deficiency diminishes cell cycle arrest and attenuates γH2A.x formation in response to ionizing radiation. (A) Cell cycle analysis of control and TET1-deficient A172 cells. DNA content was measured using flow cytometry and average number of cells in each phase are shown 0, 1, 3, 20, 30, and 48 h following 4Gy IR; 3 independent experiments were conducted and error bars are SEM. Asterisks in G2/M plot denote significance compared with the 0 h untreated control using one-way ANOVA and the Dunnett post-test (*P < 0.05, **P < 0.01, ***P < 0.001, ****P < 0.0001, # P>0.05). Samples in (A) were split, and cyclin B1 levels were measured by Western blotting (B); GAPDH was used as loading control and 2 independent experiments were conducted. (C) Cyclin B1 levels following transfection with overexpression vectors encoding control (β-gal), human TET1 catalytic domain (TET1-cd), or FLAG-tagged mouse TET1 catalytic domain (FLAG-TET1-cd) 48 h following 0 or 4 Gy IR was assessed by Western blotting; 2 independent experiments were conducted. (D) Western blot showing levels of γH2A.x, total H2A.x, and GAPDH in control and TET1-deficient A172 cells 0, 1, 4, and 24 h following 4 Gy IR. (E) Western blot showing FLAG-TET1-cd, γH2A.x, and GAPDH in TET1-deficient A172 cells 4 h following 0 or 4 Gy IR. (F) Immunodotblotting of 5hmC in genomic DNA from HEK293 cells overexpressing β-gal, TET1-cd, or FLAG-TET1-cd.
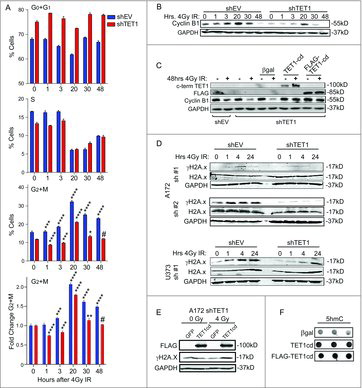
Cyclin B1 is necessary for progression into mitosis, and its levels have been shown to increase transiently in response to IR in numerous cell types, tracking with increases in late-S and G2 phases of the cell cycle.Citation19 Consistent with our DNA content analysis, Cyclin B1 levels, which peak in G2 and very early in mitosis, were much higher as A172 cells accumulated in G2/M and remained detectable through 48 h following IR. In contrast to control cells, TET1-deficient cells showed a transient increase in Cyclin B1, which was not detected at 48 h following IR (). Densitometry of cyclin B1 levels relative to unexposed cells revealed increased Cyclin B1 in both shEV and shTET1 beginning at 20 h following IR exposure. However, Cyclin B1 levels were not statistically significantly higher than unexposed cells by 30 h and were lower than unexposed cells by 48 h, while shEV cells displayed significantly higher Cyclin B1 at 30 h following IR exposure, suggesting a longer delay (shEV: 20 h = 2.60-fold ± 0.36, 30 h = 1.88 ± 0.10, 48 h = 0.16 ± 0.02; shTET1: 20 h = 5.29 ± 0.36, 30 h = 0.84 ± 0.01, 48 h = 0.01 ± 0.001)
To confirm the defects observed in Cyclin B1 induction were dependent on TET1, TET1-deficient A172 cells were transfected with plasmids encoding the human TET1 catalytic domain (TET1-cd) or mouse FLAG-tagged catalytic domains (Flag-TET1-cd), and subjected to IR treatment. To control transfection, cells were transfected with a β-Gal expression vector. Both TET1 catalytic domains, but not β-Gal, were able to rescue Cyclin B1 levels 48 h following 4Gy IR (), indicating that the TET1 catalytic domain is required for accumulation of Cyclin B1 in response to IR and strongly suggests the involvement of TET1 in cell cycle changes in response to DNA damaging agents.
The lack of sustained G2/M accumulation in TET1-deficient cells () suggests a defect in sensing DNA damage induced by IR. Serine-139 phosphorylation of histone variant H2A.x is a well-characterized marker of DNA double strand break recognition and shown to be an early marker of DNA repair.Citation17 As expected, γH2A.x accumulated in control A172 cells and U373 glioma cells exposed to 4Gy IR, yet the TET1-deficient glioma cell lines displayed an attenuated response, as measured by Western blot analysis (). Additionally, re-expressing the catalytic domain of human TET1 rescued γH2A.x levels in TET1 A172-deficient cells following 4Gy IR ().
TET1 promotes H2A.x phosphorylation in non-tumorigenic cells
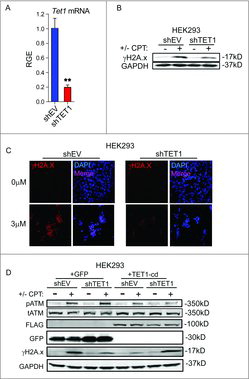
A striking loss of H2A.x phosphorylation was observed in non-tumor-derived HEK293 cells deficient in TET1 following exposure to the topoisomerase-1 poison camptothecin (), suggesting the TET1-mediated response to DNA damage is not restricted to glioma cells or IR-induced DNA damage. To confirm a role for TET1 in the promotion of γH2A.x foci formation following DNA damage, TET1-deficient HEK293 cells transfected with constructs encoding the TET1 catalytic domain or a control plasmid were treated with 3 µM camptothecin and Western blots were conducted to probe for γH2A.x levels. As expected, TET1-deficient cells formed very little detectable γH2A.x. However, γH2A.x levels were restored in TET1-deficient cells in response to camptothecin treatment by overexpressing the TET1 catalytic domain (). Interestingly, activation of ATM by phosphorylation of serine 1981 was unaffected by TET1 knockdown, suggesting both control and TET1-deficient cells are sensing camptothecin-induced damage ().
Figure 3. TET1 promotes H2A.x phosphorylation in non-tumorigenic cells. (A) qRT-PCR was conducted to measure TET1 knockdown following transduction with lentivirus encoding empty vector (shEV) or shRNA construct targeting TET1 in HEK293 cells. TET1 mRNA levels are relative to GAPDH and normalized to shEV control. Asterisks indicate significance by Student's t-test and error bars are SEM. We performed 3 technical replicates and 3 biologic replicates. P = 0.0046. (B) Western blotting of γH2A.x levels in HEK293 cells following 18 h of 3 µM camptothecin or vehicle exposure. GAPDH levels were used as loading control and blots are representative of 3 independent experiments. (C) Immunofluorescent staining of γH2A.x foci in HEK293 cells treated with 3 µM camptothecin or vehicle for 18 h. DAPI (blue) and γH2A.x (red) are shown at 40x magnification and images shown are representative of 3 independent experiments. (D) Western blotting of γH2A.x levels in control or TET1-deficient HEK293 cells. Cells were exposed to 3 µM camptothecin or vehicle for 18 h following transfection with control or TET1 catalytic domain (TET1-cd) expression vectors. FLAG was used to validate overexpression of FLAG-tagged TET1-cd and total H2A.x levels and GAPDH levels are shown as loading controls. Blot shown is representative of 2 independent experiments.
TET1 loss leads to increased DNA strand breakage and decreased expression of DNA repair genes
The attenuated γH2A.x response suggests that TET1-deficient cells sustain greater levels of DNA damage. To directly measure single and double strand DNA breaks, TUNEL and neutral comet assays were conducted. Both assays revealed a greater number of DNA strand breaks in TET1-deficient glioma cells compared with control cells even in the absence of IR ().
Figure 4. TET1 loss leads to increased strand breakage and decreased expression of DNA repair genes. (A) Quantification of TUNEL labeling in A172 control and TET1-deficient cells. Positive nuclei were detected by flow cytometry and reported as average positive cells out of total cell number in 3 independent experiments; significance determined by Student's t-test and error bars are SEM (P < 0.001). (B) Quantification of DNA DSBs expressed as average comet tail moments in control and TET1-deficient A172 nucleoids using the neutral comet assay; significance determined by Student's t-test and error bars are SEM (P < 0.0001). Representative comet images from 4 independent experiments are shown to the right. Fifty or more nucleoids were measured per group in each experiment. (C-E) Western blots of total ATM, RAD50, phospho- and total-Mre11, phosphor- and total-p95 (Nibrin), and GAPDH levels in HEK293 (C), A172 (D), and U373 (E) control and TET1-deficient cells; 3 independent experiments were conducted. (F) Western blotting of total ATM (tATM) and S1981 phosphorylated ATM (pATM) in A172 cells 0 and 4 h following 4Gy ionizing radiation. GAPDH was used as loading control and results are representative of 3 independent experiments. (G) Western blotting of DNA-PKcs levels in A172 and 10B1 cells. GAPDH was used as loading control; 3 independent experiments were conducted. (H) Immunofluorescent staining of γH2A.x following 2 h pretreatment of DMSO or DNA-PK inhibitor NU7026 (10 µM) 4 h after 0 or 4Gy IR in A172 cells. (I) Western blot showing total and cleaved caspase-3 and actin in control and TET1-deficient A172 cells. Cells were pretreated for 2 h with DMSO or ATM inhibitor KU55933 (10 µM) and 0 or 4 Gy IR and harvested 4 h following IR.
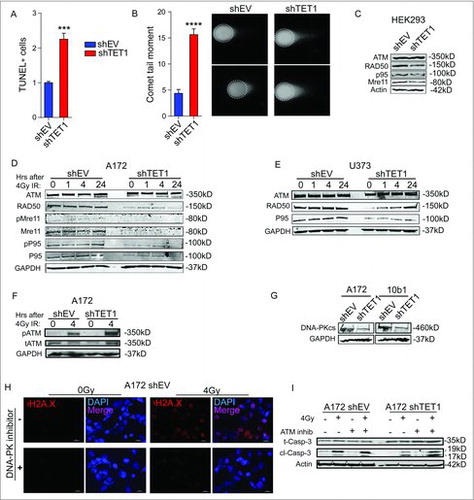
IR inflicts damage to numerous targets in cells, though DNA double strand breaks (DSBs) are thought to be the most lethal. The MRN complex, consisting of Mre11, Rad50, and p95 (Nbs1), plays a critical role in initial signaling and processing of DSBs before repair by homologous recombination or non-homologous end joining. To determine if TET1 is involved in regulating the DNA repair pathway, we measured the MRN complex members. Western blot analysis revealed that TET1-deficient cells have lower levels of MRN complex members compared with control cells both before and following exposure to IR. Similar results were observed in A172, U373, and HEK293 cells (). ATM and DNA-PK are key upstream protein kinases involved in sensing and initiating DNA repair and downstream responses to DSB.Citation14 While TET1 deficiency did not affect levels () or phosphorylation () of ATM, a robust decrease in the DNA-PK catalytic subunit DNA-PKcs was observed (), suggesting that DNA-PK activity is required to sense DNA damage and phosphorylate H2A.x. Similarly, pre-treating control A172 cells with the specific DNA-PK inhibitor NU7026 (10 µM) before IR prevented formation of γH2A.x foci, recapitulating the effects observed in TET1-deficient cells (). Because DNA-PK and ATM have overlapping roles in the DDR, we hypothesized that TET1-deficient cells have a greater dependence on ATM in responses to DNA damaging agents. To test this idea, the effect of the specific ATM inhibitor KU55933 (10 µM) was examined on the induction of cleaved caspase 3 in A172 cells. Cleaved caspase 3 levels increased robustly 6 d following IR in control cells, but were lower in TET1-deficient cells following 4Gy IR (). ATM inhibition had little effect on control cells, but enhanced cleaved caspase 3 levels in TET1-deficient cells following IR, suggesting that low DNA-PKcs expression renders these cells more dependent on ATM in the response to DNA damage.
PRKDC expression is dependent on TET1
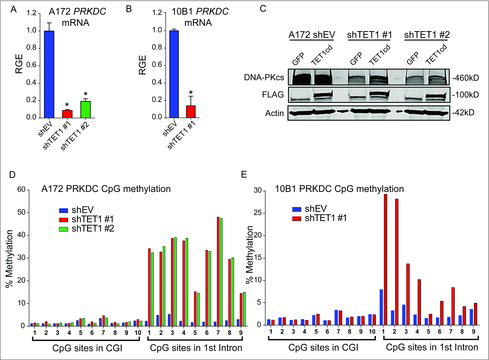
TET proteins catalyze the hydroxylation of 5mC to 5hmC in mammalian DNA.Citation7-9 5hmC is found in relatively high levels at enhancers, promoters, and gene bodies of actively transcribed genes, and can be converted to unmodified cytosine, suggesting that TET1 plays a functional role in transcriptional regulation.Citation9,Citation10 To determine if TET1 regulates DNA-PKcs, PRKDC mRNA levels were measured in A172 and 10B1 control and TET1 knockdown cells. PRKDC levels were significantly decreased in both TET1-deficient cell lines, suggesting that TET1 affects DNA-PKcs expression through an epigenetic mechanism (). Reintroducing the catalytic domain of human TET1, but not GFP, rescued DNA-PKcs levels in TET1-deficient A172 cells (). Furthermore, while knockdown of TET1 using 2 distinct shRNA constructs in A172 cells had no effect on CpG island methylation, a robust increase in methylation in each of 9 CpGs in intron 1 of PRKDC was observed (). Similar results were observed in 10B1 cells depleted of TET1 (). Taken together, these results indicate TET1 controls PRKDC expression through CpG demethylation.
Figure 5. PRKDC expression is dependent on TET1 activity. qRT-PCR showing PRKDC mRNA levels in control and TET1-deficient A172 (A) or 10B1 (B) cells relative to GAPDH; 3 independent experiments included 3 technical replicates each. Statistical significance was determined by Student's t-test and error bars are SEM. (C) Western blotting of DNA-PKcs levels in control or TET1-deficient A172 cells following transfection with GFP, active FLAG-TET1-cd, or inactive FLAG-TET1-cd (mut). Actin was used as a loading control and blot shown is representative of 3 independent experiments. (D-E) Bisulfite-pyrosequencing results of 10 CpGs within the promoter CpG island and 9 CpGs within intron 1 of PRKDC in control or TET1-deficient A172 (D) and 10B1 (E) cells. Results shown are percent methylation at each CpG. Results are representative of 2 independent experiments.
Discussion
The 3 major outcomes in the DDR—cell cycle regulation, apoptosis, and DNA repair—provide cells with the opportunity to repair DNA lesions or to undergo apoptosis if DNA repair fails. The failure to undergo the DDR would increase the risk that cells may undergo neoplastic transformation. Each pathway in the DDR involves the coordination of numerous molecular pathways initiated by key DNA damage sensors. It has been long appreciated that gene-specific and global DNA methylation levels correlate with genome stability,Citation5 yet it is unclear how the molecular components of methylation and demethylation machinery are involved. Several studies in different organ systems have provided evidence showing greater tumorigenic potential following loss of TET levels.Citation15,Citation16 In this manuscript, we show that TET1 deficiency impairs cell cycle checkpoints, apoptosis, and DNA repair, following acute DNA damage.
Cell cycle checkpoints are critical for allowing cells sufficient time to repair DNA. After exposure to IR, cells typically accumulate G2/M. In our study, control cells accumulated in G2/M as expected and displayed high levels of cyclin B1 following exposure to IR. In contrast, TET1-deficient cells failed to accumulate in G2/M and displayed much lower accumulation of cyclin B1 with a return to low levels as cells exited mitosis. Following IR treatment, TET1-deficient cells also displayed fewer condensed nuclei, a feature consistent with apoptosis, and this was confirmed by the observation of lower levels of apoptotic markers as well as the survival of TET1-deficient cells as measured by colony formation. Several studies have demonstrated a relationship between TET1 expression and DNA damage in addition to a likely involvement of Tet1 in tumorigenesis. Loss of Tet1 promoted mouse B cell lymphomagenesis in the context of overexpression of the proto-oncogene Bcl2,Citation14 and loss of both TET1 and TET2 led to the development of myeloid malignancy in mouse models.Citation15 Both studies also showed increased DNA damage in these cells following loss of TET enzyme expression. In glioblastomas and lung cancer, the loss of TET1 decreases expression of tumor suppressor genes, which is reversed by ectopic expression of TET1 resulting in inhibition of lung tumor and glioblastoma growth.Citation14
In addition to the apoptotic and cell cycle responses, DNA repair was also compromised. TET1 deficient cells harbored significantly more DNA strand breaks even in the absence of exogenous DNA damaging agents. The formation of γH2A.x foci, both a marker of DNA damage and an active participant in DNA repair, was greatly diminished following IR. DNA repair, apoptosis, and cell cycle check points are initiated by the activation of both DNA-PK and ATM. One possible explanation for the dampened DDR in TET1-deficient cells involves lower levels of DNA-PKcs, which correlated with higher levels of CpG methylation in the first intron of PRKDC, the gene encoding DNA-PKcs, not methylation at the CpG island. While CpG methylation has been most frequently correlated with transcriptional silencing in the context of promoter CpG islands, intronic CpG methylation has also been shown to be involved in gene silencing.Citation20-22 TET1 appears to protect the intron from undergoing methylation. Indeed, recent studies examining fibroblasts from Tet1/Tet2 knockouts revealed an overall regulatory role of Tet-dependent DNA demethylation for maintaining the integrity of the methylome.Citation23
Several studies have shown that specific loss of DNA-PK activity results in remarkable radiosensitivity, and therefore inhibition of DNA-PK activity through small molecule inhibitors or shRNA-mediated knockdown of DNA-PKcs has become an attractive investigational approach to radiosensitizing tumor cells.Citation24 In contrast to these findings, our study demonstrates TET1 deficiency confers radioresistance despite a loss of DNA-PKcs. Many of these studies on DNA-PK, however, do not examine ATM even though both kinases initiate the DDR. We found that the TET1 deficiency led to loss of DNA-PKcs and rendered cells more reliant on ATM. TET1 deficient cells became apoptotic in response to IR only when pre-treated with an ATM inhibitor. A recent study in 3 cancer cell lines revealed that inhibition of DNA-PKcs function leads to hyperactivation of ATM and amplification of the p53 response.Citation25 The idea that TET1 resides in a DNA repair axis involving ATM and DNA-PK is supported in study of ATM knockout mice and subsequent TET1 loss, where TET1 is identified as an ATM target protein.Citation26 While our study found that loss of TET1 resulted in diminished cleaved caspse-3 following DNA damage, which could be rescued by inhibiting ATM, Jiang et al. demonstrated that TET1 loss in neuronal cells promoted caspase-3 cleavage. While both studies identify TET1 in the response to DNA damage, it is possible that our results differ in the models used. Jiang et al. used a murine model and reported findings in cerebellar Purkinje cells, while our study involves human glial cells, suggesting potential differences in the roles of TET1 in various species and cell types.
In understanding the effects of TET1 deficiency, it is also important to consider that TET1 is acting upstream of a network of genes that are involved in deciding the fate of cells following DNA damage, such as the MRN complex and genes regulating the cell cycle and apoptosis. Similar to the changes in methylation at the PRKDC intron, repression of tumor suppressor genes might be occurring due to invasive methylation at regulatory elements in TET1-deficient cells. Still, an additional possibility is that the effects of TET1 deficiency are essentially linked to DNA-PKcs expression, yet the mechanism is only partly related to the DDR. Recent work has highlighted the role of DNA-PK as a member of transcriptional complexes important for efficient transcription.Citation27-29 It is therefore possible that TET1 has direct effects on CpG methylation as well as indirect influence over gene transcription through DNA-PK activity.
Our data suggest a scenario wherein cells expressing low levels of TET1 accumulate DNA breaks, bypass cell cycle checkpoints, and resist apoptosis. The seeming contradiction that TET1-deficient cells have altered DNA repair capacity, yet simultaneously resist apoptosis, should be the focus of future work. Elucidating the repair mechanisms TET1-deficient cells use to withstand endogenous and exogenous DNA damage may reveal novel targets for therapy. We also propose that the loss of TET1 is an early step during tumorigenic transformation, permitting the selection of cells with oncogenic rearrangements and mutations. Unlike TET2, loss of TET1 activity would likely not be due to mutations. Rather, environmental conditions that modify TET1 activity such as hypoxia,Citation30 redox potential,Citation11 and ascorbic acid levels Citation31,Citation32 could be risk factors for developing gliomas.
Disclosure of potential conflicts of interest
No potential conflicts of interest were disclosed.
Supplementary_materials.pdf
Download PDF (100.8 KB)Additional information
Funding
Related Research Data
References
- Li E, Beard C, Jaenisch R. Role for DNA methylation in genomic imprinting. Nature. 1993;366:362-5. doi:10.1038/366362a0. PMID:8247133.
- Illingworth R, Kerr A, Desousa D, Jørgensen H, Ellis P, Stalker J, Jackson D, Clee C, Plumb R, Rogers J, et al. A novel CpG island set identifies tissue-specific methylation at developmental gene loci. PLoS Biol. 2008;6:e22. doi:10.1371/journal.pbio.0060022. PMID:18232738.
- Humphries C, Kohli MA, Whitehead P, Mash DC, Pericak-Vance MA, Gilbert J. Alzheimer disease (AD) specific transcription, DNA methylation and splicing in twenty AD associated loci. Mol Cell Neurosci. 2015;67:37-45. doi:10.1016/j.mcn.2015.05.003. PMID:26004081.
- Esteller M, Herman JG. Cancer as an epigenetic disease: DNA methylation and chromatin alterations in human tumours. J Pathol. 2002;196:1-7. doi:10.1002/path.1024. PMID:11748635.
- Baylin SB. DNA methylation and gene silencing in cancer. Nat Clin Pract Oncol. 2005;2 Suppl 1:S4-11. doi:10.1038/ncponc0354. PMID:16341240.
- Yang Q, Nakamura M, Nakamura Y, Yoshimura G, Suzuma T, Umemura T, Shimizu Y, Mori I, Sakurai T, Kakudo K. Two-hit inactivation of FHIT by loss of heterozygosity and hypermethylation in breast cancer. Clin Cancer Res. 2002;8:2890-3. PMID:12231533.
- Tahiliani M, Koh KP, Shen Y, Pastor WA, Bandukwala H, Brudno Y, Agarwal S, Iyer LM, Liu DR, Aravind L, et al. Conversion of 5-methylcytosine to 5-hydroxymethylcytosine in mammalian DNA by MLL partner TET1. Science. 2009;324:930-5. doi:10.1126/science.1170116. PMID:19372391.
- Ito S, D'Alessio AC, Taranova OV, Hong K, Sowers LC, Zhang Y. Role of Tet proteins in 5mC to 5hmC conversion, ES-cell self-renewal and inner cell mass specification. Nature. 2010;466:1129-33. doi:10.1038/nature09303. PMID:20639862.
- Guo JU, Su Y, Zhong C, Ming GL, Song H. Hydroxylation of 5-methylcytosine by TET1 promotes active DNA demethylation in the adult brain. Cell. 2011;145:423-34. doi:10.1016/j.cell.2011.03.022. PMID:21496894.
- He YF, Li BZ, Li Z, Liu P, Wang Y, Tang Q. Tet-mediated formation of 5-carboxylcytosine and its excision by TDG in mammalian DNA. Science. 2011;333:1303-7. doi:10.1126/science.1210944. PMID:21817016.
- Coulter JB, O'Driscoll CM, Bressler JP. Hydroquinone increases 5-hydroxymethylcytosine formation through ten eleven translocation 1 (TET1) 5-methylcytosine dioxygenase. J Biol Chem. 2013;288:28792-800. doi:10.1074/jbc.M113.491365. PMID:23940045.
- Zhao B, Yang Y, Wang X, Chong Z, Yin R, Song SH, Zhao C, Li C, Huang H, Sun BF, et al. Redox-active quinones induces genome-wide DNA methylation changes by an iron-mediated and Tet-dependent mechanism. Nucleic Acids Res. 2014;42:1593-605. doi:10.1093/nar/gkt1090. PMID:24214992.
- Sanchez-Guerra M, Zheng Y, Osorio-Yanez C, Zhong J, Chervona Y, Wang S, Chang D, McCracken JP, Díaz A, Bertazzi PA, et al. Effects of particulate matter exposure on blood 5-hydroxymethylation: Results from the Beijing truck driver air pollution study. Epigenetics. 2015;10:633-42. doi:10.1080/15592294.2015.1050174. PMID:25970091.
- Forloni M, Gupta R, Nagarajan A, Sun LS, Dong Y, Pirazzoli V, Toki M, Wurtz A, Melnick MA, Kobayashi S, et al. Oncogenic EGFR represses the TET1 DNA demethylase to induce silencing of tumor suppressors in cancer cells. Cell Rep. 2016;16(2):457-71. doi:10.1016/j.celrep.2016.05.087. PMID:27346347.
- Cimmino L, Dawlaty MM, Ndiaye-Lobry D, Yap YS, Bakogianni S, Yu Y, Bhattacharyya S, Shaknovich R, Geng H, Lobry C, et al. TET1 is a tumor suppressor of hematopoietic malignancy. Nat Immunol. 2015;16:653-62. doi:10.1038/ni.3148. PMID:25867473.
- An J, González-Avalos E, Chawla A, Jeong M, López-Moyado IF, Li W, Goodell MA, Chavez L, Ko M, Rao A. Acute loss of TET function results in aggressive myeloid cancer in mice. Nat Comm. 2015;6:1-14. doi:10.1038/ncomms10071. PMID:26607761.
- Orr BA, Haffner MC, Nelson WG, Yegnasubramanian S, Eberhart CG. Decreased 5-hydroxymethylcytosine is associated with neural progenitor phenotype in normal brain and shorter survival in malignant glioma. PLoS One. 2012;7:e41036. doi:10.1371/journal.pone.0041036. PMID:22829908.
- Bonner WM, Redon CE, Dickey JS, Nakamura AJ, Sedelnikova OA, Solier S, Pommier Y. Gamma H2AX and cancer. Nat Rev Cancer. 2008;8:957-67. doi:10.1038/nrc2523. PMID:19005492.
- Cariveaua MJ, Kalmus GW, Johnke RM, Allison RR, Evans M, Holbert D. Correlations between radiation-induced double strand breaks and cell cycle checkpoints in X-irradiated NIH/3T3 fibroblasts. Anticancer Res. 2006;26:3311-6. PMID:17094446.
- Wutz A, Smrzka OW, Schweifer N, Schellander K, Wagner EF, Barlow DP. Imprinted expression of the Igf2r gene depends on an intronic CpG island. Nature. 1997;389:745-9. doi:10.1038/39631. PMID:9338788.
- Klengel T, Mehta D, Anacker C, Rex-Haffner M, Pruessner JC, Pariante CM, Pace TW, Mercer KB, Mayberg HS, Bradley B, et al. Allele-specific FKBP5 DNA demethylation mediates gene–childhood trauma interactions. Nat Neurosci. 2013;16(1):33-41. doi:10.1038/nn.3275. PMID:23201972.
- Zhang X, Wu M, Xiao H, Lee MT, Levin L, Leung YK, Ho SM. Methylation of a single intronic CpG mediates expression silencing of the PMP24 gene in prostate cancer. Prostate. 2011;70(7):765-76. doi:10.1002/pros.21109. PMID:20054818.
- Wiehle L, Raddatz G, Musch T, Dawlaty M Jaenisch R, Lyko F, Breilinga A. Tet1 and Tet2 protect DNA methylation canyons against hypermethylation. Mol Cell Biol. 2015;37(2):452-61. doi:10.1128/MCB.00587-15. PMID:26598602.
- Collis SJ, Swartz MJ, Nelson WG, DeWeese TL. Enhanced radiation and chemotherapy-mediated cell killing of human cancer cells by small inhibitory RNA silencing of DNA repair factors. Cancer Res. 2003;63(7):1550-4. PMID:12670903.
- Finzel A, Grybowski A, Strasen J, Cristiano E, Loewer A. Hyperactivation of ATM upon DNA-PKcs inhibition modulates p53 dynamics and cell fate in response to DNA damage. Mol Biol Cell. 2016;27(15):2360-7. doi:10.1091/mbc.E16-01-0032. PMID:27280387.
- Jiang D, Zhang Y, Hart RP, Chen J, Herrup K, Li J. Alteration in 5-hydroxymethylcytosine-mediated epigenetic regulation leads to Purkinje cell vulnerability in ATM deficiency. Brain. 2015;138:3520-36. doi:10.1093/brain/awv284. PMID:26510954.
- Haffner MC, De Marzo AM, Meeker AK, Nelson WG, Yegnasubramanian S. Transcription-induced DNA double strand breaks: both oncogenic force and potential therapeutic target? Clin Cancer Res. 2011;17(12):3858-64. doi:10.1158/1078-0432.CCR-10-2044. PMID:21385925.
- Dvir A, Peterson SR, Knuth MW, Lu H, Dynan WS. Ku autoantigen is the regulatory component of a template-associated protein kinase that phosphorylates RNA polymerase II. Proc Natl Acad Sci U S A. 1992;89(24):11920-4. doi:10.1073/pnas.89.24.11920. PMID:1465419.
- Goodwin JF, Knudsen KE. Beyond DNA repair: DNA-PK function in cancer. Cancer Discov. 2014;4(10):1126-39. doi:10.1158/2159-8290.CD-14-0358. PMID:25168287.
- Mariani CJ, Vasanthakumar A, Madzo J, Yesilkanal A, Bhagat T, Yu Y, Bhattacharyya S, Wenger RH, Cohn SL, Nanduri J, et al. TET1-mediated hydroxymethylation facilitates hypoxic gene induction in neuroblastoma. Cell Rep. 2014;7(5):1343-52. doi:10.1016/j.celrep.2014.04.040. PMID:24835990.
- Minor EA, Court BL, Young JI, Wang G. Ascorbate induces ten-eleven translocation (Tet) methylcytosine dioxygenase-mediated generation of 5-hydroxymethylcytosine. J Biol Chem. 2013;288(19):13669-74. doi:10.1074/jbc.C113.464800. PMID:23548903.
- Blaschke K, Ebata KT, Karimi MM, Zepeda-Martínez JA, Goyal P, Mahapatra S, Tam A, Laird DJ, Hirst M, Rao A, et al. Vitamin C induces Tet-dependent DNA demethylation and a blastocyst-like state in ES cells. Nature. 2013;500(7461):222-6. doi:10.1038/nature12362. PMID:23812591.
- Lopez H, Zhang L, George NM, Liu X, Pang X, Evans JJ, Targy NM, Luo X. Perturbation of the Bcl-2 network and an induced Noxa/Bcl-xL interaction trigger mitochondrial dysfunction after DNA damage. J Biol Chem. 2010;285:15016-26. doi:10.1074/jbc.M109.086231. PMID:20223826.