
 ?Mathematical formulae have been encoded as MathML and are displayed in this HTML version using MathJax in order to improve their display. Uncheck the box to turn MathJax off. This feature requires Javascript. Click on a formula to zoom.
ABSTRACT
Intrauterine exposure to hyperglycemia is reported to confer increased metabolic risk in later life, supporting the ‘developmental origins of health and disease’ hypothesis. Epigenetic alterations are suggested as one of the possible underlying mechanisms. In this study, we compared pairwise DNA methylation differences between siblings whose intrauterine exposure to maternal gestational diabetes (GDM) were discordant. Methylation of peripheral blood DNA of 18 sibling pairs was measured using Infinium HumanMethylation450 BeadChip assays. Of the 465,447 CpG sites analyzed, 12 showed differential methylation (false discovery rate <0.15), including markers within genes associated with monogenic diabetes (HNF4A) or obesity (RREB1). The overall methylation at HNF4A showed inverse correlations with mRNA expression levels, though non significant. In a gene set enrichment analysis, metabolism and signal transduction pathways were enriched. In conclusion, we found DNA methylation markers associated with intrauterine exposure to maternal GDM, including those within genes previously implicated in diabetes or obesity.
Abbreviations
| CTNND2 | = | Catenin delta 2 |
| GDM | = | Gestational diabetes mellitus |
| HM450K | = | Illumina Infinium HumanMethylation450 BeadChip assays |
| HNF4A | = | Hepatocyte nuclear factor 4 α |
| RREB1 | = | Ras responsive element binding protein 1 |
Introduction
Hyperglycemia during pregnancy is associated with increased risk of obesity and type 2 diabetes (T2D) in the offspring.Citation1,Citation2 It has been reported that offspring born to mothers with gestational diabetes mellitus (GDM) have 8-fold increased risk of T2D compared with general population at early adulthood.Citation3 This could be due to shared genetic risk factors between GDM mothers and their offspring. Recent advances in genetic association studies have improved our understanding on genetics of T2D, with identification of at least 80 susceptibility loci.Citation4 However, these common genetic variants explain only a limited proportion of the T2D heritability.Citation5 This implies that environmental factors including early-life exposures may also contribute to the pathogenesis of T2D in later life, as suggested by the hypothesis of ‘developmental origins of health and disease’.Citation6−8
Intrauterine hyperglycemia is suggested as one of the environmental factors that confer life-long increased risk of metabolic diseases. It has been reported that in Pima Indians, offspring conceived after the mother developed T2D had increased risk of obesity and T2D compared with the sibling born before their mother was diagnosed with T2D.Citation9 The detailed mechanism by which intrauterine hyperglycemia affects later life adverse metabolic outcomes is not fully understood. One of the possible mechanisms is that intrauterine hyperglycemia might induce changes in DNA methylation.Citation10 During this period, rapid cell division and dynamic DNA methylation ensue and it is vulnerable to adverse environmental factors. Epigenetic alterations in response to early-life exposures could affect a wide range of tissues and maintained through cellular memory during subsequent cell divisions.Citation11,Citation12 In addition, recent studies showed that DNA methylation in peripheral blood leukocytes can represent DNA methylation of metabolically relevant tissues, such as liver, adipose tissue, and pancreas.Citation13,Citation14
There have been several reports on differential DNA methylation associated with maternal hyperglycemia in placental tissues or cord blood samples of offspring.Citation15−18 However, the sample size was small and the findings were not confirmatory. Other studies investigated DNA methylation in tissues relevant for diabetes, such as skeletal muscle and adipose tissue in adult offspring.Citation19,Citation20 In these studies, transcription level as well as DNA methylation of PPARGC1A, which plays an important role in adipogenesis and metabolic regulation, and adipokines, such as LEP, ADIPOQ, and RET were investigated. Recently, a DNA methylation study using peripheral blood was performed in offspring exposed to T2D during pregnancy.Citation21 Several CpGs in/near LHX3, PRDM16, AK3, PCDHGA4, and STC1 were strongly associated with exposure to maternal T2D. Most of the previous studies used a case-control study design with unrelated offspring exposed to either hyperglycemic or normoglycemic environments in utero. One of the limitations of the previous studies was the potential confounding by different genetic backgrounds. Investigating sibling pairs discordant for exposure to maternal GDM might enable us to elucidate epigenetic change that is specific to intrauterine hyperglycemia without confounding the effect of genetic variation.
In this study, we conducted a discordant sibship study with siblings born to women who had experienced both GDM and non-GDM pregnancies. Using 18 discordant sibling pairs who were in their childhood, we aimed to identify peripheral leukocyte DNA methylation changes associated with exposure to maternal GDM.
Results
Clinical characteristics of study participants
A total of 18 sibling pairs participated in this study. In each sibling pair, one was conceived during GDM pregnancy and the other during non-GDM pregnancy. Clinical characteristics of the study participants are displayed in . The mean ages were 5.8 ± 1.4 and 9.4 ± 2.5 y for offspring from GDM pregnancy and non-GDM pregnancy, respectively (P < 0.0001). Siblings exposed to maternal GDM were younger than the other sibling, except for one sibling pair. There was no significant difference in sex distribution between the 2 groups. Among the 18 sibling pairs, 10 were sex concordant and 8 were sex discordant. There was no significant pairwise difference in BMI Z-scores between the 2 groups (P = 0.594). The mean maternal age at GDM pregnancy was 34.4 years, while the mean age at non-GDM pregnancy was 30.8. All the mothers were never smokers. The glucose values measured during 100 g oral glucose tolerance test (OGTT) are displayed in . Of the 18 mothers, 6 received insulin treatment during GDM pregnancy, and none of the mothers used oral anti-diabetic medications.
Table 1. Characteristics of the study population.
Differentially methylated CpG sites
For differential methylation analyses, a total of 465,447 CpG sites, which were at detection P<0.01, outside of single nucleotide variations, in CpG contexts, and located at autosomal chromosomes, were included. We investigated pairwise DNA methylation differences using M-values for its association with exposure to maternal GDM pregnancy. The volcano plot of the CpG markers is shown in . After adjusting for age, sex, and experimental batch (Model 1), one CpG site, cg04988367, which was located 39 kb downstream of catenin delta 2 (CTNND2) showed significant difference at q < 0.10. Additional 11 CpG sites had pairwise methylation difference that was significant at q < 0.15 (). Among these, cg08407434 (coefficient for log2 fold difference 1.003, P = 7.17 × 10⁻⁷, q = 0.109) was located at intron of hepatocyte nuclear factor 4 α (HNF4A), known as the causative gene for maturity onset diabetes of the young (MODY) type 1 and was the most significant differentially methylated marker after additional adjustment for cell type composition (Model 2). Another CpG marker cg18255813 was located at intron of ras responsive element binding protein 1 (RREB1), which was reported to be associated with visceral fat mass Citation22 and glycemic traits.Citation23
Figure 1. Differential DNA methylation analysis in sibling pairs discordant for intrauterine exposure to maternal GDM. (A) Volcano plot for the differential DNA methylation analysis of the 465,446 CpG sites. The effect size of GDM exposure on DNA methylation levels at each of the CpG sites is shown in x axis and the significance levels are shown in y axis. Coefficients > 0 refer to increased methylation in the GDM group compared with the non-GDM group. (B) Heatmap of adjusted β values for the top 100 differentially methylated CpG sites associated with intrauterine exposure to maternal GDM. The 36 samples (column-wise) and 100 CpG sites (row-wise) associated with intrauterine exposure to GDM were displayed using unsupervised hierarchical clustering. The upper panel and the lower panel represent sibling pairs and group information (black: GDM group; gray: non-GDM group), respectively. Blue to red gradient correspond to increasing methylation. Manhattan distance measures were used to compute inter-sample distances based on DNA methylation levels. S1-S18 denotes sibling IDs and G and N represent the GDM group and the non-GDM group, respectively.
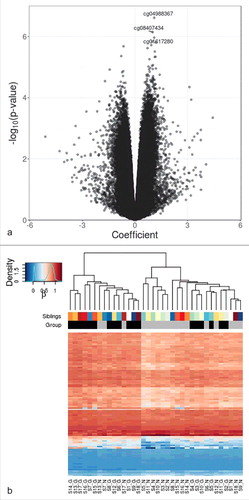
Table 2. Differential DNA methylation in siblings discordant for their exposure to maternal GDM (q < 0.15).
Clustering analysis
We performed unsupervised clustering analysis using top 100 differentially methylated CpG sites after adjustment for covariates (age, sex, and experimental batch). One large cluster mainly consisted of GDM offspring (GDM:non-GDM = 12:3), while another cluster consisted of a larger number of non-GDM offspring (non-GDM:GDM = 15:6) (). Non-GDM offspring that failed to be clustered into the non-GDM-dominant cluster were in the same cluster with their sibling counterparts and the same was true for the GDM offspring that failed to belong to the GDM-dominant cluster. GDM offspring in the non-GDM-dominant cluster were closely clustered with each other.
Gene set enrichment analysis
Gene set enrichment analysis was performed using the ranked list of differentially methylated genes and pre-defined pathway database gene sets from ConsensusPathDB.Citation24 Genes with differentially methylated CpG sites preferentially participated in ‘metabolism’ and ‘signal transduction pathways’. Genes involved in ‘regulation of insulin like growth factor transport and uptake by insulin like growth factor binding proteins’ (enrichment score 0.770, P = 0.0024) were most significantly enriched in the ‘signal transduction pathways’. In addition, genes involved in several pathways including ‘superpathway of conversion of glucose to acetylCoA and entry into the TCA cycle’ (enrichment score 0.711, P = 0.0379) were significantly enriched in ‘metabolism’ pathways ().
Table 3. Gene set enrichment analysis of genes associated with differentially methylated CpG sites.
Overall differential methylation of HNF4A and gene expression
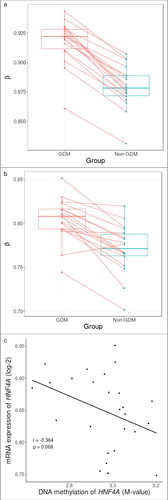
As this study had limited statistical power, we focused on a candidate site that had biologic plausibility. HNF4A, well known as the causative gene for MODY1, plays a crucial role in pancreatic β cell development and differentiation. Therefore, the DNA methylation pattern of HNF4A was further investigated. First, we performed pyrosequencing of cg08407434 and found a significant correlation with the methylation values measured using Illumina Infinium HumanMethylation 450 BeadChip (HM450K; Pearson's coefficient 0.469, P = 0.01) (Supplementary Figure S2.). Second, we compared DNA methylation levels of cg08407434 within each of the sibling pairs using β values that were adjusted for age, sex, and experimental batch. We found that all sibling pairs had increased methylation in the offspring exposed to maternal GDM pregnancy (). Third, the average DNA methylation levels of all CpG markers within the HNF4A region showed a marginal trend of increased DNA methylation in siblings exposed to GDM except for one pair (P = 0.052) (). Finally, there was a negative correlation between overall HNF4A methylation and mRNA expression, albeit statistically insignificant (Pearson's coefficient -0.364, P = 0.068) ().
Figure 2. Within sibling pair comparison of DNA methylation levels at cg08407434 and HNF4A gene and correlation with mRNA expression. (A) Within sibling pair differences in covariate-adjusted β values (GDM – non-GDM) at cg08407434 show consistent increased methylation in siblings exposed to GDM. (B) Within sibling pair differences of covariate-adjusted overall methylation levels of all CpG sites across the HNF4A region also show a marginal trend of increased methylation in siblings exposed to GDM (P = 0.053). (C) Overall DNA methylation level of HNF4A showed a negative correlation with mRNA expression albeit non significant (Pearson's coefficient: -0.364, P = 0.068).
Discussion
In this study, we performed epigenome-wide association analysis in 18 sibling pairs discordant for their exposure to maternal GDM pregnancy. We identified 12 CpG sites from offspring peripheral leukocytes suggested to be associated with exposure to maternal GDM (q < 0.15). These CpG markers include those located at HNF4A and RREB1, which are known for its association with diabetes and obesity, respectively. We found that there were higher methylation levels overall in the HNF4A region in the affected siblings. It showed a negative correlation with its mRNA expression levels, though non significant. Several pathways relevant to metabolic regulation were enriched by genes harboring differentially methylated CpG markers. To the best of our knowledge, this is the first study to investigate discordant sibling pairs to identify DNA methylation markers that are associated with exposure to maternal GDM pregnancy. This unique study design enables us to assess effects of intrauterine hyperglycemia by reducing genetic and environmental confounding effects on DNA methylation.
It has been previously reported that siblings born after the mother developed T2D had significantly elevated risk of developing T2D with odds ratio of 3.7 compared with their sibling born before the mother developed T2D.Citation9 In addition, BMI of siblings born after the mother developed T2D was 2.6 kg/m2 higher.Citation9 However, differences in epigenetic markers between siblings discordant for their exposure to GDM have not been reported previously. Unsupervised hierarchical clustering showed that one large cluster consisted mainly of offspring exposed to GDM. However, some sibling pairs were clustered into the same cluster, not separated according to their exposure status. These findings imply that both sibship and exposure to GDM should be considered together.
There were several characteristics of the study participants that are worthwhile to note. We investigated offspring of GDM, which is usually a milder form of hyperglycemia compared with pregestational diabetes. GDM usually develops in the third trimester and about 20–40% of GDM women require insulin therapy. On the other hand, women with pregestational diabetes have hyperglycemia at the beginning of conception and the degree of hyperglycemia is more severe. It would be of interest to investigate differential DNA methylation as well as phenotypic differences between offspring born to GDM and offspring born to maternal pregestational diabetes. Another point that should be noted is that children rather than adults were investigated for DNA methylation. We were interested in DNA methylation markers that could potentially mediate the effect of intrauterine hyperglycemia on later life metabolic dysregulation. Longitudinal investigation showed that in utero DNA methylation could be altered during childhood and adolescence.Citation25 Whether the difference in DNA methylation identified in our study persists in adulthood needs to be further studied.
There were several CpG markers of potential interest. The most significant differentially methylated CpG site was located within CTNND2, which encodes δ-catenin and is implicated in development of brain and eye. It is overexpressed in cancers and plays a role in disruption of adherence junction and tumorigenesis.Citation26 However, this gene has not been implicated in pathogenesis of diabetes or glucose homeostasis before.
The second most significant differentially methylated CpG site (cg08407434) in Model 1 was located at intron of HNF4A. This gene serves as a transcriptional factor that regulates pancreatic β cell development and differentiation.Citation27 It has been shown in rodents that maternal nutrition and aging can induce epigenetic change in HNF4A and regulate its expression level in offspring islets.Citation10 When monozygotic twins discordant for T2D were investigated, there was increased methylation of HNF4A in adipose tissue of T2D individuals.Citation28 We showed that increased methylation of this marker in siblings exposed to maternal GDM was consistent in all pairs. However, the difference was small, and it is not known whether this small consistent change in DNA methylation can be biologically meaningful. Further replication studies are required to validate this finding. In addition, a follow-up study on how these small yet significant alterations persist through lifetime and affect metabolic health in later life would be of interest.
Another differentially methylated CpG site of potential interest is located within the gene body of RREB1. It encodes a zinc finger transcription factor that binds to RAS-responsive elements. Genetic variants in RREB1 were associated with several metabolic traits including waist-hip-ratio,Citation29 uric acid level,Citation30 and fasting glucose concentrations.Citation23 In addition, a previous report showed that RREB1 plays an important role in transcriptional activation of NeuroD1 target genes, such as insulin and glucokinase, in pancreatic endocrine cells.Citation31 It would be worthwhile to investigate functional consequences of increased methylation of this gene on metabolic traits.
In the gene set enrichment analysis using genes that harbor differentially methylated CpG sites, we identified multiple important pathways relevant to GDM and T2D. The ‘regulation of insulin like growth factor transport and uptake by insulin like growth factor binding proteins’ was the most significantly enriched pathway. Insulin like growth factor axis is important in fetal growth and glucose homeostasis. There are lines of evidence that it also plays an important role in the pathogenesis of diabetes.Citation32 It has been shown that levels of insulin like growth factor and their binding proteins are altered in T2D and obesity.Citation33 In addition, it has been reported that GDM is associated with lower insulin-like growth factor binding proteins in maternal and cord blood.Citation34 The ‘superpathway of conversion of glucose to acetylCoA and entry into the TCA cycle’ is crucial in glucose homeostasis and energy metabolism. Alterations in this pathway may result in T2D and related metabolic abnormalities. Enrichment of this pathway is in accord with the hypothesis that intrauterine exposure to GDM increases risk of metabolic disorders in offspring via epigenetic changes. However, none of the pathways reached multiple testing-corrected significance of FDR <0.25 probably due to small sample size. Pathways with a small gene set are prone to inflated scores and, thus, further analyses and cautious interpretation are warranted.
There are several limitations in this study. First, despite the uniqueness and strengths of the study design, the sample size was small and statistical power was limited. The threshold for statistical significance was relaxed in this study and it might have introduced false positive findings. Therefore, the results should be interpreted with consideration of possible type I errors. As this study had limited statistical power, we focused on candidate regions that had biologic plausibility, such as HNF4A and RREB1. Second, we used peripheral leukocyte samples to assess differential DNA methylation associated with intrauterine exposure status. Early-life exposure can affect DNA methylation in a wide range of tissues that can persist throughout the lifetime while later-life exposure can affect only one or few tissues.Citation11,Citation35−37 This enables DNA methylation of peripheral leukocyte samples to be used as potential markers of intrauterine exposure. There are also reports on consistent DNA methylation changes in leukocytes as a predictor of development of T2D.Citation13 Third, there was a significant difference in offspring ages and their maternal ages at gestation between cases and controls. Most of the participants’ mothers experienced GDM pregnancy after having had a normal pregnancy. This is in accord with the fact that advanced maternal age is a major risk factor for GDM. To take into account the age difference between groups, we included offspring age as a covariate in analyses. According to our further analysis on relationship between age and DNA methylation at top CpG markers, offspring age was significantly correlated with DNA methylation at several markers including cg04988367, cg13911801 and cg09304293 (Supplementary Figure S3). However, this trend tended toward null when the analysis was performed within each group. Meanwhile, for cg08407434 located within HNF4A, there was no significant association with offspring age or maternal age.
In summary, we found several suggestive epigenetic markers, including cg08407434 located at HNF4A, which are associated with intrauterine exposure to maternal GDM. This supports the hypothesis that intrauterine exposure to diabetic environment can induce epigenetic changes in offspring. Further large scale replication studies and functional investigations are required to validate our findings.
Materials and methods
Study design and population
This study examined 18 discordant sibling pairs to investigate DNA methylation markers associated with intrauterine exposure to GDM. In each family, an affected sibling was conceived during GDM pregnancy and the control sibling during non-GDM pregnancy. Each of the sibling pairs was full-siblings and the main difference was their exposure to intrauterine hyperglycemia. All the mothers had at least one GDM pregnancy and delivered healthy singleton full-term neonates at Seoul National University Bundang Hospital between December 2003 and August 2006. GDM was diagnosed by a 2-step approach using 50 g glucose load test (cut-off >140 mg/dL) followed by 100 g OGTT with glucose thresholds established by Carpenter and Coustan.Citation38 None of the mothers had overt diabetes before pregnancy. Sibling pairs of these mothers were recruited to be enrolled in this study when the offspring born during GDM pregnancy was at age 5–8 y. The Institutional Review Board of the Seoul National University Bundang Hospital (IRB No. B-1007–105–007) approved this study and written informed consent was obtained from the parents and children.
DNA methylation analysis
Genomic DNA was extracted from the peripheral blood leukocytes of the offspring immediately after sampling using Gentra Puregene Blood Kit (Qiagen, Hilden, Germany). The DNA samples were treated with sodium bisulfite using Zymo EZ-96 DNA methylation kit (Zymo Research, Irvine, CA, USA) and applied to the HM450 K (Illumina, San Diego, CA, USA) assay. The raw intensity data were processed using an R package RnBeads.Citation39 The data can be obtained from the GEO accession number GSE102177. Methylation status at each of the CpG sites was quantified as a β value, which is defined as the ratio of the methylated probe intensity and the total intensity, ranging from 0 (fully unmethylated) to 1 (fully methylated). CpG probes with a detection P > 0.01, associated with single nucleotide variations, outside of CpG context or located at sex chromosome were excluded from analysis. β-mixture quantile normalization (BMIQ)Citation40 was performed to reduce technical differences between 2 different bead chemistry of HM450K array (Supplementary Figure S1.). White blood cell composition was inferred using the method proposed by Houseman et al.Citation41 to account for cell type heterogeneity in assessing differential DNA methylation.
Epigenome-wide association analysis was conducted to identify differentially methylated CpG sites associated with exposure to maternal GDM pregnancy. M-values () which are logit transformed β values were used to account for heteroscedasticity and to allow the assumption of Gaussian distribution.Citation42 An empirical Bayes approach as implemented in the R package limmaCitation43 was applied. M-values were fitted using a design matrix in which age, sex, experimental batch, GDM exposure status, and sibling IDs (Model 1), and additionally estimated cell type composition (Model 2), were defined. Pairwise contrasts between GDM and non-GDM samples were made at each of the CpG sites after adjusting for confounding factors of age, sex, experimental batch and additionally leukocyte composition. P values were estimated using moderated t-statisticsCitation43 and false discovery rate (q value) was used to adjust for multiple comparison.Citation44 The same statistical model and estimation method were applied to compare overall DNA methylation of HNF4A between cases and controls. To make comparisons more interpretable between affected and unaffected siblings, we used DNA methylation levels that were adjusted for known confounders of age, sex, and experimental batches.
Unsupervised hierarchical clustering analysis was then performed using covariate-adjusted DNA methylation values of the 100 most significant probes. Distance between all pairs of the samples was estimated using Manhattan distance. Clustering was performed using average linkage algorithms.
Pyrosequencing analysis
Bisulfite pyrosequencing was performed to validate the finding of differential methylation of the CpG site cg08407434. Each primer was designed using Pyrosequencing Assay Design Software v2.0 (Qiagen). The primers are provided in Supplementary Table 1. PCR reaction was performed and confirmed by electrophoresis staining. ssDNA template was prepared from 16–18 µL biotinylated PCR product using streptavidin Sepharose HP beads (Amersham Biosciences, Sweden) following the PSQ 96 sample preparation guide. The respective sequencing primers (15 pM) were added for analysis. Sequencing was performed on a PyroMark ID system with the Pyro Gold reagents kit (Qiagen) according to the manufacturer's instruction without further optimization. The methylation level was quantified by the average of the degree of methylation at the CpG sites formulated in pyrosequencing.
Gene expression profiling
Buffy coat was snap-frozen and stored in liquid nitrogen until further processing. Using the TRIzol LS Reagent (Thermo Fisher Scientific, Waltham, MA, USA), RNA was isolated according to the manufacturer's protocol. Gene expression levels were investigated using Agilent SurePrint G3 Human GE 8 × 60K Microarray (Agilent Technologies, Santa Clara, CA, USA). A total of 27 samples were available for analysis with RNA integrity number 2.5 or above after excluding 9 samples (5 for sample unavailability and 4 for poor RNA quality). Raw data of the microarray was loaded and processed using the limma R package.Citation43 We applied background correction using a convolution of normal and exponential distributions and normalization using the Cyclic Loess method.Citation45 Irregular replicate probes were averaged and log2-transfromed data was used for analysis.
Gene set enrichment analysis
A total of 8,545 genes with at least one nominally significant differentially methylated probe (P<0.05) were selected. These genes were ranked by their mean difference of β values using the most significant CpG site directly linked with the gene. Gene set enrichment analysisCitation46 was performed using the ranked list of genes and predefined 4,307 pathway gene sets downloaded from the ConsensusPathDB (http://cpdb.molgen.mpg.de/).24
Disclosure of potential conflicts of interest
No potential conflicts of interest were disclosed.
Acknowledgments
We are grateful to Ministry of Health & Welfare, Seoul National University Hospital and Seoul National University Bundang Hospital for giving us grants. We also thank the participants of this study.
Additional information
Funding
References
- Reece EA, Leguizamon G, Wiznitzer A. Gestational diabetes: the need for a common ground. Lancet. 2009;373:1789-97. doi:10.1016/S0140-6736(09)60515-8. PMID:19465234
- Dabelea D. The predisposition to obesity and diabetes in offspring of diabetic mothers. Diabetes Care. 2007;30 Suppl 2:S169−74. doi:10.2337/dc07-s211. PMID:17596467
- Clausen TD, Mathiesen ER, Hansen T, Pedersen O, Jensen DM, Lauenborg J, Damm P. High prevalence of type 2 diabetes and pre-diabetes in adult offspring of women with gestational diabetes mellitus or type 1 diabetes: the role of intrauterine hyperglycemia. Diabetes Care. 2008;31:340-6. doi:10.2337/dc07-1596. PMID:18000174
- Fuchsberger C, Flannick J, Teslovich TM, Mahajan A, Agarwala V, Gaulton KJ, Ma C, Fontanillas P, Moutsianas L, McCarthy DJ, et al. The genetic architecture of type 2 diabetes. Nature. 2016;536:41-7. doi:10.1038/nature18642. PMID:27398621
- Manolio TA, Collins FS, Cox NJ, Goldstein DB, Hindorff LA, Hunter DJ, McCarthy MI, Ramos EM, Cardon LR, Chakravarti A, et al. Finding the missing heritability of complex diseases. Nature. 2009;461:747-53. doi:10.1038/nature08494. PMID:19812666
- Gillman MW. Developmental origins of health and disease. N Engl J Med. 2005;353:1848-50. doi:10.1056/NEJMe058187. PMID:16251542
- Gluckman PD, Hanson MA. The developmental origins of health and disease. Early life origins of health and disease. 2006:1-7.
- Hales CN, Barker DJ. Type 2 (non-insulin-dependent) diabetes mellitus: the thrifty phenotype hypothesis. Diabetologia. 1992;35:595-601. doi:10.1007/BF00400248. PMID:1644236
- Dabelea D, Hanson RL, Lindsay RS, Pettitt DJ, Imperatore G, Gabir MM, Roumain J, Bennett PH, Knowler WC. Intrauterine exposure to diabetes conveys risks for type 2 diabetes and obesity: a study of discordant sibships. Diabetes. 2000;49:2208-11. doi:10.2337/diabetes.49.12.2208. PMID:11118027
- Sandovici I, Smith NH, Nitert MD, Ackers-Johnson M, Uribe-Lewis S, Ito Y, Jones RH, Marquez VE, Cairns W, Tadayyon M, et al. Maternal diet and aging alter the epigenetic control of a promoter-enhancer interaction at the Hnf4a gene in rat pancreatic islets. Proc Natl Acad Sci U S A. 2011;108:5449-54. doi:10.1073/pnas.1019007108. PMID:21385945
- Feil R, Fraga MF. Epigenetics and the environment: emerging patterns and implications. Nat Rev Genet. 2012;13:97-109. PMID:22215131
- Kanherkar RR, Bhatia-Dey N, Csoka AB. Epigenetics across the human lifespan. Front Cell Dev Biol. 2014;2:49. doi:10.3389/fcell.2014.00049. PMID:25364756
- Chambers JC, Loh M, Lehne B, Drong A, Kriebel J, Motta V, Wahl S, Elliott HR, Rota F, Scott WR, et al. Epigenome-wide association of DNA methylation markers in peripheral blood from Indian Asians and Europeans with incident type 2 diabetes: a nested case-control study. Lancet Diabetes Endocrinol. 2015;3:526-34. doi:10.1016/S2213-8587(15)00127-8. PMID:26095709
- Wahl S, Drong A, Lehne B, Loh M, Scott WR, Kunze S, Tsai PC, Ried JS, Zhang W, Yang Y, et al. Epigenome-wide association study of body mass index, and the adverse outcomes of adiposity. Nature. 2017;541:81-6. doi:10.1038/nature20784. PMID:28002404
- Ruchat SM, Houde AA, Voisin G, St-Pierre J, Perron P, Baillargeon JP, Gaudet D, Hivert MF, Brisson D, Bouchard L. Gestational diabetes mellitus epigenetically affects genes predominantly involved in metabolic diseases. Epigenetics. 2013;8:935-43. doi:10.4161/epi.25578. PMID:23975224
- Finer S, Mathews C, Lowe R, Smart M, Hillman S, Foo L, Sinha A, Williams D, Rakyan VK, Hitman GA. Maternal gestational diabetes is associated with genome-wide DNA methylation variation in placenta and cord blood of exposed offspring. Human Molecular Genetics. 2014;24:3021-9. doi:10.1093/hmg/ddv013
- Quilter CR, Cooper WN, Cliffe KM, Skinner BM, Prentice PM, Nelson L, Bauer J, Ong KK, Constncia M, Lowe WL, et al. Impact on offspring methylation patterns of maternal gestational diabetes mellitus and intrauterine growth restraint suggest common genes and pathways linked to subsequent type 2 diabetes risk. FASEB Journal. 2014;28:4868-79. doi:10.1096/fj.14-255240. PMID:25145626
- Binder AM, LaRocca J, Lesseur C, Marsit CJ, Michels KB. Epigenome-wide and transcriptome-wide analyses reveal gestational diabetes is associated with alterations in the human leukocyte antigen complex. Clin Epigenetics. 2015;7:79. doi:10.1186/s13148-015-0116-y. PMID:26244062
- Damm P, Houshmand-Oeregaard A, Kelstrup L, Lauenborg J, Mathiesen ER, Clausen TD. Gestational diabetes mellitus and long-term consequences for mother and offspring: a view from Denmark. Diabetologia. 2016;59:1396-9. doi:10.1007/s00125-016-3985-5. PMID:27174368
- Kelstrup L, Hjort L, Houshmand-Oeregaard A, Clausen TD, Hansen NS, Broholm C, Borch-Johnsen L, Mathiesen ER, Vaag AA, Damm P. Gene expression and DNA methylation of PPARGC1A in muscle and adipose tissue from adult offspring of women with diabetes in pregnancy. Diabetes. 2016:db160227.
- Chen P, Piaggi P, Traurig M, Bogardus C, Knowler WC, Baier LJ, Hanson RL. Differential methylation of genes in individuals exposed to maternal diabetes in utero. Diabetologia. 2017;60:645-55. doi:10.1007/s00125-016-4203-1. PMID:28127622
- Chu AY, Deng X, Fisher VA, Drong A, Zhang Y, Feitosa MF, Liu CT, Weeks O, Choh AC, Duan Q, et al. Multiethnic genome-wide meta-analysis of ectopic fat depots identifies loci associated with adipocyte development and differentiation. Nat Genet. 2017;49:125-30. doi:10.1038/ng.3738. PMID:27918534
- Mahajan A, Sim X, Ng HJ, Manning A, Rivas MA, Highland HM, Locke AE, Grarup N, Im HK, Cingolani P, et al. Identification and functional characterization of G6PC2 coding variants influencing glycemic traits define an effector transcript at the G6PC2-ABCB11 locus. PLoS Genet. 2015;11:e1004876. doi:10.1371/journal.pgen.1004876. PMID:25625282
- Herwig R, Hardt C, Lienhard M, Kamburov A. Analyzing and interpreting genome data at the network level with ConsensusPathDB. Nat Protoc. 2016;11:1889-907. doi:10.1038/nprot.2016.117. PMID:27606777
- Simpkin AJ, Hemani G, Suderman M, Gaunt TR, Lyttleton O, Mcardle WL, Ring SM, Sharp GC, Tilling K, Horvath S. Prenatal and early life influences on epigenetic age in children: a study of mother–offspring pairs from two cohort studies. Hum Mol Genet. 2015;25:191-201. doi:10.1093/hmg/ddv456. PMID:26546615
- Lu Q, Aguilar BJ, Li M, Jiang Y, Chen YH. Genetic alterations of delta-catenin/NPRAP/Neurojungin (CTNND2): functional implications in complex human diseases. Hum Genet. 2016;135:1107-16. doi:10.1007/s00439-016-1705-3. PMID:27380241
- Yamagata K. Roles of HNF1alpha and HNF4alpha in pancreatic beta-cells: lessons from a monogenic form of diabetes (MODY). Vitam Horm. 2014;95:407-23. doi:10.1016/B978-0-12-800174-5.00016-8. PMID:24559927
- Ribel-Madsen R, Fraga MF, Jacobsen S, Bork-Jensen J, Lara E, Calvanese V, Fernandez AF, Friedrichsen M, Vind BF, Hojlund K, et al. Genome-wide analysis of DNA methylation differences in muscle and fat from monozygotic twins discordant for type 2 diabetes. PLoS One. 2012;7:e51302. doi:10.1371/journal.pone.0051302. PMID:23251491
- Liu CT, Monda KL, Taylor KC, Lange L, Demerath EW, Palmas W, Wojczynski MK, Ellis JC, Vitolins MZ, Liu S, et al. Genome-wide association of body fat distribution in African ancestry populations suggests new loci. PLoS Genet. 2013;9:e1003681. doi:10.1371/journal.pgen.1003681. PMID:23966867
- Yang Q, Kottgen A, Dehghan A, Smith AV, Glazer NL, Chen MH, Chasman DI, Aspelund T, Eiriksdottir G, Harris TB, et al. Multiple genetic loci influence serum urate levels and their relationship with gout and cardiovascular disease risk factors. Circ Cardiovasc Genet. 2010;3:523-30. doi:10.1161/CIRCGENETICS.109.934455. PMID:20884846
- Ray SK, Li HJ, Metzger E, Schule R, Leiter AB. CtBP and associated LSD1 are required for transcriptional activation by NeuroD1 in gastrointestinal endocrine cells. Mol Cell Biol. 2014;34:2308-17. doi:10.1128/MCB.01600-13. PMID:24732800
- Le Roith D. Seminars in medicine of the Beth Israel Deaconess Medical Center. Insulin-like growth factors. N Engl J Med 1997;336:633-40. doi:10.1056/NEJM199702273360907. PMID:9032050
- Rajpathak SN, Gunter MJ, Wylie-Rosett J, Ho GY, Kaplan RC, Muzumdar R, Rohan TE, Strickler HD. The role of insulin-like growth factor-I and its binding proteins in glucose homeostasis and type 2 diabetes. Diabetes Metab Res Rev. 2009;25:3-12. doi:10.1002/dmrr.919. PMID:19145587
- Lappas M. Insulin-like growth factor-binding protein 1 and 7 concentrations are lower in obese pregnant women, women with gestational diabetes and their fetuses. J Perinatol. 2015;35:32-8. doi:10.1038/jp.2014.144. PMID:25078866
- Morgan HD, Sutherland HG, Martin DI, Whitelaw E. Epigenetic inheritance at the agouti locus in the mouse. Nat Genet. 1999;23:314-8. doi:10.1038/15490. PMID:10545949
- Rakyan VK, Chong S, Champ ME, Cuthbert PC, Morgan HD, Luu KV, Whitelaw E. Transgenerational inheritance of epigenetic states at the murine Axin(Fu) allele occurs after maternal and paternal transmission. Proc Natl Acad Sci U S A. 2003;100:2538-43. doi:10.1073/pnas.0436776100. PMID:12601169
- Rakyan VK, Down TA, Balding DJ, Beck S. Epigenome-wide association studies for common human diseases. Nat Rev Genet. 2011;12:529-41. doi:10.1038/nrg3000. PMID:21747404
- Carpenter MW, Coustan DR. Criteria for screening tests for gestational diabetes. Am J Obstet Gynecol. 1982;144:768-73. doi:10.1016/0002-9378(82)90349-0. PMID:7148898
- Assenov Y, Muller F, Lutsik P, Walter J, Lengauer T, Bock C. Comprehensive analysis of DNA methylation data with RnBeads. Nature methods. 2014;11:1138-40. doi:10.1038/nmeth.3115. PMID:25262207
- Teschendorff AE, Marabita F, Lechner M, Bartlett T, Tegner J, Gomez-Cabrero D, Beck S. A beta-mixture quantile normalization method for correcting probe design bias in Illumina Infinium 450 k DNA methylation data. Bioinformatics. 2013;29:189-96. doi:10.1093/bioinformatics/bts680. PMID:23175756
- Houseman EA, Accomando WP, Koestler DC, Christensen BC, Marsit CJ, Nelson HH, Wiencke JK, Kelsey KT. DNA methylation arrays as surrogate measures of cell mixture distribution. BMC Bioinformatics. 2012;13:86. doi:10.1186/1471-2105-13-86. PMID:22568884
- Du P, Zhang X, Huang CC, Jafari N, Kibbe WA, Hou L, Lin SM. Comparison of Beta-value and M-value methods for quantifying methylation levels by microarray analysis. BMC Bioinformatics. 2010;11:587. doi:10.1186/1471-2105-11-587. PMID:21118553
- Smyth GK. Linear models and empirical bayes methods for assessing differential expression in microarray experiments. Stat Appl Genet Mol Biol. 2004; 3:1-25. doi:10.2202/1544-6115.1027. PMID:16646809
- Storey JD. The positive false discovery rate: A Bayesian interpretation and the q-value. Ann Stat. 2003;31:2013-35. doi:10.1214/aos/1074290335
- Ballman KV, Grill DE, Oberg AL, Therneau TM. Faster cyclic loess: normalizing RNA arrays via linear models. Bioinformatics. 2004;20:2778-86. doi:10.1093/bioinformatics/bth327. PMID:15166021
- Subramanian A, Tamayo P, Mootha VK, Mukherjee S, Ebert BL, Gillette MA, Paulovich A, Pomeroy SL, Golub TR, Lander ES, et al. Gene set enrichment analysis: a knowledge-based approach for interpreting genome-wide expression profiles. Proc Natl Acad Sci U S A. 2005;102:15545-50. doi:10.1073/pnas.0506580102. PMID:16199517