
ABSTRACT
The dysregulation of genes in neurodevelopmental disorders that lead to social and cognitive phenotypes is a complex, multilayered process involving both genetics and epigenetics. Parent-of-origin effects of deletion and duplication of the 15q11-q13 locus leading to Angelman, Prader-Willi, and Dup15q syndromes are due to imprinted genes, including UBE3A, which is maternally expressed exclusively in neurons. UBE3A encodes a ubiquitin E3 ligase protein with multiple downstream targets, including RING1B, which in turn monoubiquitinates histone variant H2A.Z. To understand the impact of neuronal UBE3A levels on epigenome-wide marks of DNA methylation, histone variant H2A.Z positioning, active H3K4me3 promoter marks, and gene expression, we took a multi-layered genomics approach. We performed an siRNA knockdown of UBE3A in two human neuroblastoma cell lines, including parental SH-SY5Y and the SH(15M) model of Dup15q. Genes differentially methylated across cells with differing UBE3A levels were enriched for functions in gene regulation, DNA binding, and brain morphology. Importantly, we found that altering UBE3A levels had a profound epigenetic effect on the methylation levels of up to half of known imprinted genes. Genes with differential H2A.Z peaks in SH(15M) compared to SH-SY5Y were enriched for ubiquitin and protease functions and associated with autism, hypoactivity, and energy expenditure. Together, these results support a genome-wide epigenetic consequence of altered UBE3A levels in neurons and suggest that UBE3A regulates an imprinted gene network involving DNA methylation patterning and H2A.Z deposition.
Introduction
Autism spectrum disorder (ASD) is a developmental disability characterized by social and communication impairments and repetitive behaviors with an estimated prevalence of 1 in 68.Citation1 Causes of ASD vary immensely among those affected involving a variety of genetic mutations as well as multiple environmental risk factors.Citation2–4 Adding to the complexity of ASD etiology, genes with de novo variants are enriched for functions involving chromatin modification, developmental transcription factors, and signal transduction pathways.Citation5–7 Epigenetic marks, such as DNA methylation and histone modifications, have also been observed to be critically important to proper brain development.Citation8,9 Additionally, aberrant epigenetic regulation has been observed at the interface of genetic and environmental risk interactions implicated in ASD.Citation10–12
Genomic imprinting, whereby expression of a subset of mammalian genes are restrained to one parental allele, is a central epigenetic inheritance pattern relevant to ASD. Presently, imprinting is understood as a mechanism aimed at controlling the amount of maternal resources allocated to the offspring from conception to weaning.Citation13 Imprinted genes are members of various gene families corresponding to diverse biochemical processes and are regulated by associated imprinting control regions (ICRs), which exhibit parent-of-origin epigenetic modifications that govern the imprinting of the locus.Citation14 Some imprinted genes have been observed to associate in an imprinted genes network (IGN) that controls embryonic growth and differentiation.Citation15 Similar to regulation of ICRs, IGN expression was observed to be mediated by an epigenetic effect through recruitment of chromatin-modifying partners.Citation16,17 The realization that IGN genes are coordinately regulated brings a new perspective that has not been previously examined in neurodevelopment or the etiology of ASD.
The human neurodevelopmental 15q11.2-q13.3 locus is a region of particular interest to the study of how epigenetics and imprinting disorders lead to ASD. Deletions of the 15q11.2-q12 locus on the paternal or maternal allele are responsible for the reciprocal disorders of Prader-Willi (PWS) or Angelman (AS) syndromes, respectively. In contrast, maternal duplications, lead to chromosome 15q11.2-q13.3 maternal duplication (Dup15q) syndrome, a genetic cause of ASD. UBE3A, which encodes an E3 ubiquitin ligase, is the imprinted gene most likely responsible for maternal-specific effects of 15q11.2-q13.3 deletion or duplication disorders.Citation18 UBE3A has known ubiquitin ligase function targeting multiple proteins for degradation.Citation19,20 However, it has also been shown to have transcriptional co-activator functions at steroid hormone receptors involving direct binding to the transcription complex.Citation21,22 UBE3A is localized in cytosolic and nuclear compartments and at both the pre- and post-synaptic locations and may play a diverse role in multiple cellular and transcriptional events in neurodevelopment.Citation23 The role of deficient UBE3A levels in AS has been well established; however, the pathogenic role of increased UBE3A levels in Dup15q syndrome remains untested.
We previously showed that both Dup15q brain and a neuronal cell culture model exhibit significant global DNA hypomethylation enriched over autism candidate genes impacting their transcriptional stability.Citation24 Dup15q is one of the most common CNVs observed in ASD and is characterized by increased expression of maternally expressed UBE3A.Citation25–27 While the specific role of UBE3A in the ASD phenotype of Dup15q syndrome is not currently known, we observed a link between UBE3A overexpression and histone H2A.Z epigenetic modifications on genes with functions at neuronal synapses, transcriptional regulation, and signal transduction pathways.Citation24 This suggests that UBE3A might influence neuronal maturation by directing chromatin patterning. Additionally, we proposed a mechanism by which UBE3A regulates H2A.Z monoubiquitination via degradation of RING1B, a known UBE3A target. This interaction may explain the role UBE3A plays in the observed hypomethylation of Dup15q.
In this study, we took a multi-layered genomics approach to understand how UBE3A affects the epigenome in Dup15q and Angelman syndromes. Integrating whole genome bisulfite sequencing (WGBS), transcriptome sequencing (RNA-seq), and chromatin immunoprecipitation sequencing (ChIP-seq), we developed an epigenomic profile of the dysregulation caused by aberrant levels of UBE3A in human neuronal cell culture models. We observed strong overlap between genes with differentially methylated regions (DMRs) and histone peaks of H3K4me3 and H2A.Z. These UBE3A-altered genes were enriched for imprinted genes with alterations to H2A.Z gene body localization.
Results
To understand the role of UBE3A in epigenetic regulation genome-wide, we first performed triplicate siRNA knockdowns of UBE3A (siUBE3A) or control (siCTL) in a human neuronal cell line (SH-SY5Y) and a chromosome duplication model of Dup15q syndrome [SH(15M)].Citation28 Compared to the parental SH-SY5Y cells treated with siCTL, UBE3A protein levels in similarly treated SH(15M) cells were 30% higher, while cells treated with siUBE3A were 90% lower in SH-SY5Y and 70% lower in SH(15M) (). Compared to the siCTL of each parental cell line, knockdown efficiency of UBE3A was 90% in SH-SY5Y and 72% in SH(15M) (Fig. S1A). From these cell cultures, we isolated DNA for WGBS, RNA for RNA-seq, and chromatin for ChIP-seq of one histone mark of active promoters (H3K4me3) and one histone variant (H2A.Z) of active promoters and poised genes (). From each dataset, we identified whole-genome methylation levels, differentially expressed genes, and histone peaks, respectively.
Figure 1. Multi-layered genomics analysis of SH-SY5Y and SH(15M) UBE3A siRNA knockdown reveals how altered UBE3A levels impact epigenomic patterns. (A) UBE3A protein levels quantified from Western blot in SH(15M) and SH-SY5Y for siRNA control and UBE3A knockdown relative to GAPDH (blot in Fig. S1). Labeled are the four comparison groups used for differential genomic analyses. Error bars represent the mean ± SEM of three replicates. Significance by 2-way ANOVA P < 0.0001. (B) Study design: following UBE3A siRNA knockdown and control treatment, each triplicate culture was harvested for DNA, RNA, or chromatin to assay DNA methylation, differentially expressed genes, or histone peaks, respectively. (C) Table outlining results of the genomic assays for each comparison group by UBE3A levels. Each of the four comparisons generated independent lists of genes that overlapped with differential marks from each of the genomic assays.
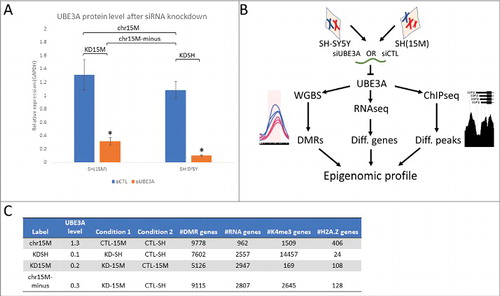
Four comparison groups were created to explore the consequences of UBE3A gain or loss within a different genomic context (). These included: 1) the chromosome 15M effect (chr15M)(CTL-15M vs. CTL-SH); 2) reduced UBE3A in the context of normal 2X copy number (KDSH)(KD-SH vs. CTL-SH); 3) reduced UBE3A in the context of the 3X copy number (KD15M)(KD-15M vs. CTL-15M); and 4) the 15M effect with reduced UBE3A (chr15M-minus)(KD-15M vs. CTL-SH). These comparisons were performed on each genomic data set resulting in gene lists showing differentially methylated regions (DMR genes) (Δ%methylation ≥ 0.1, q < 0.01), differential expression (RNA genes) (P < 0.05), and differential histone peak levels (K4me3 or H2A.Z genes) (q < 0.01) ( and S3-S4). Across all comparisons, genes with DMRs were the most numerous, while genes showing differential H2A.Z peaks were least prevalent. Increase of UBE3A from the chromosome 15M effect showed the fewest differentially expressed genes compared to the three knockdown comparisons. There were distinctions between cell lines as knockdown of UBE3A in SH-SY5Y had a profound effect on the levels of H3K4me3 peaks in contrast to SH(15M), which had relatively few H3K4me3 peak differences following knockdown.
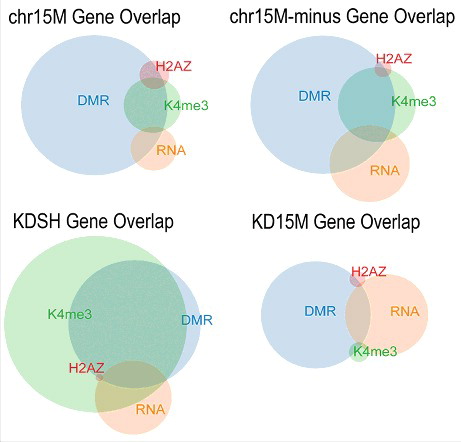
To examine the convergent effect of UBE3A expression differences, we determined the level of overlap between each dataset within each comparison group and calculated significance by Fisher's exact test (). For all four comparisons, genes with DMRs significantly overlapped genes with differential H3K4me3 and H2A.Z peaks. Differentially expressed genes did not significantly overlap with other datasets except in the KDSH comparison group, where it overlapped with differential H2A.Z genes. Genes with differential histone peaks H3K4me3 and H2A.Z overlapped in all comparisons except KD15M. All comparisons except KDSH showed similar patterns of overlap among all datasets, although KD15M comparison had relatively fewer differential H3K4me3 peaks ( and S2). The KDSH comparison showed the most unique pattern of overlapping epigenetic marks displaying a large overlap of DMR, H3K4me3, and H2A.Z associated genes, as well as a much greater number of differential H3K4me3 peaks.
Table 1. Genomic datasets gene list overlaps.
Figure 2. Overlap of dataset gene lists shows effect of altered UBE3A levels on the epigenome. Size-dependent Venn diagrams show a graphical representation of the gene lists generated by each genomic assay for each comparison group. Circles indicate the relative number of genes for each dataset and show the level of overlap between datasets within each comparison group.
To identify UBE3A-impacted pathways, functions, and traits, gene lists for each comparison group and dataset were analyzed by Gene Ontology (GO) analysis. DMR analysis showed a high enrichment for gene functions in DNA binding, RNA metabolism, and regulation of gene expression across all comparison groups (). There was also strong enrichment of neurologically relevant terms including brain morphology and synaptic activity via the SNARE complex. Additionally, terms consistent with neurodevelopmental disorder physical characteristics, including broad face, waddling gait, and Genu recurvatum, were enriched in the chr15M and KDSH groups. Enrichment of DNA binding, chromatin, and gene expression function were also seen for genes with differential H3K4me3 peaks within the chr15M and chr15M-minus groups (). These two comparison groups derived from SH(15M) cells were also enriched for genes associated with impaired passive avoidance and fear-related response behavioral phenotypes. No significant enrichment was observed for the KD15M group. The KDSH group, which showed the largest effect on differential H3K4me3 peaks, also had the most unique GO term enrichment, with genes strongly enriched in epigenetic regulation including the PRC1 and polycomb complexes.
Figure 3. Gene Ontology enrichment reveals that UBE3A effects epigenetic regulation of neuronal development and imprinted genes. (A) GO enrichment heatmap for DMR-associated gene lists for each comparison group. Significance of term enrichment by FDR q-value for each group is indicated by colored key. (B) GO enrichment heatmap for differential H3K4me3-associated gene lists for chr15M, KDSH, and chr15M-minus comparison groups. Significance of term enrichment by FDR q-value for each group is indicated by colored key. (C) GO enrichment heatmap for differentially expressed genes for each comparison group. Significance of term enrichment by Bonferroni P value for each group is indicated by colored key. (D) GO enrichment for differential H2A.Z-associated genes in the chr15M comparison group. Significance of term enrichment by FDR q-value is represented by -log10 bar values. (E) GO enrichment for differential H2A.Z-associated genes in the KDSH comparison group. Significance of term enrichment by FDR q-value is represented by -log10 bar values.
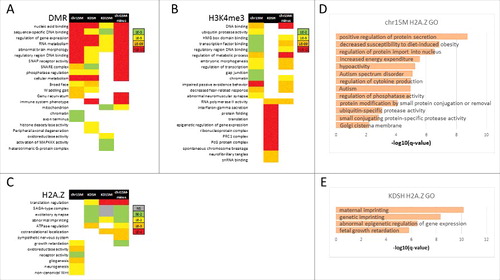
Differentially expressed genes showed a separation of GO term enrichments between gain and loss of UBE3A (). The chr15M comparison was uniquely enriched for genes involved in glial and neuronal cell development. The three UBE3A knockdown comparison groups had a large term overlap including regulation of translation, excitatory synapse, Spt-Ada-Gcn5-acetyltransferase (SAGA-type) complex, and abnormal imprinting. Genes from the abnormal imprinting term included imprinted X-linked genes XIST and TSIX as well as imprinted autosomal genes KCNQ10T1, IGF2, GNAS, and PEG3 (Supplemental Data and Figures S5-S8).
While not all group comparisons showed significant GO term enrichment for genes with differential H2A.Z peaks, the chr15M comparison group modeling Dup15q syndrome was enriched for genes associated with autism, ASD, hypoactivity, energy expenditure, and obesity (). Additionally, this group showed enrichment for genes with functions in ubiquitin-specific protease activity, protein secretion, and protein import into nucleus. Interestingly, while the KDSH group contained the fewest genes with differential H2A.Z peaks, these showed highly significant enrichment for imprinted genes (). Imprinted genes in this group included IGF2, GNAS, DKL1, and RTL1 (Supplemental Data). This group also contained genes enriched for epigenetic regulation and fetal growth. No significant term enrichment was observed for the KD15M nor the chr15M-minus comparison groups.
Given that several of the comparison groups were enriched for GO terms related to imprinting, we further evaluated the mode and extent to which UBE3A affects imprinted genes. We utilized a list of experimentally confirmed imprinted genes (http://www.geneimprint.com/site/genes-by-species) and determined the level of overlap with our datasets within each comparison group. For all comparison groups, genes with DMRs were significantly enriched for imprinted genes determined by Fisher's exact test (). Additionally, each comparison group contained DMRs within known, ubiquitously imprinted ICRsCitation29 (Supplemental Data). For the KDSH comparison group, genes with differential H2A.Z peaks were also significantly enriched for imprinted genes including IGF2, GNAS, DLK1, and RTL1. These four imprinted genes along with non-imprinted EEF2 were also the only five genes to be overlapped between all datasets in the KDSH group (Supplemental data). Genes with differential H3K4me3 peaks in the chr15M comparison group also showed significant enrichment for imprinted genes.
Table 2. Genomic datasets imprinted gene overlaps.
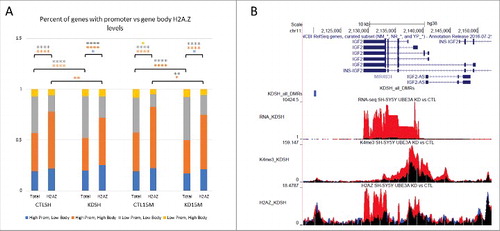
We previously demonstrated that SH(15M) cells and Dup15q brain showed lower levels of the histone H2A ubiquitin ligase RING1B, and genes epigenetically altered in SH(15M) cells were enriched for higher gene body levels of H2A.Z, a ubiquitinated target of RING1B.Citation24 To further understand the connection between UBE3A levels and H2A.Z positioning at other imprinted genes and genome-wide, we compared levels of H2A.Z in four quadrants of H2A.Z binding in promoters, gene bodies, or both (Fig. S9). As expected based on our prior analysis,Citation24 genes observed to show differential H2A.Z peaks across all four comparison groups were significantly enriched for gene body H2A.Z levels compared to all genes (). Both SH(15M) cell line conditions showed an approximate 5% increase in the number of genes with both high promoter and gene body H2A.Z levels compared to their respective SH-SY5Y counterparts, which was significant by Fisher's exact test (P < 0.01). Upon UBE3A knockdown in both cell lines, there was a significant average 7% loss of genes (both total genes and differential H2A.Z subset) in the high promoter and gene body H2A.Z quadrant coinciding with an approximate 7% increase in genes with low promoter and gene body H2A.Z levels (). In contrast, upon UBE3A knockdown in SH-SY5Y, levels of gene body H2A.Z in EEF2, RTL1, and IGF2 increased by approximately two-fold compared to the CTL-SH ( and Fig. S10). As expected based on prior predictions,Citation30 correlating DNA methylation levels with either gene body H2A.Z (Fig. S10) or promoter H2A.Z (Fig. S11) levels showed a general trend of anti-correlation. For both H2A.Z locations, genes with differential H2A.Z between all comparison groups were significantly enriched for high gene body DNA methylation and high H2A.Z levels (quadrant 2) compared to all genes, but showed no significant changes between cell types or knockdown conditions. Overall, these data support a model in which UBE3A levels alter gene body H2A.Z positioning, and suggest that UBE3A-mediated changes to methylation patterns at imprinted genes are due, in part, to H2A.Z repositioning particularly for the lowest UBE3A level (0.1x in KDSH).
Figure 4. UBE3A knockdown in SH-SY5Y and SH(15M) changes H2A.Z promoter and gene body levels. (A) Percent of genes with high or low promoter H2A.Z and high or low gene body H2A.Z from quadrants in Figure S5. Percent of total genes and percent of genes with differential H2A.Z peaks are shown for each cell type and siRNA condition. Comparisons indicate significance of the change in number of genes following UBE3A knockdown by Fisher's exact test. (* P < 0.01, ** P < 0.001, **** P ≅ 0) (B) Representative UCSC Genome Browser snapshot of IGF2 showing tracks of each genomic dataset and highlighting increase of H2A.Z at imprinted genes.
Discussion
Our multi-layered genomics analysis of the effect of UBE3A expression levels in human neuronal cell culture models has improved the existing evidence for the effect UBE3A has on the epigenome and resulted in several novel findings. First, our experiments revealed that both UBE3A gain and loss showed significant effects on DNA methylation leading to DMRs in genes involved in transcriptional regulation and brain development. Second, we gained new insights into the overlap of distinct epigenetic marks in response to UBE3A level changes. Third, these studies revealed a significant effect of knocking down UBE3A levels on the methylation of up to half of known imprinted genes, suggesting for the first time a pivotal role for UBE3A in a neuronal imprinted gene network. Fourth, our multi-layered approach revealed some interesting new insights about the degree of overlap between epigenetic marks of gene activity and transcript levels themselves in a controlled system. Together, these data give strong support for a genome-wide, epigenomic function of UBE3A by directing DNA methylation and H2A.Z positioning and reveal a novel UBE3A-mediated imprinted gene network in neurons.
Our gene enrichment analyses of UBE3A-mediated changes to transcripts and epigenetic marks revealed some interesting insights into the diseases caused by altered UBE3A levels. DMR analysis revealed genes involved in brain morphology and synaptic vesicle activity as well as genes implicated in ASD-relevant physiologic deficits including broad face, waddling gait, and Genu recurvatum. ChIP enrichment for H3K4me3 in the duplicated chromosome comparison groups (chr15M and chr15M-minus) revealed genes involved in early embryonic and synaptic development and behavioral and impaired learning phenotypes typical to ASD. Differentially expressed genes resulting from duplication of UBE3A (chr15M) were enriched in neurogenesis processes while UBE3A knockdown (KDSH, KD15M, and chr15M-minus) revealed genes involved in synaptic activity, stress response, and abnormal imprinting. Most strikingly, although ChIP enrichment of H2A.Z revealed the fewest genes, these genes are strongly implicated in autism and a significant subset are other imprinted genes.
Our data showing significant overlapping genes with UBE3A-mediated differential methylation and H2A.Z peaks contributes further understanding to the inter-relationship between these epigenetic features. We previously observed that Dup15q patient brain samples showed global DNA hypomethylation that was also reflected in the SH(15M) cell line when compared to the parental SH-SY5Y.Citation24 Additionally, UBE3A knockdown in both SH-SY5Y and SH(15M) resulted in the restoration of synaptic transcripts and RING1B levels but global DNA methylation levels that remained below those of the controls.Citation24 Here, we identified DMRs that were both hypo- and hyper-methylated in response to both the 15M effect and differing levels of UBE3A (Figure S5). The hypothesized link between UBE3A and DNA methylation changes is through RING1B, an E3 ligase in the human polycomb repressive 1 complex (PRC1).Citation24 RING1B monoubiquitinates H2A and H2A.Z, and is targeted for canonical ubiquitination and subsequent degradation by UBE3A. siRNA studies have shown that RING1B regulates the overall level of ubiquitinated H2A.Z in human cells and that monoubiquitinated H2A.Z is associated with facultative heterochromatin,Citation31 suggesting that H2A.Z plays a role in epigenetic silencing by holding a poised chromatin state. Furthermore, exclusion of H2A.Z has been seen at sites of DNA methylation in the bodies of actively transcribed genes. Mutation of the MET1 DNA methyltransferase causing both losses and gains of DNA methylation genome-wide have resulted in reciprocal changes in H2A.Z deposition, while mutation of the SWR1 complex that incorporates H2A.Z resulted in genome-wide hypermethylation.Citation30 Additionally, when DNA methylation is inhibited by azacytidine, H2A.Z-containing nucleosomes encroach into adjacent regions suggesting that histone variants associated with transcription or transcriptional poising may be limited to their functional targets by surrounding DNA methylation marks.Citation32 Together, these results suggest a role of UBE3A in chromatin changes associated with altered DNA methylation.
We found that UBE3A knockdown resulted in loss of both promoter and gene body H2A.Z (). H2A.Z has different functions depending on its deposition where presence within gene bodies is correlated with lower transcription levels and higher variability in expression patterns across tissue types and environmental conditions, and a major function of gene-body DNA methylation is to exclude H2A.Z from the bodies of highly and constitutively expressed genes.Citation33 Conversely, the incorporation of monoubiquitinated H2A.Z into specific promoter-bound nucleosomes configures chromatin structure to poise genes for transcriptional activation.Citation34 This suggests that H2A.Z positioning regulates silencing and transcriptional activation via different mechanisms. While the widespread increase in H3K4me3 marks at promoters following UBE3A knockdown has not been previously described, this effect may be a result of the previously described role for UBE3A in associating with and polyubiquitinating estrogen receptor.Citation35,36 If UBE3A is required for degrading ER, the loss of UBE3A molecules likely results in widespread changes to promoters in which ER should only be transiently associated following ligand binding.
Through our overlapping datasets, we identified several imprinted genes affected by UBE3A transcriptionally and epigenetically, including DLK1, GNAS, IGF2, and RTL1. UBE3A is paternally imprinted in post-natal neurons and epigenetic influences on UBE3A levels in neurons are complex involving imprinting patterns inherited from oocytes and noncoding RNAs specific to neurons.Citation18 A network of imprinted genes including IGF2 and DLK1 has been observed that controls embryonic growth and may be the basis for the implementation of a common mechanism of gene regulation during mammalian evolution.Citation15 Additionally, disturbances in the regulation of imprinted genes have also been found to contribute to pediatric and adult cancer progression where deregulation of imprinted genes may be caused by aberrant DNA methylation at the ICRs controlling expression of individual or clustered imprinted genes.Citation37,38 This provides evidence that IGNs are pivotal for proper development and that regulation on an IGN by UBE3A could be crucial for neurodevelopment specifically.
Our integrated epigenomic assays of UBE3A-mediated changes led to some somewhat surprising findings with regard to the lack of significant overlap between transcriptional changes and genes with altered epigenetics, including H3K4me3. However, other experiments are consistent with our findings. For instance, deletion of CFP1 from mESCs causes loss of most H3K4me3 from expressed CpG island-associated genes yet there are minimal changes in transcript levels at these genes, assessed by microarray, or nascent transcription as measured by levels of RNA polymerase II by ChIP and genomic run-on sequencing.Citation39 Similarly, deletion of SPP1 from yeast, resulting in gene-specific H3K4me3 reduction, has virtually no effect on steady-state or dynamically changing mRNAs or transcription.Citation40 Strikingly, removal of H3K4 trimethylation, the mark that is most characteristic for transcription, has no effect on coding gene expression, in steady-state or dynamically changing conditions. In vitro, H3K4me3 is not required for transcription of a chromatinized substrate arguing against a globally instructive role for H3K4me3 in transcription.Citation41 Instead, studies suggest the SET1 histone methyltransferase complex may rely on pre-existing transcription-dependent events to deposit H3K4me3 into chromatin, ruling out a strictly instructive role but explaining the strong correlation with transcription.Citation42–46 The genes that were changed transcriptionally with UBE3A level changes in our system may have been out of synchrony with the more direct chromatin and DNA methylation changes that we observed. Additional studies that integrate multiple epigenetic marks with transcript changes are needed to fully understand the inter-relationships.
Here, we have shown the genome-wide, epigenomic effect on DNA methylation and histone modifications caused by aberrant levels of neuronal UBE3A. These epigenetic consequences were observed at genes involved in transcriptional regulation, brain development, as well as other imprinted genes. Our multi-layered approach also highlighted the disconnect between epigenetic modifications and transcriptional activity on a genome-wide scale and provides support that chromatin marks act as a fingerprint of directed genomic programming during development and not as an indicator of transient transcriptional changes. Finally, our study identified a novel role of UBE3A affecting transcription and epigenetics of other imprinted genes and provides evidence that UBE3A acts as a regulator in a novel, neuronal IGN. Genome-wide epigenetic changes related to UBE3A levels were primarily mediated through changes in H2A.Z deposition and DNA methylation with consequences on methylation of genes within a novel neuronal imprinted gene network.
Methods
Cell culture, siRNA knockdown, DNA, RNA and protein isolation
SH-SH5Y and SH-SY5Y-15M [SH(15M)] cells were grown as described.Citation28 For siRNA knockdown, triplicate cultures of SH and SH15M cells were transfected in Accell SMARTpool transfection medium containing 1 μM of UBE3A or control siRNAs supplemented with 2.5% fetal bovine serum for 5 days. siRNA-mediated knockdown of UBE3A protein was carried out using the Accell SMARTpool (Dharmacon L-005137-00-0005) mixture of four siRNAs according to the manufacturer's protocols. Accell non-targeting siRNA (Dharmacon D-001810-10-05) was used in knockdown controls. Briefly, approximately 400,000 SH or SH15M cells were plated in 12-well plates (DNA, RNA, and protein extraction) or approximately 5 × 10⁶ cell in 10 cm dishes (ChIP) and then incubated for 72 h in serum-free Accell SMARTpool transfection medium containing 1 μM of UBE3A siRNAs or non-target control. After 72 h, the medium was supplemented with serum-containing media. The cells were incubated for an additional 48 h for a total of five days. UBE3A knockdown was confirmed by Western blot analysis. DNA was isolated using the Zymo Quick-gDNA MiniPrep Kit. RNA was isolated using the Qiagen RNeasy Mini Kit. Protein was isolated using Thermo Fisher RIPA Lysis and Extraction Buffer and centrifugation.
Western blot
Protein extracts (20–50 μg) were subjected to 4–20% precast polyacrylamide gel (Bio-rad). The samples were separated and transferred onto PVDF membranes for 130 min at a constant current of 100 mA. The membranes were blocked in TBS blocking buffer containing 5% non-fat dried milk for 1 h. Anti-E6AP (1:1,000, Bethyl laboratory, A300-352A) and anti-GAPDH (1:10,000, Advanced Immunochemical, Inc., 2-RGM2) were incubated with the membranes in blocking buffer containing 0.1% Tween and 5% non-fat dried milk overnight at 4°C. The membranes were then washed and incubated with horseradish peroxidase conjugated secondary antibodies, anti-mouse (Bio Rad, 170–5047) and anti-rabbit (Bio Rad, 170–6515) immunoglobulin (IgG) antibody in 1:10,000 dilution for 1 h. After membrane washing, bound antibody was detected using a Super Signal West Dura Extended Duration Substrate kit (Thermo Fisher Scientific Inc.). Protein bands were normalized according to GAPDH using the ImageJ densitometry analysis system.
ChIP sample preparation
Following siRNA knockdown, cells were cross-linked by adding formaldehyde to a final concentration of 1% and incubated at RT for 10 min. Cross-link reaction was stopped by adding glycine to a final concentration of 0.125 M and incubated at RT for 5 min. Cells were rinsed twice with 1X PBS and, scraped, and pelleted. Pellets were resuspended in 200 uL 5 mM PIPES pH 8.0, 85 mM KCL with 10 uL IGEPAL and 10 uL PMSF protease inhibitor cocktail and incubated on ice for 10 min. Samples were briefly vortexed to release nuclei and centrifuged to pellet nuclei. Nuclei were then resuspended in 100 uL 50 mM Tris-HCl pH 8.1, 10 mM EDTA, 1% SDS with 10 uL PMSF and incubated on ice for 10 min. Chromatin was sheared on a Covaris E220 to an average length of 600 bp. Total chromatin (5%) was saved as input control and remaining chromatin was diluted 1:3 in 1 M Tris-HCl pH 8.1, 0.5 M EDTA, 5 M NaCl, 1.1% Trition X100, 0.01% SDS, and incubated with H3K4me3 antibody (Active Motif 39159) or H2A.Z antibody (Active Motif 39113) on a rotating platform at 4°C overnight. Magnetic protein G beads (15 µl; Cell Signaling Technology 9006) were added to each sample and incubated on a rotating platform for 2 h at 4°C. Magnetic beads were washed with RIPA buffer then settled in a magnetic rack followed by washes with 100 mM Tris-HCl pH 9.0, 500 mM LiCl, 1% IGEPAL, 1% deoxycholic acid then 100 mM Tris-HCl pH 9.0, 500 mM LiCl, 1% IGEPAL, 1% deoxycholic acid, 150 mM NaCl, respectively. Antibody/chromatin complexes were eluted with 100 uL 50 mM NaHCO3, 1% SDS. A total of 12 uL of 5 M NaCl was added and samples were incubated at 67°C overnight to reverse crosslinks. Samples were cooled and 1 uL RNaseA was added and incubated at 37°C for 30 min. DNA was purified using the Qiagen QIAquick PCR Purification Kit.
WGBS, RNA-seq, and ChIP-seq library preparation
WGBS libraries were prepared using the Illumina TruSeq DNA Methylation Kit (Illumina EGMK81312) according to manufacturer's protocol and three samples were pooled per lane on the HiSeq4000. RNA-seq libraries were prepared using the NEB NEBNext rRNA Depletion Kit (NEB E6310L) and NEBNext Ultra Directional RNA Library Prep Kit for Illumina (NEB E7420S) according to manufacturer's protocol and six samples were pooled per lane on the HiSeq4000. NGS libraries from ChIP DNA samples and input control DNA were prepared using the Kapa Biosystems KAPA Hyper Prep Kit (Kapa KK8504) according to manufacturer's protocol and 12 samples were pooled per lane on the HiSeq4000.
Bioinformatics
For all samples raw FASTQ files were filtered and trimmed using Trimmomatic.Citation47 For WGBS, reads were aligned to the human genome (hg38) using BS-Seeker2.Citation48 DMRs were called using the R packages DSS and bsseq and custom R commands.Citation49,50 For RNA-seq, reads were aligned to hg38 using TopHat2.Citation51 Differentially expressed genes were calculated using the edgeR Bioconductor package.Citation52,53 For ChIP-seq, reads were aligned using Bowtie2.Citation54 ChIP peaks and differential peaks were called using MACS2.Citation55 Gene Ontology was analyzed using GREATCitation56 for DMRs, H3Kme3, and H2A.Z gene lists, and EnrichrCitation57,58 for DE genes lists.
Differentially methylated region analysis
All custom scripts and code are available for download at github.com/kwdunaway/WGBS_Tools as well as instructions on how to use them. Brief descriptions of each script are also on the wiki of this site.
Data access
All sequencing data were deposited in the Gene Expression Omnibus (https://www.ncbi.nlm.nih.gov/geo/query/acc.cgi?acc=GSE103309), accession number GSE103309. The authors declare no competing financial interests. Correspondence and requests for materials should be addressed to JML ( [email protected]).
Author contributions
JML and DJS conceived the study. SJL, JML and DJS designed the study. SJL, KD, and MSI acquired the data. SJL, KD, CM, and AVC analyzed the data. SH15M cells provided by MH and SH. SJL, JML and DJS wrote the manuscript. All authors edited and approved the manuscript.
Sup-mat-UBE3A-mediated_regulation_of_imprinted_genes_and_epigenome-Lopez.rar
Download (17.2 MB)2017EPI0186R-s01.pdf
Download PDF (141.4 KB)Acknowledgments
This work was supported by NIH R01ES021707, NIH P01ES011269, and EPA 83543201 (JML) and R01ES021707-S1 (SJL). This work used the Vincent J. Coates Genomics Sequencing Laboratory at UC Berkeley, supported by NIH S10 Instrumentation Grants S10RR029668 and S10RR027303 and the UC Davis MIND Institute Intellectual and Developmental Disabilities Research Center [U54 HD079125].
Additional information
Funding
Related Research Data
References
- Christensen DL. Prevalence and characteristics of autism spectrum disorder among children aged 8 years—autism and developmental disabilities monitoring network, 11 sites, United States, 2012. MMWR. Surveill. Summ. 2016;65:1-23. doi:10.15585/mmwr.ss6503a1.
- Bourgeron T. From the genetic architecture to synaptic plasticity in autism spectrum disorder. Nat Rev Neurosci. 2015;16:551-563. doi:10.1038/nrn3992.
- Hallmayer J, Cleveland S, Torres A. et. al. Genetic heritability and shared environmental factors among twin pairs with autism. Arch. Gen. Psychiatry. 2011;68:1095-1102. doi:10.1001/archgenpsychiatry.2011.76.
- Krumm N, O'Roak BJ, Shendure J, Eichler EE. A de novo convergence of autism genetics and molecular neuroscience. Trends Neurosci. 2014;37:95-105. doi:10.1016/j.tins.2013.11.005.
- De Rubeis S, He X, Goldberg AP, Poultney CS, Samocha K, Cicek AE, Kou Y, Liu L, Fromer M, Walker S, et al. Synaptic, transcriptional and chromatin genes disrupted in autism. Nature. 2014;515:209-215. doi:10.1038/nature13772.
- Hormozdiari F, Penn O, Borenstein E, Eichler EE. The discovery of integrated gene networks for autism and related disorders. Genome Res. 2015;25:142-154. doi:10.1101/gr.178855.114.
- Iossifov I, O'Roak BJ, Sanders SJ, Ronemus M, Krumm N, Levy D, Stessman HA, Witherspoon KT, Vives L, Patterson KE, et al. The contribution of de novo coding mutations to autism spectrum disorder. Nature. 2014;515:216-221. doi:10.1038/nature13908.
- Lister R, Mukamel EA, Nery JR, Urich M, Puddifoot CA, Johnson ND, Lucero J, Huang Y, Dwork AJ, Schultz MD, et al. Global Epigenomic Reconfiguration During Mammalian Brain Development. Science (80-.). 2013;341: doi:10.1126/science.1237905.
- Fagiolini M, Jensen CL, Champagne FA. Epigenetic influences on brain development and plasticity. Curr. Opin. Neurobiol. 2009;19:207-212. doi:10.1016/j.conb.2009.05.009.
- Ciernia AV, LaSalle J. The landscape of DNA methylation amid a perfect storm of autism aetiologies. Nat Rev Neurosci. 2016;17:411-423. doi:10.1038/nrn.2016.41.
- Ladd-Acosta C, Hansen KD, Briem E, Fallin MD, Kaufmann WE, Feinberg AP. Common DNA methylation alterations in multiple brain regions in autism. Mol Psychiatry. 2014;19:862-871. doi:10.1038/mp.2013.114.
- Nardone S, Sams DS, Reuveni E, Getselter D, Oron O, Karpuj M, Elliott E, et al. DNA methylation analysis of the autistic brain reveals multiple dysregulated biological pathways. Transl Psychiatry. 2014;4:e433. doi:10.1038/tp.2014.70.
- Constancia M, Kelsey G, Reik W. Resourceful imprinting. Nature. 2004;432:53-57. doi:10.1038/432053a.
- Tycko B, Morison IM. Physiological functions of imprinted genes. J. Cell. Physiol. 2002;192:245-258. doi:10.1002/jcp.10129.
- Varrault A, Gueydan C, Delalbre A, Bellmann A, Houssami S, Aknin C, Severac D, Chotard L, Kahli M, Le Digarcher A, et al. Zac1 regulates an imprinted gene network critically involved in the control of embryonic growth. Dev. Cell. 2006;11:711-22. doi:10.1016/j.devcel.2006.09.003.
- Monnier P, Martinet C, Pontis J, Stancheva I, Ait-Si-Ali S, Dandolo L. H19 lncRNA controls gene expression of the Imprinted Gene Network by recruiting MBD1. Proc. Natl. Acad. Sci. 2013;110:20693-20698. doi:10.1073/pnas.1310201110.
- Gabory A, Ripoche MA, Le Digarcher A, Watrin F, Ziyyat A, Forné T, Jammes H, Ainscough JF, Surani MA, Journot L, et al. <em>H19</em> acts as a trans regulator of the imprinted gene network controlling growth in mice. Development. 2009;136:3413 LP-3421. doi:10.1242/dev.036061.
- LaSalle JM, Reiter LT, Chamberlain SJ. Epigenetic regulation of UBE3A and roles in human neurodevelopmental disorders. Epigenomics. 2015;7:1213-1228. doi:10.2217/epi.15.70.
- Huang L, Kinnucan E, Wang G, Beaudenon S, Howley PM, Huibregtse JM, Pavletich NP. Structure of an E6AP-UbcH7 complex: insights into ubiquitination by the E2-E3 enzyme cascade. Science. 1999;286:1321-1326. doi:10.1126/science.286.5443.1321.
- Eletr ZM, Kuhlman B. Sequence determinants of E2-E6AP binding affinity and specificity. J. Mol. Biol. 2007;369:419-428. doi:10.1016/j.jmb.2007.03.026.
- Nawaz Z, Lonard DM, Smith CL, Lev-Lehman E, Tsai SY, Tsai MJ, O'Malley BW. The Angelman syndrome-associated protein, E6-AP, is a coactivator for the nuclear hormone receptor superfamily. Mol. Cell. Biol. 1999;19:1182-1189. doi:10.1128/MCB.19.2.1182.
- Nawaz Z, Lonard DM, Dennis AP, Smith CL, O'Malley BW. Proteasome-dependent degradation of the human estrogen receptor. Proc. Natl. Acad. Sci. U. S. A. 1999;96:1858-1862. doi:10.1073/pnas.96.5.1858.
- Dindot SV, Antalffy BA, Bhattacharjee MB, Beaudet AL. The Angelman syndrome ubiquitin ligase localizes to the synapse and nucleus, and maternal deficiency results in abnormal dendritic spine morphology. Hum. Mol. Genet. 2008;17:111-118.
- Dunaway KW, Islam MS, Coulson RL, Lopez SJ, Vogel Ciernia A, Chu RG, Yasui DH, Pessah IN, Lott P, Mordaunt C, et al. Cumulative Impact of Polychlorinated Biphenyl and Large Chromosomal Duplications on DNA Methylation, Chromatin, and Expression of Autism Candidate Genes. Cell Rep. 2016;17:3035-3048. doi:10.1016/j.celrep.2016.11.058.
- Chaste P, Sanders SJ, Mohan KN, Klei L, Song Y, Murtha MT, Hus V, Lowe JK, Willsey AJ, Moreno-De-Luca D, Yu TW, et al. Modest Impact on Risk for Autism Spectrum Disorder of Rare Copy Number Variants at 15q11.2, Specifically Breakpoints 1 to 2. Autism Res. 2014;7:355-362. doi:10.1002/aur.1378.
- Hogart A, Wu D, LaSalle JM, Schanen NC. The comorbidity of autism with the genomic disorders of chromosome 15q11.2-q13. Neurobiol. Dis. 2010;38:181-191. doi:10.1016/j.nbd.2008.08.011.
- Scoles HA, Urraca N, Chadwick SW, Reiter LT, LaSalle JM. Increased copy number for methylated maternal 15q duplications leads to changes in gene and protein expression in human cortical samples. Mol. Autism. 2011;2:19. doi:10.1186/2040-2392-2-19.
- Meguro-Horike M, Yasui DH, Powell W, Schroeder DI, Oshimura M, Lasalle JM, Horike S. Neuron-specific impairment of inter-chromosomal pairing and transcription in a novel model of human 15q-duplication syndrome. Hum. Mol. Genet. 2011;20:3798-3810. doi:10.1093/hmg/ddr298.
- Court F, Tayama C, Romanelli V, Martin-Trujillo A, Iglesias-Platas I, Okamura K, Sugahara N, Simón C, Moore H, Harness JV, et al. Genome-wide parent-of-origin DNA methylation analysis reveals the intricacies of human imprinting and suggests a germline methylation-independent mechanism of establishment. Genome Res. 2014;24:554-569. doi:10.1101/gr.164913.113.
- Zilberman D, Coleman-Derr D, Ballinger T, Henikoff S. Histone H2A.Z and DNA methylation are mutually antagonistic chromatin marks. Nature. 2008;456:125-129. doi:10.1038/nature07324.
- Sarcinella E, Zuzarte PC, Lau PNI, Draker R, Cheung P. Monoubiquitylation of H2A.Z Distinguishes Its Association with Euchromatin or Facultative Heterochromatin. Mol. Cell. Biol. 2007;27:6457-6468. doi:10.1128/MCB.00241-07.
- Yang X, Noushmehr H, Han H, Andreu-Vieyra C, Liang G, Jones PA. Gene reactivation by 5-aza-2’-deoxycytidine-induced demethylation requires SRCAP-mediated H2A.Z insertion to establish nucleosome depleted regions. PLoS Genet. 2012;8:e1002604. doi:10.1371/journal.pgen.1002604.
- Coleman-Derr D, Zilberman D. Deposition of Histone Variant H2A.Z within Gene Bodies Regulates Responsive Genes. PLOS Genet. 2012;8:e1002988. doi:10.1371/journal.pgen.1002988.
- Guillemette B, Bataille AR, Gévry N, Adam M, Blanchette M, Robert F, Gaudreau L. Variant Histone H2A.Z Is Globally Localized to the Promoters of Inactive Yeast Genes and Regulates Nucleosome Positioning. PLoS Biol. 2005;3:e384. doi:10.1371/journal.pbio.0030384.
- Sun J, Zhou W, Kaliappan K, Nawaz Z, Slingerland JM. ERalpha phosphorylation at Y537 by Src triggers E6-AP-ERalpha binding, ERalpha ubiquitylation, promoter occupancy, and target gene expression. Mol. Endocrinol. 2012;26:1567-1577. doi:10.1210/me.2012-1140.
- Obeid J-P, Zeidan YH, Zafar N, El Hokayem J. E6-Associated Protein Dependent Estrogen Receptor Regulation of Protein Kinase A Regulatory Subunit R2A Expression in Neuroblastoma. Mol. Neurobiol. 2017. doi:10.1007/s12035-017-0449-y.
- Uribe-Lewis S, Woodfine K, Stojic L, Murrell A Molecular mechanisms of genomic imprinting and clinical implications for cancer. Expert Rev. Mol. Med. 2011;13. doi:10.1017/S1462399410001717.
- Murrell A. Genomic imprinting and cancer: from primordial germ cells to somatic cells. Sci. World J. 2006;6:1888-1910. doi:10.1100/tsw.2006.318.
- Clouaire T, Webb S, Skene P, Illingworth R, Kerr A, Andrews R, Lee JH, Skalnik D, Bird A. Cfp1 integrates both CpG content and gene activity for accurate H3K4me3 deposition in embryonic stem cells. Genes Dev. 2012;26:1714-1728. doi:10.1101/gad.194209.112.
- Margaritis T, Oreal V, Brabers N, Maestroni L, Vitaliano-Prunier A, Benschop JJ, van Hooff S, van Leenen D, Dargemont C, Géli V, et al. Two Distinct Repressive Mechanisms for Histone 3 Lysine 4 Methylation through Promoting 3′-End Antisense Transcription. PLoS Genet. 2012. doi:10.1371/journal.pgen.1002952.
- Pavri R, Zhu B, Li G, Trojer P, Mandal S, Shilatifard A, Reinberg D. Histone H2B Monoubiquitination Functions Cooperatively with FACT to Regulate Elongation by RNA Polymerase II. Cell. 2006;125:703-717. doi:10.1016/j.cell.2006.04.029.
- Krogan NJ, Dover J, Wood A, Schneider J, Heidt J, Boateng MA, Dean K, Ryan OW, Golshani A, Johnston M, et al. The Paf1 Complex Is Required for Histone H3 Methylation by COMPASS and Dot1p: Linking Transcriptional Elongation to Histone Methylation. Mol. Cell. 2003;11:721-729. doi:10.1016/S1097-2765(03)00091-1.
- Smith ST, Petruk S, Sedkov Y, Cho E, Tillib S, Canaani E, Mazo A. Modulation of heat shock gene expression by the TAC1 chromatin-modifying complex. Nat Cell Biol. 2004;6:162-167. doi:10.1038/ncb1088.
- Milne TA, Dou Y, Martin ME, Brock HW, Roeder RG, Hess JL. MLL associates specifically with a subset of transcriptionally active target genes. Proc. Natl. Acad. Sci. United States Am. 2005;102:14765-14770. doi:10.1073/pnas.0503630102.
- Lee J-H, Skalnik DG. Wdr82 Is a C-Terminal Domain-Binding Protein That Recruits the Setd1A Histone H3-Lys4 Methyltransferase Complex to Transcription Start Sites of Transcribed Human Genes. Mol. Cell. Biol. 2008;28:609-618. doi:10.1128/MCB.01356-07.
- Ding Y, Avramova Z, Fromm M. Two Distinct Roles of ARABIDOPSIS HOMOLOG OF TRITHORAX1 (ATX1) at Promoters and within Transcribed Regions of ATX1-Regulated Genes. Plant Cell. 2011;23:350-363. doi:10.1105/tpc.110.080150.
- Bolger AM, Lohse M, Usadel B. Trimmomatic: a flexible trimmer for Illumina sequence data. Bioinformatics. 2014;30.15:2114-2120.
- Guo W, Fiziev P, Yan W, Cokus S, Sun X, Zhang MQ, Chen PY1, Pellegrini M. BS-Seeker2: a versatile aligning pipeline for bisulfite sequencing data. BMC Genomics. 2013;14:774. doi:10.1186/1471-2164-14-774.
- Feng H, Conneely KN, Wu H. A Bayesian hierarchical model to detect differentially methylated loci from single nucleotide resolution sequencing data. Nucleic Acids Res. 2014;42:e69−e69. doi:10.1093/nar/gku154.
- Hansen KD, Sabunciyan S, Langmead B, Nagy N, Curley R, Klein G, Klein E, Salamon D, Feinberg AP. Large-scale hypomethylated blocks associated with Epstein-Barr virus–induced B-cell immortalization. Genome Res. 2014;24:177-184. doi:10.1101/gr.157743.113.
- Kim D, Pertea G, Trapnell C, Pimentel H, Kelley R, Salzberg SL. TopHat2: accurate alignment of transcriptomes in the presence of insertions, deletions and gene fusions. Genome Biol. 2013;14:R36−R36. doi:10.1186/gb-2013-14-4-r36.
- Robinson MD, McCarthy DJ, Smyth GK. edgeR: a Bioconductor package for differential expression analysis of digital gene expression data. Bioinformatics. 2010;26:139-140. doi:10.1093/bioinformatics/btp616.
- McCarthy DJ, Chen Y, Smyth GK. Differential expression analysis of multifactor RNA-Seq experiments with respect to biological variation. Nucleic Acids Res. 2012;gks042.
- Langmead B, Salzberg SL. Fast gapped-read alignment with Bowtie 2. Nat Meth. 2012;9:357-359. doi:10.1038/nmeth.1923.
- Zhang Y, Liu T, Meyer CA, Eeckhoute J, Johnson DS, Bernstein BE, Nusbaum C, Myers RM, Brown M, Li W, et al. Model-based analysis of ChIP-Seq (MACS). Genome Biol 2008. 2008;9 (9): R137. doi:10.1186/gb-2008-9-9-r137.
- McLean CY, Bristor D, Hiller M, Clarke SL, Schaar BT, Lowe CB, Wenger AM, Bejerano G. GREAT improves functional interpretation of cis-regulatory regions. Nat. Biotechnol. 2010;28:495-501. doi:10.1038/nbt.1630.
- Chen EY, Tan CM, Kou Y, Duan Q, Wang Z, Meirelles GV, Clark NR, Ma'ayan A. Enrichr: interactive and collaborative HTML5 gene list enrichment analysis tool. BMC Bioinformatics. 2013;14:128. doi:10.1186/1471-2105-14-128.
- Kuleshov MV, Jones MR, Rouillard AD, Fernandez NF, Duan Q, Wang Z, Koplev S, Jenkins SL, Jagodnik KM, Lachmann A, et al. Enrichr: a comprehensive gene set enrichment analysis web server 2016 update. Nucleic Acids Res. 2016;44:W90−W97. doi:10.1093/nar/gkw377.