
ABSTRACT
Epigenome-wide association studies (EWAS) have focused primarily on DNA methylation as a chemically stable and functional epigenetic modification. However, the stability and accuracy of the measurement of methylation in different tissues and extraction types is still being actively studied, and the longitudinal stability of DNA methylation in commonly studied peripheral tissues is of great interest. Here, we used data from two studies, three tissue types, and multiple time points to assess the stability of DNA methylation measured with the Illumina Infinium HumanMethylation450 BeadChip array. Redundancy analysis enabled visual assessment of agreement of replicate samples overall and showed good agreement after removing effects of tissue type, age, and sex. At the probe level, analysis of variance contrasts separating technical and biological replicates clearly showed better agreement between technical replicates versus longitudinal samples, and suggested increased stability for buccal cells versus blood or blood spots. Intraclass correlations (ICCs) demonstrated that inter-individual variability is of similar magnitude to within-sample variability at many probes; however, as inter-individual variability increased, so did ICC. Furthermore, we were able to demonstrate decreasing agreement in methylation levels with time, despite a maximal sampling interval of only 576 days. Finally, at 6 popular candidate genes, there was a large range of stability across probes. Our findings highlight important sources of technical and biological variation in DNA methylation across different tissues over time. These data will help to inform longitudinal sampling strategies of future EWAS.
Introduction
Advances in DNA methylation profiling technology have facilitated a new wave of genome-wide association studies of DNA methylation (EWAS). These studies provide novel insights on the role of DNA methylation in healthy aging [Citation1–3] and disease [Citation4,Citation5]. Although there is consensus among researchers that it is ideal to study the most-involved tissues for a trait of interest (e.g., to study kidney biopsy tissue for kidney disease), it may not be feasible to obtain these tissues. Among easily-accessible tissues, such as buccal cells or existing stored blood spots, there remains considerable debate about the choice of tissue for EWAS [Citation6–8], due in part to our limited understanding of cross-tissue concordance and intra-individual stability of DNA methylation over time.
The present study was undertaken to evaluate the stability of DNA methylation data in commonly available tissues, as assessed by the Illumina Infinium HumanMethylation450 BeadChip (450K array), which provides quantitative measures of DNA methylation at approximately 480,000 CpGs across the genome [Citation9]. A stable probe, here, is defined as a probe where the estimated methylation level is extremely consistent across replicate measurements. We were interested in understanding which of the commonly available tissues for measuring DNA methylation should be preferred, based on measures of stability. However, the idea of a stable measurement of methylation requires context: if a sample is split and analyzed twice, then evidently it would be desirable to obtain estimates of methylation that are extremely similar across such technical replicates, since one assumes the methylation level being measured is the same, and any differences that arise are due to the precision of the probe. An unstable probe would be one where it is difficult to obtain a consistent estimate of the methylation level across the technical replicates even after the best available normalization. In contrast, if repeated samples are taken at different times from the same person, one might expect the true methylation levels to be similar if a small time interval separates the two sample extractions, but one might tolerate increasing heterogeneity between samples as the time interval between samplings increases, or if there was a change in exposure or phenotypic state between samplings. Here, variability is assumed to be due to variation in the true methylation levels rather than variation in the measurement method. For a precise probe, large variability between repeated samplings implies dynamism in methylation levels.
We used two measures to evaluate probe stability. First, we calculated intraclass correlation coefficients (ICCs), the most commonly used measure for assessing agreement. To complement these results based on the ICC, we also calculated contrasts of interest between replicates and calculated F-statistics comparing mean squared deviations.
There have been several studies of the technical variability of measures of DNA methylation as measured by the 450K array, and most have used ICC values to assess agreement. Leukocytes have often been used to assess methylation replicability (see Citationrefs. [10]) (130 individuals), [Citation11] (10 replicate pairs in a larger data set), and [Citation12] (n = 24). Dried blood spots (DBS) and peripheral blood mononuclear cells (PBMC) have also been compared [Citation13], and in this study, there were large sample sizes in both tissues and for both technical replicates (n = 136 DBS; n = 126 PBMC) and repeated samplings from individuals (n = 769 DBS; n = 280 PBMC). All previous studies found a wide range of ICCs with many probes demonstrating low values. There seems to be only limited study of comparisons of the stability of DNA methylation. Only a few papers have examined the effects of storage time and duration, and these papers examined small numbers of samples, different tissue types, and reached differing conclusions [Citation14–Citation17]. Only one of these papers looked at dried blood spots [Citation15].
We also assessed stability with regard to likely sources of technical or biological variation, such as experimental design (e.g., batch effects) or longitudinal sampling (e.g., age effects). We then extended these stability analyses to salient features of the DNA methylome, including epigenetic age, a phenotype representative of biological age, as it has been associated with a range of adverse health outcomes in several studies [Citation1–3]. Studies spanning several months have also been performed in leukocytes [Citation12,Citation18]. The former studies used ICC as a measure of agreement over a 9 month interval and the latter ones examined correlations between repeated samplings. Agreement in buccal cells has been examined in twins followed from birth to 18 months [Citation19].
Our work examines agreement in two independent sample sets and, in contrast to previous studies, includes a large number of buccal samples with technical replicates as well as DBS and leukocytes from whole-blood. In the first data set (Dutch data—see Methods), several assessments of DNA methylation concordance were performed: across tissues (buccal epithelial cells, finger-prick dried blood spots, and whole-blood samples), technical replicates (the same biological sample divided and analyzed separately), biological replicates (repeated samplings of the same tissue), and a range of elapsed time intervals. The complexity and richness of this study design enabled us to take a broad look at the stability of DNA methylation. In the second data set (Canadian data—see Methods), we had more technical and biological replicates in only one tissue (buccal cells). In addition to providing useful information on stability across tissues and time, this study demonstrates the use of a range of methods for assessing agreement, which can provide insightful perspectives on the distributions of agreement in large data sets.
Therefore, in this study we investigate stability or “agreement” across technical and biological replicates of DNA methylation estimates from the Illumina 450K array, and focus particularly on whether we can identify probes with little technical replicability but interesting variability across repeated samplings or biological replicates. Although our datasets are smaller than others, we have a rich set of tissues and replicate comparisons. We also examine in detail the DNA methylation patterns across individuals at six candidate genes that are the focus of many epigenetic studies in human psychology and psychiatry: OXTR, [Citation20,Citation21] DRD2, [Citation22] DRD4, [Citation23] COMT, [Citation24] BDNF, [Citation25] and SLC6A4 (alias HTTLPR) [Citation26,Citation27].
Results
Stability or agreement at the sample level in our two datasets
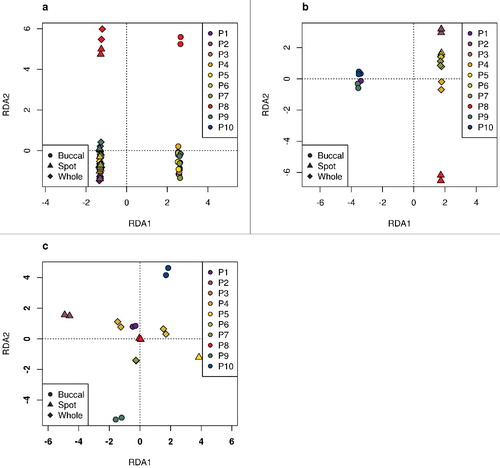
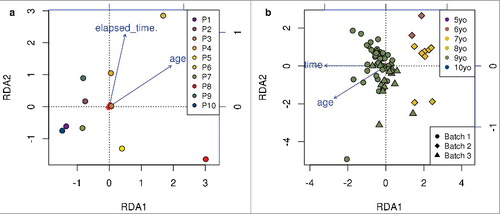
For the Dutch data, methylation was measured in 10 individuals from 3 tissues (whole-blood, blood spots, and buccal cells), with a combination of technical replicates and repeated samplings across 1–4 week intervals (, see also Methods). A global perspective on agreement between replicates can be obtained through summarizing the methylation profiles with a linear projection tool, such as principal component analysis, guided principal component analysis, [Citation28] or canonical redundancy analysis (RDA) [Citation29]. The latter method, for a series of specified covariates or factors, estimates the proportion of variability explained by each factor relative to all covariates included in the model, and also allows the effects of some covariates to be removed (adjusted for) prior to the examination of others. shows the results of RDA using random samples of 100,000 probes in these data, for both biological replicates (panel a) and technical replicates (panel b). The first component (RDA1) separates buccal cells from whole-blood and blood spots (a and b). Individual #8 is male, and RDA2 clearly separates the samples for individual #8 from the others. Nevertheless, the first two axes of the RDA projections show that the replicates are closer to each other than to samples from other individuals, and that the technical replicates are closer to each other than to the biological replicates. In panel c, the effects of tissue type and sex are removed and the technical replicate agreement is re-examined, thereby clearly showing the strong similarity between the technical replicates.
Table 1. Layout of Dutch study design. All participants except P8 were female.
Figure 1. RDA results in the Dutch data. Based on a random sample of 100,000 probes. The symbols represent the different tissue types and the colors differentiate the 10 individuals. a. Biological replicates: repeated samplings from the same individuals. b. Technical replicates. c. Technical replicates, where RDA analysis has been adjusted for tissue type and sex. The only male in the sample is patient 8 (P8) represented in red.
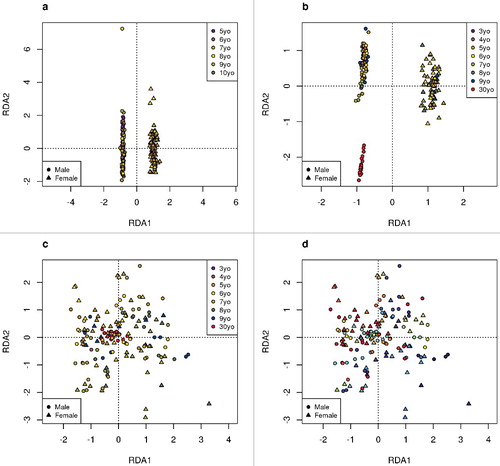
Similarly, in the samples from the Canadian study, 37 males and 30 females are clearly separated in (panels a and b using an independent random sample of 100,000 probes). All participants gave buccal swabs, so here the most important axis of variation, RDA1, captures differences associated with sex. In addition to the children recruited to the MAVAN study, one male adult individual (age: ∼30 years) contributed DNA for our analysis of reproducibility, and his distinct DNA methylation profiles are captured by RDA2 in , panel b. Subtle trends within the children are also associated with age in both panels a and b. The methylation samples in the Canadian study were sent for processing at three different times, and we refer to the sets of samples analyzed simultaneously as “batches.” There was no evidence of batch effects in the RDA plots (data not shown). Panels c and d of have been adjusted for age and sex. In panel c, it is clear that these covariates no longer cluster the samples. In panel d, replicate samples from the same individual are given the same color, and it can be seen that the replicates cluster well. Quality metrics for all samples were good (e.g., probe call rate >95%); yet, the proportion of epithelial buccal cells did vary somewhat across samples (median 84%, range 68% to 95%). The yellow circle at the top of a had the lowest proportion of epithelial buccal cells (68%); however, there were other samples with proportions in the low 70% range that do not appear to be outliers. The data were adjusted for cell type mixture variability prior to analysis (see Methods).
Figure 2. RDA analysis of Canadian study. Based on a random sample of 100,000 probes. The symbols represent the sex and colors represent the age. a. Biological replicates. b. Technical replicates. c. and d. Technical replicates, where RDA analysis has been adjusted for age and sex. In c, colored by age and in d, colored by individual. (Two samples originating from the same tissue samples of an individual will be of the same color in d).
Through RDA, the improvements in signal to noise associated with normalization and cell type mixture adjustments can be clearly seen (Supplemental Figures S1 – S4 and Supplemental Table S1). For example, the total variance in the data is reduced by about 50% relative to the raw data, and the constrained proportion of variance, i.e., the proportion of variance explained by the covariates of interest, increases importantly. For example, in the Canadian data for biological replicates, the constrained proportion increases from 59% in the raw data to 81% after normalization and cell type mixture adjustments (Table S1).
Agreement in estimates of methylation across replicates using ICC
To study probe-level agreement between replicates, intraclass correlations (ICC) are a natural choice since for a chosen grouping definition, they compare agreement by comparing between replicate group variability to within replicate group variability. We calculated ICC values for each probe, comparing samples from the same individual to samples from different individuals. In sub-analyses, we looked at tissue types separately or in combination, and we compared technical and biological replicates. shows ICC distributions for the Dutch data for various tissues and combinations of tissues. Sample sizes are very small for some ICC calculations, since for technical replicates only 3 individuals contribute to each tissue-specific analysis. Nevertheless, shows that for any tissue type or replicate type, there is a range of ICC values between zero and one, with most probes having low values.
Figure 3. Distributions of intraclass correlations in the Dutch data. For different tissue types, combinations of tissue types, and for biological versus technical replicates, based on a random sample of 100,000 probes selected from 449,059 probes where the maximum methylation level was lower than 0.9 and the minimum methylation level was higher than 0.1.
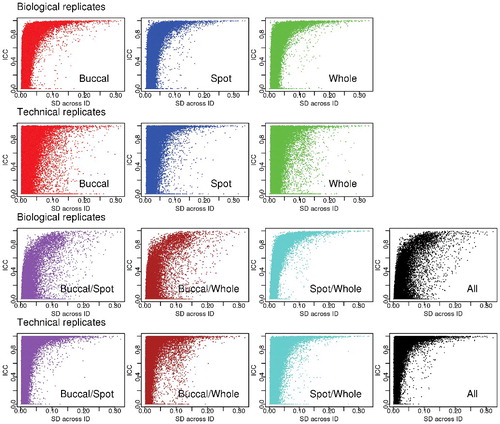
For both the Dutch and Canadian studies, in , we have summarized the proportion of probes with high values of ICC (>0.7) both overall and among those where the standard deviation is large (>0.1, >0.2). High ICC values are usually seen when the probes are highly variable, i.e., when the standard deviation (SD) across the samples is large. In such situations, ICC values can be very close to 1.0. In contrast, when probes display little inter-sample variability, then the inter-sample differences between DNA methylation levels approach the magnitude of background variability. In fact, such non-variable probes usually have methylation levels near zero or one, and they can form a large proportion of the CpG sites assayed in several different tissues [Citation30]. Arguably, these probes are not interesting for further study if there is no variability in methylation levels. Therefore, we propose that it makes most sense to study the probe stability among subsets of probes with large inter-sample SDs. This filter based on SD is conceptually similar to the filter used by Edgar et al., [Citation30] although they define variability as a percentage change in methylation levels.
demonstrates that ICC values are substantially higher in the limited subsets of probes with large SD, but these comprise a tiny percentage of all probes (between 1% to 2%). In the Dutch data, the technical replicate ICC for probes with SD>0.1 is substantially higher for blood spots than for buccal cells or whole-blood; however, this comparison is based on only 3 pairs of each tissue type. For biological replicates within a tissue type, the majority of probes (over 95%) have ICC values over 0.7 when SD>0.1 in both the Canadian and Dutch studies. When we analyzed different tissues together, the percentage of ICC values greater than 0.7 is reduced; inter-tissue methylation differences are to be expected.
The last column of focuses particularly on probes where the mean methylation level is in the middle of the range—i.e., probes where the mean beta value lies between the 25th and 75th percentiles of the distribution of the average betas. These probes with intermediate levels of DNA methylation might be of particular interest for transcription factor mediated remodeling of the DNA methylome, e.g., Stadler et al., [Citation31] a plausible mechanism to explain environmental influences on the epigenome [Citation32]. Here, we see substantially more agreement in technical replicates than biological replicates. Furthermore, in the Dutch study, there is more agreement among biological replicates for buccal cells than for whole-blood or blood spots. This may be due to less variation in cell type mixtures across samplings.
By restricting our attention to probes with large inter-individual standard deviations, or to those with mean methylation levels in the 25th to 75th percentile, we are essentially focusing on variable probes. We performed similar analyses excluding the probes called “invariant” by Edgar et al. [Citation30] for whole-blood and buccal cells. In the Dutch study, we excluded the intersection of the invariant probes for whole-blood and buccal cells (excluding 72,981 probes), and in the Canadian study we excluded all the invariant probes for buccal cells (excluding 120,009 probes). ICC distributions were very similar to those seen in and , although slightly higher, as would be expected (Supplement Figure S5 and Table S2).
Technical replicate stability versus biological replicate variability using contrasts
and demonstrate the challenges associated with obtaining extremely precise measures of methylation levels that are also variable across different samples using this technology. To further explore the relationships between technical, biological, and inter-sample variability at the probe level, we constructed contrasts of interest across replicates within each study participant (see Methods). The resulting sums of squared differences were normalized and transformed into F-statistics using the residual error from complete ANOVA models containing terms for all individuals and replicate types (see Methods section for more details on the ANOVA models). This strategy allowed us to obtain F-statistics without requiring the direction of change to be consistent across individuals.
Smoothed histograms of these F-statistics are shown in for the two studies. Technical replicates are clearly more in agreement than biological replicates (the F-distributions are shifted to the left); for example, a paired Wilcoxon signed-rank test for the 485,512 probes gives P<2.2e-16 for smaller values from whole-blood technical replicates in the Dutch study. Buccal cells from the Dutch study look more stable than the other cell types. Results were essentially indistinguishable when over 100,000 probes with poor quality characteristics or those located on X-Y chromosomes were removed (see Methods, data not shown).
Figure 4. Summary smoothed histograms of F-statistics by replicate type. An F statistic was constructed for each methylation probe and each type of replicate using carefully constructed contrasts (see Methods section for more details). The null hypothesis for each F statistic is that the within-sample, between replicate differences in methylation demonstrate no excess variability. a. Dutch study. b. Canadian study.
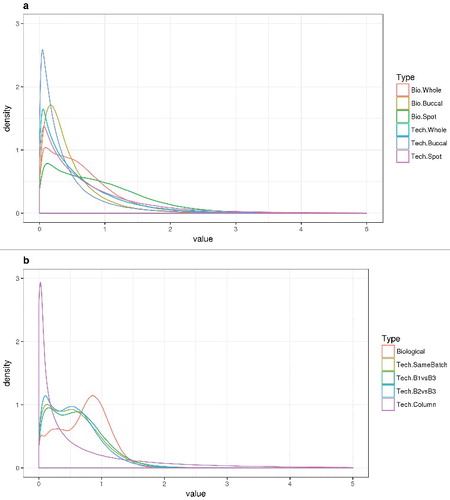
In the Canadian study, the technical replicate agreement along a column on a single chip is dramatically better (the F-distributions are shifted to the left) than any of the other comparisons; this specific contrast was constructed from technical replicates from a single (adult) sample. This sample was split in twenty parts and distributed on 20 chips, all analyzed in the same batch. All positions on the chip were covered (some twice and some only once). We tested the null hypothesis of no linear trend across the rows of the chip. Such trends have been previously demonstrated [Citation33]. In contrast, technical replicates in the same batch are relatively comparable to technical replicates in different batches. Agreement between biological replicates is visibly reduced (shifted to the right) compared to agreement between technical replicates in the Canadian study.
If a probe cannot measure methylation precisely, hence producing unstable results, it should show poor technical replicate agreement in more than one tissue or type of replicate. Since the F-statistic contrasts were constructed to be orthogonal, we used Fisher's method to combine corresponding P values across contrasts, to obtain probe-level P values assessing stability. For the Dutch study, we examined the overlap in probes showing evidence of poor replicability via significant P values (P<0.05) across the three tissues, for technical replicates (a). For the Canadian study, b displays a similar Venn diagram of overlap between probes demonstrating instability within or between batches across technical replicates. Using log linear analysis, the amount of overlap seen in is substantially more than expected under independence (estimated P value = exp−589.71 for the Dutch study and P = exp−991.97 for the Canadian study). We also used Kolmogorov-Smirnov tests to compare the distribution of P values between the overlapping probes and other significant probes from the same tissue. Most of the distributions of P values are not significantly different, except for the P values from whole-blood, where P values of the probes that were significant across all three tissues types tend to be smaller than the P values of the probes that were significant for whole-blood. (Supplementary Figure S6 and Table S3).
Figure 5. Venn diagram of overlap between probes demonstrating instability. Number of probes showing evidence of poor replicability via significant P values (P<0.05) a. across the three tissues for the technical replicates of the Dutch study. b. within or between batches of the technical replicates from the Canadian study.
To identify probes with good technical replicate stability and yet large biological replicate variability, we filtered probes to retain only those with technical replicate F-statistics less than 1.0 in the Dutch study. For buccal cells, 49,430 probes were removed, 93,053 for whole-blood, and 124,398 for blood spots. Supplementary Figure S7 shows smoothed histograms of the biological replicate F-statistics after applying this filter, and in fact there is little difference in the distribution of F-statistics. We also repeated this analysis after removing the invariant probes presented by Edgar et al. (2017) [Citation30], and results were, again, very similar (Supplement Figures S8 and S9).
The effects of inter-sampling time of DNA methylation within a single tissue
Using our ANOVA-based approach, we examined the F-statistics associated with each probe as a function of the elapsed time between samplings within a single tissue. In the Dutch study, there is a range of times between repeated samplings only for whole-blood () and, therefore, our analyses are restricted to this tissue. These biological replicates were sampled between 7 and 28 days apart, and we saw no relationship with time within a tissue type (a). However, in the Canadian study's buccal cell replicates, the variability of the 75th percentile of the ANOVA sums of squares (across all probes) increased at longer time intervals (b) and there were several individuals sampled up to 576 days apart with a notable increase in variability between replicates.
Figure 6. Association between sums of squares and elapsed time. For each individual in the Dutch study (a) or the Canadian study (b), the 75th percentile, across all probes, of the sums of squares measuring agreement is shown as a function of the time elapsed between the biological replicates. Note that we only used whole-blood samples in the Dutch study, since it was the only tissue for which there was a range of elapsed times between repeated samplings.
Across all probes, RDA analysis () shows the strongest correlation between age and elapsed time effects on methylation levels. Although speculative, it appears that the effects of age or time in the Canadian study are associated with batch, such that several batch 2 samples are separated along RDA1. The children analyzed in batch 2 have comparable ages to those sampled for other batches. However, the time elapsed between repeated samplings is shorter for comparisons between batch 2 and 3. Average elapsed times between sampling for biological replicates was 504 days for children assessed in batches 1 and 3, 320 days for those assessed in batches 2 and 3, and 477 days for children whose repeated samplings were both in batch 3.
Figure 7. RDA analysis of elapsed time among biological replicates based on random sample of 100,000 probes. a. Dutch study; b. Canadian study. We are looking at the difference in DNA methylation between two samples from an individual (taken at two different time points), therefore there is only one point per individual. For panel b, we have colored the individuals based on their age at the second time point. The shape of the symbol in panel b represents the batch corresponding to first time point (since all samples for the second time point were collected in the third batch of analyzed samples).
In the Dutch study, there were approximately 18 months between sampling with blood spots versus whole-blood. After combining these two blood preparations and then calculating ICCs, the percentage of probes with ICC>0.7 was 97.7% of probes with SD>0.1, 14.96% of probes with means in the inter-quartile range, and 8.5% of all probes. These values are very similar to those in for either whole-blood or buccal cells when calculated separately, indicating comparable agreement despite the change in sample preparation and the elapsed time.
We examined the overlap between probes showing significant results in the linear regressions for elapsed time and the probes identified by Horvath [Citation3] as being associated with age. The epigenetic clock is a cross-tissue predictor of biological age that has been associated with a range of health outcomes. Out of 4249 sites associated with time between samples (P<0.01) in the Canadian data, there were only 3 probes in common with Horvath's 353 age-sensitive probes (P value = 1.0 for Fisher's exact test of independence). However, the interval for all longitudinal samples collected within the Canadian study falls within the standard error (SE) of the epigenetic clock predictor (3.6 years). In line with this, in the Dutch study we found no significant differences in epigenetic age or age acceleration with longitudinal whole-blood, dried blood spot, or buccal samples. There was a significant correlation between estimates of age acceleration, as assessed in both whole-blood and dried blood spots (r≥0.693, P = 6.995e-4). In contrast, the correlation between epigenetic age acceleration as determined in buccal cells was not as strongly or significantly correlated with age acceleration measures determined in dried blood spots (r≤0.468, P = 0.0372) or whole-blood (r≤0.513, P = 0.0207). This is not surprising since Horvath used whole-blood in developing his predictor. Note that here we defined age acceleration as the residuals from a linear model of DNA methylation age regressed on chronological age (as suggested by Horvath in the FAQ of his online age calculator [Citation3]). Furthermore, correlations between chronological age and epigenetic age were high for all three tissues (0.92 for buccal samples, 0.94 for blood spots, and 0.95 for whole-blood).
Variability of candidate gene DNA methylation across individuals (OXTR, DRD2, DRD4, COMT, BDNF, and SLC6A4—alias HTTLPR)
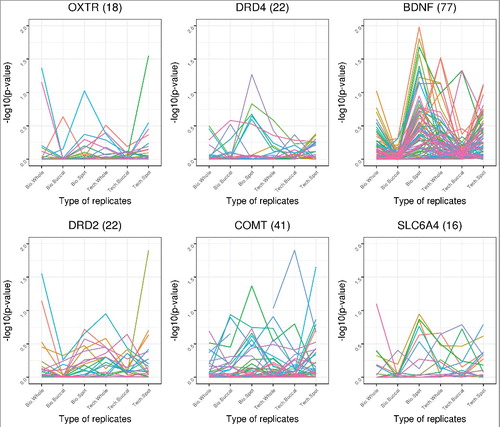
shows the –log10 P values from the F-statistics for variability across probes in 6 candidate genes, for different tissues and replicate types. In this Figure, highly replicable probes are associated with small values on the Y-axis. At some genes, such as DRD4 or SLC6AC, almost all F-statistics for variability (all probes, all tissues, both technical and biological replicates) are under 1.0, indicating good replicability. In contrast, at BDNF, there are many probes that show poor agreement between biological replicates from blood spots.
Figure 8. Replicate agreement at 6 candidate genes in the Dutch study. Agreement is shown by -log10 P values derived from F-statistic measures of variability at 6 candidate genes. Each color represents a different probe in the candidate gene. The number of probes present in a gene is indicated in parenthesis beside the name of the gene. Different types of replicates or tissues are indicated along the X-axis.
Discussion
The present study assessed agreement between replicates in Illumina 450K array methylation data across tissues, time, batches, and in both technical and biological replicates. We found expected relationships, such as more agreement for technical than biological replicates, and more agreement within, rather than between, batches. Results did not vary much by tissue type, although there appeared to be a small increase in biological stability for buccal samples. These results could suggest that buccal cells may be a useful tissue to study variability in DNA methylation. In sensitivity analyses (see Methods), we repeated all analyses after excluding over 100,000 probes with poor quality characteristics or with DNA methylation levels near either zero or one, and found very similar results. The number of technical replicates available in one of our two studies (the Dutch study) was small; estimates of stability would be improved by repeating this work in larger samples, and in the more recent EPIC array from Illumina.
The ICC measure was developed to measure inter-rater agreement with any number of raters. The ICCs in span the entire range between zero and one across probes, with many probes showing ICC values near zero. Not surprisingly, when a probe has very little variability in DNA methylation level across individuals or across time, it is difficult to achieve a high ICC, since the inter-individual variability is of the same order of magnitude as the error in measurement. Among probes with more variability across individuals, the ICC values are much higher. As has been recommended by others (see Citationrefs. [10, Citation13, and Citation30]), it can be beneficial to restrict analysis to only probes where the true methylation levels are variable, since the burden of multiple testing will be reduced. However, when we excluded either probes showing very poor technical stability or probes identified as invariant [Citation30], our results changed only minimally.
ICC estimates are also strongly influenced by the estimates of residual variability used in their calculations, and these can be affected by experimental factors such as batch and chip (see for example Citationref. [13]). Here, we have examined agreement between methylation levels across tissues and replicate types after use of a common normalization strategy and adjustments for cell type mixture to evaluate probe stability after realistic data preprocessing steps.
In our analyses, we have used two ways of assessing probe stability. Comparing these results provides the opportunity for more sensitive or nuanced assessments of variability. Through the use of the statistical F distribution, we could obtain P values for instability for each probe. Furthermore, by careful construction of our contrasts, results could be combined across orthogonal comparisons to get a single measure of probe instability incorporating several aspects, such as different batch comparisons, different tissue types, or different contrasts. These F-statistics give a more optimistic view of the agreement than the ICCs, since most of the F-statistics are very small, indicating good agreement relative to background noise. Nevertheless, shifts in the distributions indicate that many probes are subtly altered between replicates of different types.
When examining which probes are most susceptible to change with time, the age of the participants is correlated with the elapsed time. In the Dutch study, where samples from the same tissue were taken only a maximum of 28 days apart, the effects of age on DNA methylation may be expected to have less correlation with elapsed time than in the Canadian study. In support of this hypothesis, in a (the Dutch study), the second RDA component is strongly correlated with elapsed time, whereas in b (the Canadian study), elapsed time has a larger contribution to variability and hence is associated with RDA1. Also in line with our expectations, elapsed time and age appear to be less associated in the Dutch study (based on the wider angle between the projection arrows in a versus 7b). These trends were captured through analysis of 100,000 probes. Our individual probe analyses did not identify specific probes showing sensitivity to time.
The RDA linear projection analysis method leads to excellent graphical displays for identifying outliers or samples that are not behaving as expected. In c, the RDA analysis of technical replicates where tissue type and sex have been subsumed (adjusted for) prior to calculating the projections, RDA2 delineates samples from P9 and P10. In fact, P10 was pregnant at the time of her DNA extraction contributing to this analysis. Within RDA, the ability to adjust for factors having known strong effects not of primary interest (here for example, tissue type and sex) means that factors with subtle effects may be easier to visualize.
As many others have observed, substantial batch effects can be seen in data from the Illumina 450K array, even after implementing an initial normalization step [Citation34]. Many studies incorporate into their analytic pipelines complex, multi-step adjustments for residual unexplained variability in the DNA methylation distributions (see Citationrefs. [35,Citation36]). These strategies would not be appropriate here, given our sample sizes, but also since we are explicitly studying agreement across replicates rather than examining associations with a phenotype. Nevertheless, there is always the risk that the incorporation of many additional covariates into models, to capture non-specific confounding, will also remove some of the signals that are of interest. As is well known, the best approach for eliminating confounding due to batch effects is to implement an excellent study design upfront, where samples are allocated either randomly or in a balanced way across batches and chips.
It is worth speculating on reasons for observing an unstable probe, i.e., a probe with poor precision of measurement. Several types of poorly-performing probes have been highlighted: for example, probes where there are SNPs in the probe binding region are often excluded from consideration, [Citation37] as are probes demonstrating non-specific probe binding. Both situations make it more difficult to interpret any results. Probes may also be removed from analysis when the methylation levels are not variable across individuals—methylation is always zero or one. Probe reliability has been associated with genomic features such as shores and islands, although this association may be confounded by the variability across individuals [Citation10,Citation13]. We were curious whether there could be additional poorly-performing probes, that give inconsistent estimates of methylation (after normalization) for unknown reasons; these probes would be expected to show poor technical replicability in multiple tissues. In the samples analyzed here, three different methods were used for extraction of DNA; the method of extraction has been shown to have an influence on the precision of the methylation estimates [Citation38]. There is also the possibility that some aspects of the probe design give rise to less reliable results. Therefore, further studies of the stability of measures of methylation measures, whether across tissues, across DNA extractions, or by comparing probe characteristics after adjusting for inter-sample variability, are warranted.
Methods
Studies, participants, and samples
Data were drawn from two studies:
| (1) | The Dutch study was conducted in the Netherlands and is part of the Leiden Consortium Individual Development (L-CID). DNA methylation was measured in 10 healthy individuals (9 females, 1 male) who contributed 2–3 samples of each of whole-blood, buccal swab, and dried blood spots [Citation39]. Written informed consent was obtained for all participants and the study was performed in accordance with the Helsinki Declaration of 1975. The study included a total of 69 samples, 23 from each tissue type. Technical replicates were created by splitting a single extraction into two aliquots for analysis on the 450K arrays. For each tissue type, there were 3 pairs of technical replicates in the data (i.e., 3 individuals contributed a sample that was split for a technical replicate analysis). No individual contributed technical replicates for more than one tissue type (). Repeated samplings from the same individual were taken between 1 and 4 weeks apart. The plating scheme is provided in Supplement Figure S10. | ||||
| (2) | The second set of replicate measurements, from Canada, includes 93 of the children participating in the Maternal Adversity, Vulnerability and Neurodevelopment (MAVAN) study [Citation40]. Ethical approval for biosampling and molecular analyses was provided by the Douglas Hospital Research Institute's Institutional Review Board and written informed consent was obtained from their parent or legal guardian. All samples taken from the participants in this study are buccal swabs. Some samples were taken from the same child at different ages; these replicates were henceforth referred to as “biological replicates.” The number of days between the samplings varied from 265 days to 576 days (median 498). Three different sets of samples were sent for methylation profiling at different times, referred to as batch B1, B2, and B3. The 45 samples from batch B1 were run in February 2012, the 33 samples from batch B2 in January 2013, and the 173 samples from batch B3 in December 2013. Note that in this manuscript, we use “batch” to describe these sets of samples, and not Illumina production batches. A large set of technical replicates were also assayed, where a single sample was split in two and analyzed, sometimes in the same batch, and sometimes in a different batch. In total, there were replicate samples for 93 individuals from the MAVAN study, consisting of between 2 and 4 replicates per individual. In addition, one adult male contributed 20 technical replicate samples to the third batch (B3) (). The number of samples per batch and per type of replicate can be found in Supplement Table S4. Table 2. Characteristics of the Canadian study, buccal samples Table 3. ICC summary statistics for both studies, overall and in subgroups defined by either standard deviation (SD) or mean DNA methylation level. | ||||
Extraction, storage, Illumina 450K array analysis
Genomic DNA (gDNA) was extracted from dried blood spots using the Gensolve DNA recovery kit (IntegenX) and purified using the QiaAmp DNA micro kit (Qiagen). Buccal swabs samples were extracted using the Masterpure system (Epicentre, USA) and whole-blood samples were extracted using Chemagic DNA Blood Kit (Perkin Elmer). gDNA purity and concentration was assessed using a NanoPhotometer P300 (Implen, Germany). gDNA (750 ng) was bisulfite converted using the EZ-DNA Methylation Kit (Zymo Research, USA) and 160 ng of bisulfite-converted DNA was isothermally amplified at 37°C for 22 h, enzymatically fragmented, purified, and hybridized on the Infinium 450K array (Illumina, USA) [Citation9].
Quality evaluation
First, based on Illumina's recommendations, we evaluated the quality at different steps of the experiment by examining the control probes for bisulfite conversion, dye bias, extension and hybridization probes, non-polymorphic and negative controls, specificity for type I or II probes, staining and target removal step, and summarizing this information into a quality score. From the original IDAT file datasets, one Dutch sample was excluded from the analysis (sample_name: “10005833147_R05C02”) and two Canadian samples were excluded (WG0014691_9407201099_R04C01 and WG0014729_9388306122_R02C01).
Normalization and transformations
We used funtooNorm [Citation39] to normalize the methylation data and to remove technical biases due to batch, chip, and position while retaining inter-tissue differences. This is partially because our data sets were small, but primarily because our goal was to assess agreement prior to introducing any widespread alignments that could affect signal as well as noise.
Both the blood and buccal samples contain mixed cell types, but the component cell types and mixture proportions differ substantially between the two tissues. Therefore, we performed cell-type mixture adjustment for the whole-blood and blood spot samples using Houseman's reference-based method [Citation41]. For the buccal samples, we used Surrogate Variable Analysis, which has been shown to be the best-performing method across a range of situations [Citation42,Citation43]. DNA methylation values (after cell type mixture adjustment) were shrunk slightly away from the boundaries using the formula [(99)*B+0.5]/100 to avoid values too close to zero or one.
Quality filtering
In the Dutch data, only 0.257% of the probes have detection P values greater than 0.01 in at least 10% of the samples, and a very similar value (0.220%) was seen in the Canadian data. Since only a small number of probes would therefore be assumed to have poor quality signals, our primary analysis includes all probes. However, a sensitivity analysis was performed excluding probes for either quality or variability. In the Dutch data, 59,104 probes were removed due to detection P values (>0.01 in more than 10% of the samples), bead counts (less than 3 beads per signal in at least 10% of the samples), and mean methylation levels (mean methylation level-2 standard deviations >0.9 or mean methylation level+2 standard deviation <0.1 was between 0.1 and 0.9). In the Canadian data, 82,211 probes were removed (we did not have the bead count information; the other 2 criteria were identical).
Analyses
We calculated intraclass correlations (ICCs) by fitting random effect models where the agreement within or between individuals was distinguished between tissues (in the Dutch data) or between batches (for the Canadian data). In order to calculate the ICCs, we fit random effect models with the individual ID as the random effect. In the case of exactly two replicates per person (e.g., the technical replicates), this calculation is equivalent to what is known as ICC1 (single raters absolute) from Shrout and Fleiss [Citation44]. The random effect method for calculating ICCs is generalizable when the number of replicates is not the same across all individuals. Any negative variance component estimates were set equal to zero. For graphical purposes in , the ICC values are plotted only for a subset of 100,000 probes. These were randomly selected from the probes where the minimum methylation level (across samples) was greater than 0.1 and the maximum methylation level was less than 0.9.
We also performed analyses of variance with carefully constructed contrasts to examine which probes were more variable in which replicate types, tissue types, or batch types (depending on the study design). A contrast is a linear combination of variables for which the sum of the coefficients is zero and which is designed to highlight a particular comparison between samples. Here, we compare the methylation levels between samples from the same individual, focusing on whether the samples represent biological or technical replicates. For each individual, we constructed contrasts matching the samples provided. For example, in the Canadian study, there were individuals who provided samples at two different times, and where the second sample was split and analyzed in two different batches (batch 1 and batch 3) for a total of three samples. For each of these individuals, we constructed a contrast to compare the biological replicates as (-1.0, 0.5, 0.5) for (time 1 sample, first time 2 sample, second time 2 sample), and a contrast to compare the technical replicates (batch 1 versus batch 3) using (0.0, -1.0, 1.0). Such contrasts were built for each individual separately, resulting in a comprehensive set of contrasts, because we are interested in the differences in methylation for a type of replicate sample within individuals, and not in the differences in means between individuals. All contrasts were constructed to be orthogonal, and therefore we could obtain P values for effects of interest—e.g., for a technical replicate contrast—by summing the sums of squares for this contrast across individuals. This allowed construction of F statistics allowing assessment of statistical significance for probe variability.
For a global and visual assessment of agreement, we performed canonical redundancy analysis (RDA) analysis, which constructs projections of the data into dimensions explained by covariates [Citation29]. This approach combines multiple regression and principal component analysis to establish relationships between two sets of variables: response variables, in this case methylation levels, and explanatory variables or covariates. This approach was initially developed for ecological studies [Citation45] and was designed to quantify the effects of covariates on high dimensional data, allowing global inference about the covariates. Each RDA analysis was performed using a different random sample of 100,000 probes, and when we repeated analyses with different random samples of probes, similar results were obtained (data not shown). RDA analyses were also performed to compare the agreement between replicates prior to normalization with funtooNorm, and again with data normalized by funtooNorm but prior to adjusting for cell type mixtures.
We explored the effect of time in several ways. First, we used linear regressions. For each probe, we tested the association between the change in DNA methylation levels and elapsed time, adjusting for age. For both data sets, a subset of probes showed slope coefficients that were quite large in absolute value, suggesting that those probes may be more susceptible to changes over time. However, this approach assumes that the direction of change of the DNA methylation level is the same across individuals, which may not be the case if a probe is simply inconsistent over time. Therefore, our presented results are based on the previously described ANOVA results with specific contrasts.
Author contributions
Conceptualization, C.G., K. O.; Methodology, C.G., K.O.; Data Curation, M.M., K.O., H.G. and P.S.; Validation, M.F. and G.V.; Formal Analysis, C.G., G.V. and M.F.; Resources, K.O., H.G., J.L.M., L.M.M, M.M. and C.G.; Writing-Original Draft, C.G. and G.V.; Writing-Review & Editing, C.G., K.O. and M.F.; Visualization, G.V. and M.F.; Supervision, C.G.; Project Administration, C.G.; Funding Acquisition, C.G. and M.M.
Disclosure of potential conflicts of interest
No potential conflicts of interest were disclosed.
supp_data_1411443.docx
Download MS Word (1.9 MB)Acknowledgements
This work was funded by the Ludmer Centre for Neuroinformatics and Mental Health. Sadly, G.V.'s substantial contributions are acknowledged posthumously. MSK is the Canada Research Chair in Social Epigenetics, Senior Fellow of the Canadian Institute for Advanced Research, and Sunny Hill BC Leadership Chair in Child Development. LM McEwen is supported by a CIHR Frederick Banting and Charles Best Doctoral Research Award (F15-04283).
Data availability statement
The raw methylation measures are not available due to patient confidentiality. However, we provide the F-statistics and the ICC measures for different subgroupings, and for both datasets at https://doi.org/10.5281/zenodo.996561.
Additional information
Funding
References
- Marioni RE, Shah S, McRae AF, et al. DNA methylation age of blood predicts all-cause mortality in later life. Genome Biol. 2015;16:25. doi:10.1186/s13059-015-0584-6. PMID:25633388
- Marioni RE, Shah S, McRae AF, et al. The epigenetic clock is correlated with physical and cognitive fitness in the Lothian Birth Cohort 1936. Int J Epidemiol. 2015;44(4):1388–1396. doi:10.1093/ije/dyu277. PMID:25617346
- Horvath S. DNA methylation age of human tissues and cell types. Genome Biol. 2013;14(10):R115. doi:10.1186/gb-2013-14-10-r115. PMID:24138928
- Kato N, Loh M, Takeuchi F, et al. Trans-ancestry genome-wide association study identifies 12 genetic loci influencing blood pressure and implicates a role for DNA methylation. Nat Genet. 2015;47(11):1282–1293. doi:10.1038/ng.3405. PMID:26390057
- Liu Y, Aryee MJ, Padyukov L, et al. Epigenome-wide association data implicate DNA methylation as an intermediary of genetic risin rheumatoid arthritis. Nat Biotechnol. 2013;31(2):142–147. doi:10.1038/nbt.2487. PMID:23334450
- Lowe R, Gemma C, Beyan H, et al. Buccals are likely to be a more informative surrogate tissue than blood for epigenome-wide association studies. Epigenetics. 2013;8(4):445–454. doi:10.4161/epi.24362. PMID:23538714
- Jiang R, Jones MJ, Chen E, et al. Discordance of DNA methylation variance between two accessible human tissues. Sci Rep. 2015;5:8257. doi:10.1038/srep08257. PMID:25660083
- Smith AK, Kilaru V, Klengel T, et al. DNA extracted from saliva for methylation studies of psychiatric traits: evidence tissue specificity and relatedness to brain. Am J Med Genet B Neuropsychiatr Genet. 2015;168B(1):36–44. doi:10.1002/ajmg.b.32278. PMID:25355443
- Bibikova M, Barnes B, Tsan C, et al. High density DNA methylation array with single CpG site resolution. Genomics. 2011;98(4):288–295. doi:10.1016/j.ygeno.2011.07.007. PMID:21839163
- Bose M, Wu C, Pankow JS, et al. Evaluation of microarray-based DNA methylation measurement using technical replicates: the Atherosclerosis Risk in Communities (ARIC) study. BMC Bioinformatics. 2014;15:312. doi:10.1186/1471-2105-15-312. PMID:25239148
- Chen J, Just AC, Schwartz J, et al. CpGFilter: model-based CpG probe filtering with replicates for epigenome-wide association studies. Bioinformatics. 2016;32(3):469–471. doi:10.1093/bioinformatics/btv577. PMID:26449931
- Shvetsov YB, Song MA, Cai Q, et al. Intraindividual variation and short-term temporal trend in DNA methylation of human blood. Cancer Epidemiol Biomarkers Prev. 2015;24(3):490–497. doi:10.1158/1055-9965.EPI-14-0853. PMID:25538225
- Dugue PA, English DR, MacInnis RJ, et al. Reliability of DNA methylation measures from dried blood spots and mononuclear cells using the HumanMethylation450k BeadArray. Sci Rep. 2016;6:30317. doi:10.1038/srep30317. PMID:27457678
- Huang LH, Lin PH, Tsai KW, et al. The effects of storage temperature and duration of blood samples on DNA and RNA qualities. Plos One. 2017;12(9):e0184692. doi:10.1371/journal.pone.0184692 PMID:28926588
- Joo JE, Wong EM, Baglietto L, et al. The use of DNA from archival dried blood spots with the Infinium HumanMethylation450 array. BMC Biotechnol. 2013;13:23. doi:10.1186/1472-6750-13-23 PMID:23497093
- Bulla A, De Witt B, Ammerlaan W, et al. Blood DNA yield but not integrity or methylation is impacted after long-term storage. Biopreserv Biobank. 2016;14(1):29–38. doi:10.1089/bio.2015.0045 PMID:26812548
- Wang Y, Zheng H, Chen J, et al. The impact of different preservation conditions and freezing-thawing cycles on quality of RNA, DNA, and proteins in cancer tissue. Biopreserv Biobank. 2015;13(5):335–347. doi:10.1089/bio.2015.0029. PMID:26484573
- Florath I, Butterbach K, Muller H, et al. Cross-sectional and longitudinal changes in DNA methylation with age: an epigenome-wide analysis revealing over 60 novel age-associated CpG sites. Hum Mol Genet. 2014;23(5):1186–1201. doi:10.1093/hmg/ddt531. PMID:24163245
- Martino D, Loke YJ, Gordon L, et al. Longitudinal, genome-scale analysis of DNA methylation in twins from birth to 18 months of age reveals rapid epigenetic change in early life and pair-specific effects of discordance. Genome Biol. 2013;14(5):R42. doi:10.1186/gb-2013-14-5-r42. PMID:23697701
- Kimmel M, Clive M, Gispen F, et al. Oxytocin receptor DNA methylation in postpartum depression. Psychoneuroendocrinology.2016;69:150–160. doi:10.1016/j.psyneuen.2016.04.008. PMID:27108164
- Osborne L, Clive M, Kimmel M, et al. Replication of epigenetic postpartum depression biomarkers and variation with hormone levels. Neuropsychopharmacology. 2016;41(6):1648–1658. doi:10.1038/npp.2015.333. PMID:26503311
- Groleau P, Joober R, Israel M, et al. Methylation of the dopamine D2 receptor (DRD2) gene promoter in women with a bulimia-spectrum disorder: associations with borderline personality disorder and exposure to childhood abuse. J Psychiatr Res. 2014;48(1):121–127. doi:10.1016/j.jpsychires.2013.10.003. PMID:24157248
- Docherty SJ, Davis OS, Haworth CM, et al. A genetic association study of DNA methylation levels in the DRD4 gene region finds associations with nearby SNPs. Behav Brain Funct. 2012;8:31. doi:10.1186/1744-9081-8-31. PMID:22691691
- Ursini G, Bollati V, Fazio L, et al. Stress-related methylation of the catechol-O-methyltransferase Val 158 allele predicts human prefrontal cognition and activity. J Neurosci. 2011;31(18):6692–6698. doi:10.1523/jneurosci.6631-10.2011. PMID:21543598
- Ikegame T, Bundo M, Murata Y, et al. DNA methylation of the BDNF gene and its relevance to psychiatric disorders. J Hum Genet. 2013;58(7):434–438. doi:10.1038/jhg.2013.65. PMID:23739121
- van IJzendoorn MH, Caspers K, Bakermans-Kranenburg MJ, Beach SR, et al. Methylation matters: interaction between methylation density and serotonin transporter genotype predicts unresolved loss or trauma. Biol Psychiatry.2010;68(5):405–407. doi:10.1016/j.biopsych.2010.05.008.
- Philibert RA, Sandhu H, Hollenbeck N, et al. The relationship of 5HTT (SLC6A4) methylation and genotype on mRNA expression and liability to major depression and alcohol dependence in subjects from the Iowa Adoption Studies. Am J Med Genet B Neuropsychiatr Genet. 2008;147B(5):543–549. doi:10.1002/ajmg.b.30657. PMID:17987668
- Reese SE, Archer KJ, Therneau TM, et al. A new statistic for identifying batch effects in high-throughput genomic data that uses guided principal component analysis. Bioinformatics. 2013;29(22):2877–2883. doi:10.1093/bioinformatics/btt480. PMID:23958724
- Legendre P, Legendre L. Numerical ecology, 2nd ed. Amsterdam, The Netherlands: Elsevier Science; 1998.
- Edgar RD, Jones MJ, Robinson WP, et al. An empirically driven data reduction method on the human 450K methylation array to remove tissue specific non-variable CpGs. Clin Epigenetics. 2017;9:11. doi:10.1186/s13148-017-0320-z. PMID:28184257
- Stadler MB, Merr R, Burger L, et al. DNA-binding factors shape the mouse methylome at distal regulatory regions. Nature. 2011;484(7378):490–495. doi:10.1038/nature10716.
- Klengel T, Mehta D, Anacker C, et al. et al. Allele-specific FKBP5 DNA demethylation mediates gene-childhood trauma interactions. Nat Neurosci. 2013;16(1):33–41. doi:10.1038/nn.3275. PMID:23201972
- Fortin J-P, Labbe A, Lemire M, et al. Functional normalization of 450K methylation array data improves replication in large cancer studies. Genome Biol. 2014;15:503. doi:10.1186/s13059-014-0503-2. PMID:25599564
- Liu J, Siegmund KD. An evaluation of processing methods for HumanMethylation450 BeadChip data. BMC Genomics. 2016;17(469):1–11. doi:10.1186/s12864-016-2819-7.
- Fejes AP, Jones MJ, Kobor MS. DaVIE: Database for the visualization and integration of epigenetic data. Front Genet. 2014;5:325. doi:10.3389/fgene.2014.00325. PMID:25278960
- Lehne B, Drong AW, Loh M, et al. A coherent approach for analysis of the Illumina HumanMethylation450 BeadChip improves data quality and performance in epigenome-wide association studies. Genome Biol. 2015;16:37. doi:10.1186/s13059-015-0600-x. PMID:25853392
- Price ME, Cotton AM, Lam LL, et al. Additional annotation enhances potential for biologically-relevant analysis of the Illumina Infinium HumanMethylation450 BeadChip array. Epigenetics Chromatin. 2013;6(1):4. doi:10.1186/1756-8935-6-4. PMID:23452981
- Soriano-Tarraga C, Jimenez-Conde J, Giralt-Steinhauer E, et al. DNA isolation method is a source of global DNA methylation variability measured with LUMA. Experimental analysis and a systematic review. PLoS One. 2013;8(4):e60750. doi:10.1371/journal.pone.0060750.
- Oros Klein K, Grinek S, Bernatsky S, et al. funtooNorm: an R package for normalization of DNA methylation data when there are multiple cell or tissue types. Bioinformatics. 2016;32(4):593–595. doi:10.1093/bioinformatics/btv615. PMID:26500152
- O'Donnell KA, Gaudreau H, Colalillo S, et al. The maternal adversity vulnerability and neurodevelopment (MAVAN) project: theory and methodology. Can J Psychiat. 2014;59(9):497–508. doi:10.1177/070674371405900906. PMID:25565695
- Houseman EA, Accomando WP, Koestler DC, et al. DNA methylation arrays as surrogate measures of cell mixture distribution. BMC Bioinformatics. 2012;13(1):86. doi:10.1186/1471-2105-13-86. PMID:22568884
- McGregor K. Methods for estimating changes in DNA methylation in the presence of cell type heterogeneity [M.Sc. Thesis]. Montreal, QC, Canada: McGill University; 2015.
- Leek JT, Scharpf RB, Bravo HC, et al. Tackling the widespread and critical impact of batch effects in high-throughput data. Nat Rev Genet. 2010;11:733–739. doi:10.1038/nrg2825. PMID:20838408
- Shrout PE, Fleiss JL. Intraclass correlations: uses in assessing rater reliability. Psychol Bull. 1979;86(2):420–428. doi:10.1037/0033-2909.86.2.420. PMID:18839484
- egan Community Ecology Package. R-Forge. 2013 Jan 4; [ accessed 2016 Jan]. http://vegan.r-forge.r-project.org/.