
ABSTRACT
Cancer-specific DNA methylation from the tumor derived fraction of cell free DNA found in blood samples could be used for minimally invasive detection and monitoring of cancer. The knowledge of marker regions with cancer-specific DNA methylation is necessary to the success of such a process. We analyzed the largest cancer DNA methylation dataset available—TCGA Illumina HumanMethylation450 data with over 8,500 tumors—in order to find cancer-specific DNA methylation markers for most common human cancers. First, we identified differentially methylated regions for individual cancer types and those were further filtered against data from normal tissues to obtain marker regions with cancer-specific methylation, resulting in a total of 1,250 hypermethylated and 584 hypomethylated marker CpGs. From hypermethylated markers, optimal sets of six markers for each TCGA cancer type were chosen that could identify most tumors with high specificity and sensitivity [area under the curve (AUC): 0.969-1.000] and a universal 12 marker set that can detect tumors of all 33 TCGA cancer types (AUC >0.84). In addition to hundreds of new DNA methylation markers, our approach also identified markers that are in current clinical use, SEPT9 and GSTP1, indicating the validity of our approach and a significant potential utility for the newly discovered markers. The hypermethylated markers are linked to polycomb associated loci and a significant fraction of the discovered markers is within noncoding RNA genes; one of the best markers is MIR129-2. Future clinical testing of herein discovered markers will confirm new markers that will improve minimally invasive diagnosis and monitoring for multiple cancers.
KEYWORDS:
Introduction
Cancer is the second most common cause of death worldwide [Citation1]. Earlier detection of cancer or its recurrence could improve the treatment and management of the disease [Citation2]. Therefore, techniques for minimally invasive and cost effective cancer diagnosis and monitoring are needed. Biomarkers based on cell-free nucleic acids that could be extracted from blood samples or other liquid biopsies have grown in importance in recent years [Citation3]. When tumor cells die, their DNA is released into a bloodstream [Citation4], and becomes part of cell-free DNA (cfDNA), which is mostly fragmented to a single nucleosome size and can be recovered from serum and plasma samples. While cfDNA from healthy individuals is comprised mostly of DNA released by dead hematopoietic cells [Citation5], cfDNA from individuals with cancer contains additionally DNA derived from tumor cells [Citation6]. The fraction of tumor DNA in cfDNA might be substantial and varies from cancer to cancer [Citation7–9]. The total amount of cfDNA in plasma is relatively low and variable: only about 10 ng/ml plasma in healthy individuals [Citation10–12]. Sensitive techniques like next generation sequencing or real-time PCR can detect tumor specific DNA changes in cfDNA samples from cancer patients. These tumor specific DNA changes include gene mutations, loss of heterozygosity, translocations, and DNA methylation [Citation3]. Detection of specific DNA mutations present in certain tumors could be used for minimally invasive monitoring of patients during and after treatment [Citation13,Citation14]. In summary, the detection of tumor specific DNA in cfDNA from liquid biopsies can be used for minimally invasive diagnosis and monitoring of multiple pathologies, including cancer.
DNA methylation is an optional epigenetic modification of cytosine residues in the sequence context CpG [Citation15]. In normal cells, most of the CpGs are methylated with the exception of CpG-rich regions called CpG islands. Tumor cells have an altered epigenome with global DNA hypomethylation and promoter and CpG island-specific DNA hypermethylation [Citation15]. Detection of this cancer-specific aberrant DNA methylation in cfDNA samples provides one endpoint for minimally invasive cancer diagnostics and monitoring. Multiple DNA regions are typically aberrantly methylated in a majority of tumors [Citation16–19]; thus, DNA methylation could be superior as a cancer-specific marker to DNA mutations, since very few specific mutations are present in a large fraction of tumors [Citation20–22]. Therefore, detection of DNA methylation of several frequently aberrantly methylated regions may provide higher sensitivity over detecting single or few mutation markers. The cfDNA yield from a typical blood sample is sufficient to perform targeted analysis of several selected marker regions for the presence of cancer specific aberrant DNA methylation. Methylation specific real-time qPCR or digital droplet PCR (ddPCR) [Citation23] are of sufficient sensitivity to detect the presence of even a small fraction of methylated tumor DNA in a cfDNA sample. Overall, tumor specific DNA methylation in cfDNA from blood samples could be used for detection and monitoring of cancer; potentially with better sensitivity than tumor-specific DNA mutations.
In order to diagnose or monitor cancer by detecting cancer-specific DNA methylation, potential marker regions for examination have to be identified. These marker regions, specifically methylated only in tumor cells, could be identified by the analysis of whole-genome scale DNA methylation data from large cohorts of tumors and normal samples. The most extensive public resource currently available of such data is The Cancer Genome Atlas (TCGA). The TCGA database contains DNA methylation data from the Illumina HumanMethylation450 platform from over 8,500 tumor samples from 33 tumor types. In addition, the Gene Expression Omnibus (GEO) database contains DNA methylation data from the same platform for over 60 thousand samples, including several thousand normal blood and tissue samples. The Illumina HumanMethylation450 is a microarray based analytical platform that covers over 450,000 human CpGs that were chosen non-randomly with a focus on CpG islands and gene promoter regions—genomic features that are frequently hypermethylated in cancer. Thus, this platform provides an accurate analysis of DNA methylation state of CpG sites often aberrantly methylated in tumor cells. The large numbers of samples in TCGA and GEO databases together with substantial coverage of the Illumina HumanMethylation450 platform make these datasets an outstanding public resource for the discovery of DNA methylation markers across most common cancer types.
The purpose of this study was to use TCGA and GEO DNA methylation data to discover sets of DNA methylation marker regions that could be used for minimally invasive diagnostics and monitoring of most cancers. There are a few DNA methylation cancer markers in clinical use today, e.g., SEPT9 [Citation24] or GSTP1 [Citation25], and several studies have reported DNA methylation markers for individual cancers [Citation23,Citation26–29] or evaluated small sets of select markers across multiple cancers [Citation30]. However, to date, there was no study performed to find DNA methylation markers across the majority of cancers. To attempt this approach, we mined the whole TCGA Illumina HumanMethylation450 dataset (n = 9,312) and used several additional Illumina HumanMethylation450 cohorts from GEO (n = 2,189) to search for, filter, and test cancer-specific marker regions. Using our search strategy, in addition to known markers such as SEPT9 or GSTP1, we discovered over one thousand new marker regions across TCGA cancer types. From these markers, we then selected optimized sets of six markers for individual cancer types that identify most tumors of respective type with high sensitivity and specificity (AUC: 0.969-1.000). A universal 12 marker set that can identify tumors from any of 33 TCGA cancer types with AUC: 0.84-1.00 was selected. In general, our analysis of TCGA DNA methylation data discovered sets of new cancer-specific DNA methylation markers that can identify most tumor types with high sensitivity and specificity. These marker regions, that can be assayed using currently available technological platforms, such as qPCR, ddPCR, or next generation sequencing, will substantially expand existing cancer markers and broaden the spectrum of cancers that could be diagnosed and monitored using liquid biopsies.
Results
To identify cancer-specific DNA methylation markers we utilized tumor DNA methylation datasets from TCGA. TCGA is the largest publically available resource of gene expression, genetic, and epigenetic data from tumor samples. In addition to large sample numbers, the advantage of TCGA data is the consistency between thousands of samples and high standards of quality control. This study used TCGA DNA methylation data from the Illumina HumanMethylation450 platform. Data from this platform are presented as beta values—numeric values in interval 0.0-1.0. For unmethylated CpGs the beta value approaches zero, for fully methylated CpGs beta approaches 1, and for CpGs methylated in a fraction of the sample 0<beta<1, i.e., a CpG methylated in 50% of the sample will have a beta value of approximately 0.5. We used TCGA Illumina HumanMethylation450 data from 8,566 primary tumors of 33 cancer types and from 746 non-tumor tissue samples for 23 cancer types (Table S1). As the first step towards DNA methylation marker identification, differentially methylated regions (DMRs) were determined for each cancer type for which normal samples were available (, Table S1). DMRs are regions where DNA methylation in a group of tested samples is different from a reference. In our particular case, the tested samples were all tumors of a certain cancer type and the reference was a group of respective normal tissue samples. DMRs were defined as regions of at least two consecutive CpGs covered by the dataset that are located less than 500 bp apart and have mean difference from respective normal control of at least 0.4 beta (approximately 40% difference in the mean DNA methylation), see Materials and Methods for details. All analyzed cancer types exhibited DMRs of both directions—hyper- and hypo-methylated regions (Fig. S1). The numbers of DMRs and the ratio of hyper- and hypo-methylated regions varied greatly across cancer types with hypermethylated regions being overall more abundant (Fig. S1). In summary, as the first step towards cancer-specific marker discovery we identified DMRs for 23 TCGA cancer types for which TCGA HumanMethylation450 data exists for both the tumor as well as a corresponding normal tissue reference. Most of the cancer types have hundreds to thousands of differentially methylated regions when compared to their normal tissue counterparts and we predict that some of these DMRs will show tumor specificity making them suitable as marker regions for cancer detection and monitoring.
Figure 1. General schematic of the study.
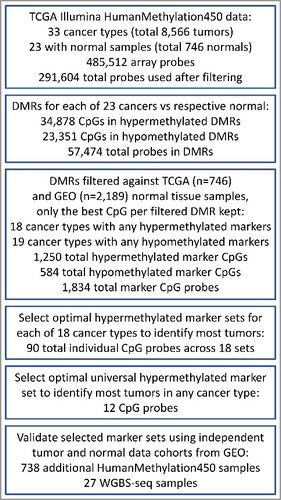
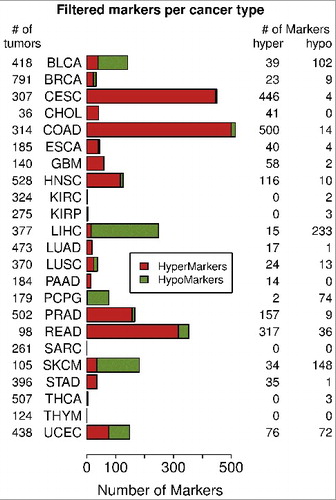
Identified DMRs marker candidates were filtered against data from normal tissues to reveal cancer-specific marker regions aberrantly methylated in a large fraction of tumors. Cancer diagnosis from cfDNA samples and other liquid biopsies is typically based on the detection of the presence of a small fraction of the cancer-specific aberrant DNA methylation. However, not all identified DMRs are cancer-specific. For example, some DMRs occurring in cancer also occur in some healthy tissues as part of normal physiological means of gene regulation that may be co-opted by cancer cells during carcinogenesis [Citation31]. Such DMRs are not suitable as markers since the methylated variant might also be present in the blood of healthy individuals and would result in false positive diagnosis. Therefore all DMR marker candidates were filtered against 18 cohorts of normal tissue samples (n = 2,189) from the GEO (Table S2) and normal samples from all TCGA cancer cohorts. The details of the filtering criteria are described in Supplemental methods. Only regions that were fully unmethylated (for hypermethylated marker candidates) or fully methylated (for hypomethylated marker candidates) across all normal tissue cohorts were selected as cancer markers. Further, a good marker region should be differentially methylated in a large fraction of tumor samples to provide high sensitivity. Therefore, to keep only markers methylated in a majority of tumors, only CpGs differentially methylated by >0.25 beta from control in more than 2/3 of tumor samples of the respective cancer type were selected as potential DNA methylation markers. In cases where multiple DMRs were located within 2 kb, only the best performing one was selected as a potential marker. The total numbers for individual filtered marker CpGs across all tumor types were 1,250 hypermethylated and 584 hypomethylated CpGs (Table S3). The numbers of markers per tumor type ranged up to 500 for hypermethylated marker regions in colon adenocarcinoma (COAD) and up to 233 for hypomethylated marker regions in liver hepatocellular carcinoma (LIHC) (). The hypermethylated DMRs were more common (), likely due to the fact that the platform coverage is biased towards genomic regions hypermethylated in cancer cells. Overall, filtering of DMRs revealed over one thousand of cancer-specific DNA methylation marker CpGs, many of them common across TCGA cancer types.
Figure 2. Numbers of marker CpGs per cancer. Only 23 TCGA cancer types had normal samples available and therefore were used in the analysis are displayed. The barplots show the numbers of hypermethylated and hypomethylated marker CpGs per cancer type after filtering.
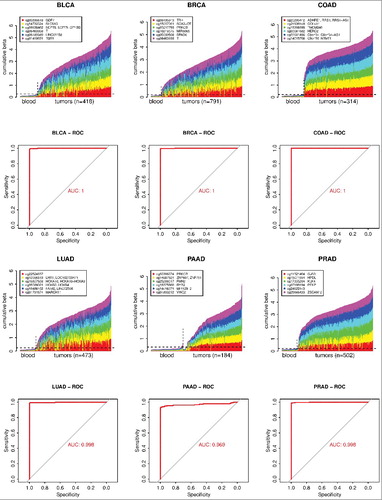
The next step was to determine optimal combinations of markers for each cancer type that provide maximal sensitivity and specificity. Hypermethylated marker CpGs were more common than hypomethylated ones () and, since they are technically easier to detect, only hypermethylated CpGs were used to select DNA methylation marker sets for the 18 TCGA cancer types that had hypermethylated marker CpGs after filtering (). The algorithm for marker CpG selection into these sets is described in Materials and Methods. The markers from this study are meant to be used to detect cancer in cfDNA from blood samples; and this cfDNA in healthy individuals originates mostly from hematopoietic cells. Therefore, a large whole-blood cohort from cancer-free subjects (n = 1388, GSE40279 and GSE87571, 656 and 732 samples, respectively) was used as a normal reference for marker testing to mimic cfDNA from cancer-free individuals. The marker sets were evaluated by two criteria. First, a tumor was considered to be identified by a marker set if at least one marker in that set had methylation in the respective tumor larger by at least 0.3 beta than the 95th percentile of the control blood cohort. Using this first criterion, selected sets of up to 12 markers were able to identify all of the identifiable tumors in each cancer cohort (Table S4). Second, the diagnostic ability of biomarkers is often evaluated by the receiver operating characteristic (ROC) plot and the area under the curve (AUC) of ROC plot; for markers of maximum sensitivity and specificity, the AUC is approaching 1.0. Therefore, as the other criterion, we used cumulative beta values of increasing numbers of markers for each cancer type and the control blood cohort to evaluate the marker sets using the ROC analysis. Sets of six selected markers were able to identify all or a large majority (>98%) of the identifiable tumors using 0.3 beta cut off and corresponding AUCs were in the range 0.969-1.000 (Table S4) across all 18 cancer types. Therefore, the sets of six markers were chosen as sufficiently large marker sets for individual cancer types. shows the methylation data for sets of six markers and corresponding ROC curves in breast invasive carcinoma (BRCA), bladder urothelial carcinoma (BLCA), COAD, lung adenocarcinoma (LUAD), pancreatic adenocarcinoma (PAAD), and prostate adenocarcinoma (PRAD). Individual plots for increasing numbers of up to 12 markers for individual cancers are available in Fig. S2. All 18 six marker sets for individual cancer types are listed in Table S5. In summary, we identified optimal sets of six markers for individual cancer types; these marker sets should detect a majority of tumors of the respective cancer type with high sensitivity and specificity.
Figure 3. Examples of cancer-specific marker sets for 6 individual cancer types. The figure shows optimal sets of six markers for each of six cancers: BLCA, BRCA, COAD, LUAD, PAAD, and PRAD. The plots show DNA methylation of each marker set in individual tumor samples in comparison to normal blood samples. Only 100 randomly chosen blood samples are shown. The horizontal dashed line shows the 95th percentile of the cumulative DNA methylation of each marker set in the entire control blood cohort (n = 1,388). The ROC analysis curves show the difference between each tumor cohort and the whole normal blood cohort (n = 1,388) for each marker set.
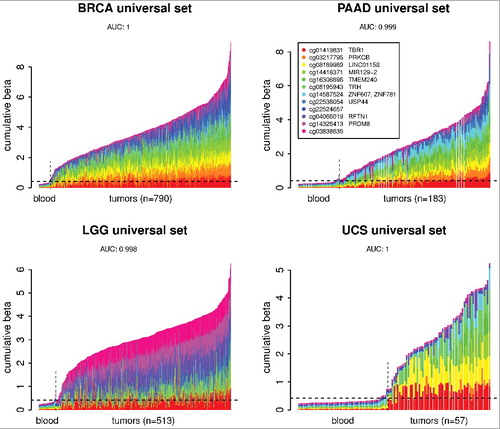
Finally, the 1,250 hypermethylated marker CpGs from all cancers and the knowledge about what cancers each marker can detect was used to find a universal set of markers that would be able to identify multiple common cancers. First, all 1,250 marker CpGs were consolidated to keep the single best marker CpG across all cancer types within a 500 bp locus; this way, the set of 1,250 marker CpGs was reduced to 1,114 CpGs. Then, using a similar algorithm as for individual cancers (Materials and Methods), a set of markers was selected () that has at least two markers positive in each of 18 cancer types that had hypermethylated markers available listed in . When this 12 marker set was tested across all 33 TCGA cancer types using whole-blood as a normal reference, it was found that, in addition to cancers it was derived from, this marker set can also identify, with high sensitivity and specificity, tumors belonging to additional cancer types. This universal set can identify tumors from 18 cancer types that were represented in the source marker CpG pool with AUC 0.99 or higher (). In addition, it can identify the other 15 cancer types that were not represented in the source marker pool with AUCs ranging from 0.84 to 1.00 (). shows the performance of the universal marker set for two TCGA tumor types that were represented in the pool it was derived from (BRCA and PAAD) and two additional tumor types that were not represented in the marker source pool [brain lower grade glioma (LGG) and uterine carcinosarcoma (UCS)]. The performance of the universal marker set across all 33 TCGA cancer types is available in Fig. S3. Overall, we found a universal marker set that can detect tumors of most TCGA cancer types with high sensitivity and specificity.
Table 1. The universal pan-cancer marker set. Numbers of cancers are counts of the TCGA cancer types for which the marker region have passed the filters. The last two columns indicate whether the marker CpG is located within polycomb locus or associated with noncoding RNA gene, respectively.
Table 2. Areas under the curve (AUC) for the universal pan-cancer marker set across all 33 TCGA tumor cohorts using the normal whole blood cohort (n = 1,388) as a control. The last column specifies whether the particular cancer type has any hypermethylated markers after filtering as listed in .
Figure 4. Performance of the universal marker set on examples of four cancer types. BRCA and PAAD are cancers that had specific markers in the pool from which the universal set was chosen. LGG and UCS are cancers that did not have markers in that pool since there were no normal samples available for these cancers; nonetheless the universal marker set is able to identify these cancers with high sensitivity and specificity. The plots show DNA methylation of the universal marker set in individual tumor samples in comparison to normal blood samples. Only 50 randomly chosen blood samples out of the whole control blood cohort are shown. The horizontal dashed line shows the 95th percentile of the cumulative DNA methylation of the marker set in the entire control normal blood cohort (n = 1,388). The AUC was calculated using the whole tumor cohort and the whole normal blood cohort (n = 1,388) for each cancer type.
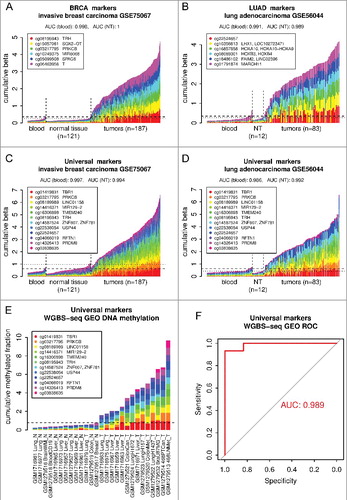
The discovered marker sets were validated using additional datasets from independent sample cohorts from GEO. Although the fact that the universal marker set can identify tumor types that were not used in its discovery suggests universal performance, we decided to test the markers on completely independent data to make sure they will perform universally. For this testing we used HumanMethylation450 data from additional cohorts of normal blood, tumor samples, and normal tissues from the GEO database. A normal blood cohort of 335 samples (GSE72775) was used as an independent cancer-free control and invasive breast carcinoma (GSE75067) and lung adenocarcinoma (GSE56044) cohorts were used to test BRCA and LUAD six marker sets, respectively, as well as the universal marker set. In addition to normal blood samples, tumor samples were tested against references from respective normal tissues (NT). The lung dataset had its own set of normal lung tissue samples and for the breast cohort normal breast samples from GSE101961 were used. The results [ (A–D)] show good performance of all three marker sets (AUC blood: 0.986-0.998, AUC NT: 0.989-1.0), indicating that the marker sets discovered from TCGA tumor data using our approach would likely identify any independent tumors of the type they were designed for. To validate the markers using data from other analytical platform than Illumina HumanMethylation450, we have tested the universal marker set on the whole-genome bisulfite sequencing (WGBS-seq) data from GEO. Samples from two studies, datasets GSE52271 and GSE56763 (5 normal, 8 tumors) [Citation32] and dataset GSE70090 (7 normal, 7 tumors) [Citation33], were combined into one cohort and analysis was performed on cumulative methylated fraction of 12 genomic regions corresponding to the universal marker set. The results [ (E,F)] are in good agreement with the results from HumanMethylation450 data, AUC: 0.989, 14 out of 15 tumor samples were classified as tumors. In summary, using independent GEO data cohorts from Illumina HumanMethylation450 platform and also from autonomous WGBS-seq analytical platform we successfully validated marker sets discovered based on the TCGA data. The new discovered markers will broaden the spectrum of tumor types that could be diagnosed and monitored from liquid biopsies and other minimally invasive samples including blood, lymph, urine, stool, and saliva.
Figure 5. Validation of marker sets identified using TCGA data on independent sample cohorts from the GEO. (a) BRCA-specific six marker set was tested using independent invasive breast carcinoma cohort (GSE75067). (b) LUAD-specific six marker set was tested using independent lung adenocarcinoma cohort (GSE56044). (c,d) Both of these cohorts were also used to test the universal marker set. Normal whole-blood cohort (GSE72775) and respective normal tissues (NT, breast GSE101961, lung GSE56044) were used as controls. The plots show DNA methylation of each marker set in individual tumor samples in comparison to normal blood samples and respective NT samples. Only 50 randomly chosen blood samples are shown. The horizontal dashed and dotted lines shows the 95th percentile of the cumulative DNA methylation of each marker set in the entire normal blood cohort (n = 335) and in respective NT cohort, respectively. The AUCs were calculated using the whole tumor cohort and the whole normal blood cohort (n = 335) or respective NT as a normal reference for each cancer and marker set combination. (e) Validation of the universal marker set using whole-genome bisulfite sequencing (WGBS-seq) data from GEO (GSE52271, GSE56763, GSE70090). The mean methylated fraction for 200 bp regions matching the marker CpGs was calculated from the WGBS-seq data and then used in a similar way as beta values in previous analysis. Individual samples are labeled by their GEO accession and an abbreviation of the tissue or cell line, N or T, at the end denominates normal or tumor samples, respectively. The horizontal dashed line shows the maximum of the cumulative DNA methylation of the marker set in the normal samples. (f) ROC analysis curve for the universal marker set and WGBS-seq cohort from (e).
Discussion
The goal of the study was to discover genomic regions that have cancer-specific changes in DNA methylation that could be used to detect and monitor multiple cancers from cfDNA samples. The study used TCGA HumanMethylation450 data, the largest collection of tumor DNA methylation data available with over 8,500 tumor samples [Citation34]. First, for each cancer type, DMRs were identified and those were then further filtered against cohorts of normal tissue samples to obtain regions suitable as cancer markers. From the pools of filtered marker regions, optimal cancer specific sets of markers as well as the universal marker set that could identify tumors of most cancer types were selected.
Blood and other body fluids provide means for easy, cost effective, minimally invasive diagnosis of diseases, including cancer. Blood samples are used to diagnose cancer by detecting tumor specific changes in DNA present in cfDNA. Our study was focused on finding marker regions with tumor specific changes in DNA methylation. Aberrant DNA methylation typically occurs at multiple loci in majority of tumors [Citation16–18] and, therefore, has the potential for higher sensitivity than cancer specific mutations. We found sets of DNA methylation markers for 18 TCGA cancer types and a universal set of markers for all 33 cancer types. These markers could potentially be used for cancer diagnosis and monitoring from blood samples. Currently, there are a few DNA methylation markers in clinical use for cancer diagnosis from cfDNA. One, SEPT9 promoter region of the v2 transcript was identified as possible colorectal cancer marker [Citation35] and developed into clinically used test to identify colorectal cancer from plasma samples [Citation24,Citation36]. In our study, this SEPT9 region was identified in a broader selection as a marker for COAD, rectum adenocarcinoma (READ), and head and neck squamous cell carcinoma (HNSC) (Table S3). In HNSC, SEPT9 is the first of the markers in the optimal set selected to identify majority of HNSC tumors (Fig. S2, Table S5). A second clinically used marker, located in promoter CpG island of GSTP1, was first identified as tumor marker in prostatic carcinomas [Citation25] and later developed to detect prostate cancer from urine or blood samples [Citation19,Citation37–39]. Our pool of 157 prostate cancer markers includes GSTP1 (Table S3). The fact that our approach identified markers currently in clinical use, in addition to hundreds of new marker regions, shows validity of our approach and the great potential of the newly identified markers. These new markers will substantially expand the capability of blood sample-based cancer diagnosis and monitoring to a broader spectrum of cancers.
The discovered DMRs (Fig. S1) and also the filtered markers () are predominantly regions hypermethylated in cancers, but unmethylated in normal tissues. The Illumina HumanMethylation450 platform covers only about 450,000 CpGs out of 28 million CpGs of the human genome with focus on CpG islands and gene promoters—genomic features that are typically unmethylated in normal cells and hypermethylated in cancer cells. This explains why a large fraction of hypermethylated marker regions was identified despite the fact that most of the cancer genome is typically hypomethylated [Citation15]. However, from a technical point of view, the hypermethylated regions are more suitable as markers: Cancer specific hypermethylation typically occurs in CpG-rich regions such as CpG islands, while hypomethylation is occurring in CpG-poor regions. The size of the amplicon for the DNA methylation analysis should be as small as possible to utilize fragmented cfDNA as a template and, at the same time, it should contain multiple CpGs to efficiently differentiate between methylated and unmethylated variant. Therefore, hypermethylated regions with their higher CpG density are more suitable for such analysis. In addition, DNA methylation analysis starts from bisulfite-converted DNA, where methylated cytosines are resistant to this conversion. Consequently methylated DNA retains higher complexity after bisulfite conversion, which is preferable for specific amplicon design. Therefore the large fraction of identified hypermethylated markers could be considered an advantage for subsequent design of analytical amplicons.
Some cancer types, e.g., COAD, READ, cervical squamous cell carcinoma and endocervical adenocarcinoma (CESC), HNSC, and PRAD, have much larger numbers of hypermethylated markers after filtering than others (). This could be due to several factors: i) These cancers could have a larger fraction of aberrant DNA methylation than other cancers; ii) Some of these tumor samples are purer, i.e., contain only small proportion of non-tumor cells and therefore the DNA methylation data are less diluted and more regions pass the stringent filters; iii) Some other cancers, e.g., BRCA, are more heterogeneous and therefore there are fewer markers that would be hypermethylated across most of the tumors of the particular type, which will lead to filtering out some regions. Our study was focused on markers for the individual cancer types as well as pan-cancer type markers, but has not sought markers specific for individual cancer subtypes. Since this is an in silico study based on the data from tumor samples and normal tissues, performance for the individual cancer types will differ for clinical cfDNA samples. Some tumor types that appear to be easy to detect in silico might be harder to detect in cfDNA due to the low amount of tumor DNA they contribute to cfDNA and vice versa; some tumors that might not look easy to be detected due to dilution of tumor samples with normal cells in TCGA data might be relatively easy to detect in cfDNA if they contribute a significant fraction to the cfDNA pool. Another important factor in marker performance will be disease stage: tumors with higher disease stage will likely leave stronger methylation footprint within cfDNA. Therefore, the level of detected DNA methylation signal could be potentially used to estimate disease stage and or tumor burden in case of monitoring recurrent disease. Overall, the clinical performance of the discovered markers in various cancers will likely depend on additional factors in addition to their in silico performance.
We used the whole-blood samples as a reference for the selection of the best marker sets out of each filtered cancer specific marker pool and for marker testing. The best possible reference would be cfDNA samples from cancer-free individuals. The cfDNA data from Illumina HumanMethylation450 platform, however, are not available, most likely due to relatively high sample requirement of this platform—at least 500 ng of DNA. To get this amount of cfDNA from cancer-free subjects would require at least 100 ml blood samples, which is unlikely to happen on a large scale. Therefore, we have chosen the whole-blood samples as a normal reference; whole-blood is the closest to the cfDNA samples, since cfDNA from healthy individuals is comprised mostly of DNA released by dead hematopoietic cells [Citation5,Citation6]. We are aware that cfDNA, even from cancer-free individuals, may have some differences in DNA methylation from the whole-blood DNA due to possible changes in DNA methylation that may happen in cells that have reached the lysis phase. The other possible normal reference for marker performance testing would be respective non-tumor tissue samples; however, some of the TCGA tumor types had low numbers of these samples. Moreover, normal solid tissues contribute minimally to cfDNA pool in cancer free subjects; therefore, respective non-tumor tissues do not mimic cfDNA from cancer free subjects well. In addition, TCGA non-tumor samples are histologically normal samples taken from cancer patients and in some cases the cancer specific DNA methylation is an early event and a fraction of non-tumor samples may contain increased DNA methylation. On the other hand, the advantage of the whole blood reference is the availability of several cohorts with large amounts of samples from cancer-free subjects. We have chosen to use a large cohort of the whole-blood samples consisting of datasets from two independent sources. This way we had one universal reference for all tumor types. Using the whole-blood reference rather than respective normal tissue allowed us to test even tumor types with relatively low numbers of normal samples or, for the universal marker set, we were able to test cancer types that did not have any respective normal samples available. Overall, the use of DNA methylation data from the whole-blood samples as a normal reference for marker testing was the best available choice.
The hypermethylated DMRs and hypermethylated marker regions have strong association with polycomb regulated loci. The CpGs of all hypermethylated DMRs as well as the CpGs of the hypermethylated markers and marker sets have highly statistically significant enrichment of the regions marked by histone H3 lysine 27 trimethylation in embryonic stem cells (P value = 0, Table S6). These regions are known to be regulated by polycomb repression and were previously reported to be preferential target of aberrant DNA methylation in cancer [Citation40,Citation41]. The hypomethylated DMRs and marker regions, on the other hand, do not have enrichment of these loci and, when tested, they were actually found significantly enriched in regions not associated with polycomb loci (Table S6). In summary, these results are consistent with the previous findings and further support the significance of polycomb-associated loci for aberrant DNA methylation observed in cancer.
The identified marker regions contain a substantial fraction of genes annotated as noncoding RNA. There is a statistically significant enrichment (P value = 0.0085, Table S6) of noncoding RNA gene-associated CpGs within the pool of 90 CpGs representing all 18 cancer specific six marker sets. These noncoding RNA genes include long noncoding RNAs and several miRNA genes, consistent with our previous findings that miRNA genes are frequent targets of aberrant DNA methylation in cancer [Citation42]. Indeed, one of the best markers, hypermethylated in a large fraction of tumors in multiple cancers and one of the markers of the universal pan-cancer set, is MIR129-2. miRNA129 has a tumor suppressive role and MIR129-2 gene was previously shown to be hypermethylated in multiple cancers [Citation42–47]. Other miRNA gene markers in selected marker sets are MIR124-3, which was also reported hypermethylated in several cancers [Citation47–51], and MIR6068. Besides the utility of these noncoding regions as DNA methylation cancer markers, these findings provide further support for the importance of epigenetic deregulation of the noncoding part of the genome in human carcinogenesis.
Multiple studies about discovery and testing of cancer-specific DNA methylation markers have been published in recent years, most of them focused on a single cancer type, such as breast cancer [Citation23,Citation26], colorectal cancer [Citation28], lung cancer [Citation27], and pancreatic cancer [Citation29]. A very recent study [Citation52] used TCGA Illumina HumanMethylation450 data from seven cancer types to build a model that could be used to predict cancer status based on low coverage whole-genome bisulfite sequencing (WGBS) data from cfDNA. This approach requires preparation and sequencing of bisulfite converted libraries from each cfDNA sample compared to our study, which found sets of several marker regions that could be analyzed by qPCR or ddPCR. Overall, compared to other studies seeking methylation cancer markers, our study is unique due to its pan-cancer approach and focus on several markers that could identify most cancers.
In summary, using TCGA Illumina HumanMethylation450 data for all available TCGA cancer types we identified sets of genomic regions specifically methylated in the majority of tumor samples that could be used as markers for minimally invasive cancer detection and monitoring. To our knowledge, this is the first comprehensive pan-cancer tumor methylation marker discovery study performed so far using the largest set of tumor data (>8,500 tumors) available. The identified marker sets have high sensitivity and specificity in in silico testing on both TCGA data and independent DNA methylation data from the GEO. Future clinical testing of these marker regions will likely confirm new markers that could be used for minimally invasive diagnosis and monitoring for multiple cancers and thus expand the diagnostic capability of liquid biopsies to a broader spectrum of cancers.
Materials and methods
The Illumina HumanMethylation450 DNA methylation data for 33 cancer types (Supplemental Table 1) were downloaded from The Cancer Genome Atlas (TCGA). In addition, the Illumina HumanMethylation450 data for two large normal whole-blood sample cohorts (GSE40279, GSE87571, 656 and 732 samples, respectively) and several additional normal tissue sample cohorts were downloaded from the GEO (GSE50192, GSE48472, GSE48684, GSE61278, GSE61258, GSE63704, GSE79100, GSE64509, GSE63315, GSE51954, GSE61259, GSE60655, GSE64490, GSE61257, GSE70977) (Table S2). Additional independent sample cohorts of normal whole-blood (GSE72775), invasive breast carcinoma (GSE75067), normal breast (GSE101961), and lung adenocarcinoma and normal lung (GSE56044) were downloaded from the GEO for marker sets validation (Table S2). All data were analyzed in the R programming environment [Citation53] using custom scripts. The beta values were first normalized using the BMIQ algorithm [Citation54] custom modified in principal as described [Citation55], but using distribution of type I probes from normal breast TCGA samples as a golden standard, separately for type I and type II probes for each sample. This normalization reduced the biases between the two probe chemistries as well as the differences between samples from datasets of different origin. See Supplemental methods for more details.
For each cancer type that had respective non-tumor samples available (23 tumor types), tumor samples were tested relative to respective normal tissue samples. The normalized beta values for individual CpG probes were converted to M values and the limma package [Citation56] was used to determine differentially methylated CpGs. Genomic positional information of the probes was added and overlapping pairs of 2 consecutive covered CpGs up to 500 bp apart were evaluated for differential methylation—mean difference from reference by >0.4 beta. Consecutive CpG pairs that passed this filter were clustered and these clusters (DMRs) were used as marker candidate regions for further filtering. All CpG probes in candidate clusters were then filtered against methylation in respective and universal normal TCGA cohorts as well as cohorts of normal blood and tissue samples from the GEO in order to eliminate candidates that show tissue specific methylation patterns, see Supplemental Methods for details. During the filtering, the data from the best performing CpG in each candidate region was used to represent the region.
The hypermethylated marker CpGs that passed the filters were further combined to identify optimal sets of markers able to identify the majority of tumor samples for each cancer type as well as a universal marker set to identify a majority of cancers. The cancer type-specific optimal marker sets were selected from all filtered hypermethylated markers for particular cancer type. A marker was considered identified or positive for a certain tumor sample if the beta of that tumor sample was at least a threshold (0.3 beta) higher than the 95th percentile of the reference (large blood cohort from cancer free subjects, GSE40279 and GSE87571, n = 1388). The selection algorithm worked as follows: First, out of whole cohort of tumor samples of certain cancer type were found those with the least number of positive markers and out of these markers the one with the overall best performance (positive in most tumor samples in that cancer type) was selected and all tumor samples identified by this marker were removed from the cohort. The process was repeated until there were no identifiable tumors left. Then all selected markers were removed from the original filtered hypermethylated marker pool and the process was repeated using complete tumor cohort again to select additional markers for each tumor sample if desired. Similarly, a universal marker set, that identifies most cancers, was selected using a consolidated pool of all markers from all cancers as a pool to choose from and known information for which cancers each marker passes the filters (i.e., is positive). The consolidated pool of all markers was obtained by filtering of all 1,250 hypermethylated marker CpGs, so in cases where different cancers had different CpG representative within the same locus (500 bp) the CpG positive in most cancers was selected as a representative for that locus for all cancers, where any CpG in that locus passed the original filters.
The performance of the marker sets was evaluated using ROC analysis on cumulative beta values for the respective marker set and the large blood sample cohort (n = 1388) as a cancer-free reference. The ROC analysis and AUC calculations were performed using the package pROC [Citation57]. Marker CpGs used in the figures were annotated by the RefSeq gene symbol of the overlapping gene(s) or by genes within 5 kb of the CpG regardless the direction. If there were no annotated RefSeq genes within 5 kb, the marker did not receive an identifier other than the Illumina CpG ID.
For marker validation using independent platform WGBS-seq data (methylation calls files) from two studies (datasets GSE52271 and GSE56763) [Citation32] and (dataset GSE70090—Bisulfite-Seq samples only) [Citation33] were downloaded from GEO. The mean methylated fractions of covered CpGs within 200 bp windows centered on individual marker CpGs from our universal marker set were calculated for each sample. These data were then analyzed in the same fashion as beta values from Illumina HumanMethylation450 platform. The cumulative methylated fraction of the whole marker set for each sample was used for the ROC analysis. The 10% over the maximum of the normal cut was applied to determine which samples would classify as tumors in this independent dataset from independent platform using 12 universal marker set regions.
Disclosure of potential conflicts of interest
The authors report no conflict of interest
Figure S1
Download PDF (406.1 KB)Figure S2
Download PDF (4.1 MB)Figure S3a
Download PDF (960.8 KB)Figure S3b
Download PDF (163 KB)Supplemental Legends
Download PDF (39.9 KB)Supplemental Methods
Download PDF (204.3 KB)Table S1
Download MS Excel (30.5 KB)Table S2
Download MS Excel (27.5 KB)Table S3
Download MS Excel (386.1 KB)Table S4
Download MS Excel (29 KB)Table S5
Download MS Excel (22.9 KB)Table S6
Download MS Excel (11.8 KB)Acknowledgments
The results shown here are in part based upon data generated by the TCGA Research Network: http://cancergenome.nih.gov/.
Additional information
Funding
Related Research Data
References
- Ferlay J, Soerjomataram I, Dikshit R, et al. Cancer incidence and mortality worldwide: sources, methods and major patterns in GLOBOCAN 2012. Int J Cancer. 2015;136:E359–E386. doi:10.1002/ijc.29210. PMID:25220842
- Siegel RL, Miller KD, Jemal A. Cancer Statistics, 2017. CA Cancer J Clin. 2017;67:7–30. doi:10.3322/caac.21387. PMID:28055103
- Schwarzenbach H, Hoon DSB, Pantel K. Cell-free nucleic acids as biomarkers in cancer patients. Nat Rev Cancer. 2011;11:426–437. doi:10.1038/nrc3066. PMID:21562580
- Leon SA, Shapiro B, Sklaroff DM, et al. Free DNA in the serum of cancer patients and the effect of therapy. Cancer Res. 1977;37:646–650. PMID:837366
- Lui YY, Chik KW, Chiu RW, et al. Predominant hematopoietic origin of cell-free DNA in plasma and serum after sex-mismatched bone marrow transplantation. Clin Chem. 2002;48:421–427. PMID:11861434
- Snyder MW, Kircher M, Hill AJ, et al. Cell-free DNA comprises an in vivo nucleosome footprint that informs its tissues-of-origin. Cell. 2016;164:57–68. doi:10.1016/j.cell.2015.11.050. PMID:26771485
- Fleischhacker M, Schmidt B. Circulating nucleic acids (CNAs) and cancer–a survey. Biochim Biophys Acta. 2007;1775:181–232. PMID:17137717
- Jahr S, Hentze H, Englisch S, et al. DNA fragments in the blood plasma of cancer patients: quantitations and evidence for their origin from apoptotic and necrotic cells. Cancer Res. 2001;61:1659–1665. PMID:11245480
- Diehl F, Li M, Dressman D, et al. Detection and quantification of mutations in the plasma of patients with colorectal tumors. Proc Natl Acad Sci U S A. 2005;102:16368–16373. doi:10.1073/pnas.0507904102. PMID:16258065
- Warton K, Lin V, Navin T, et al. Methylation-capture and next-generation sequencing of free circulating DNA from human plasma. BMC Genomics. 2014;15:476. doi:10.1186/1471-2164-15-476. PMID:24929644
- Breitbach S, Tug S, Helmig S, et al. Direct quantification of cell-free, circulating DNA from unpurified plasma. PLoS One. 2014;9:e87838.doi:10.1371/journal.pone.0087838. PMID:24595313
- Devonshire AS, Whale AS, Gutteridge A, et al. Towards standardisation of cell-free DNA measurement in plasma: controls for extraction efficiency, fragment size bias and quantification. Anal Bioanal Chem. 2014;406:6499–6512. doi:10.1007/s00216-014-7835-3. PMID:24853859
- Oxnard GR, Paweletz CP, Kuang Y, et al. Noninvasive detection of response and resistance in EGFR-mutant lung cancer using quantitative next-generation genotyping of cell-free plasma DNA. Clin Cancer Res. 2014;20:1698–1705. doi:10.1158/1078-0432.CCR-13-2482. PMID:24429876
- Bettegowda C, Sausen M, Leary RJ, et al. Detection of circulating tumor DNA in early- and late-stage human malignancies. Sci Transl Med. 2014;6:224ra24. doi:10.1126/scitranslmed.3007094.
- Esteller M, Herman JG. Cancer as an epigenetic disease: DNA methylation and chromatin alterations in human tumours. J Pathol. 2002;196:1–7. doi:10.1002/path.1024. PMID:11748635
- Novak P, Jensen T, Oshiro MM, et al. Agglomerative epigenetic aberrations are a common event in human breast cancer. Cancer Res. 2008;68:8616–8625. doi:10.1158/0008-5472.CAN-08-1419. PMID:18922938
- Shames DS, Girard L, Gao B, et al. A genome-wide screen for promoter methylation in lung cancer identifies novel methylation markers for multiple malignancies. PLoS Med. 2006;3:e486. doi:10.1371/journal.pmed.0030486. PMID:17194187
- Rauch TA, Zhong X, Wu X, et al. High-resolution mapping of DNA hypermethylation and hypomethylation in lung cancer. Proc Natl Acad Sci U S A. 2008;105:252–257. doi:10.1073/pnas.0710735105. PMID:18162535
- Heyn H, Esteller M. DNA methylation profiling in the clinic: applications and challenges. Nat Rev Genet. 2012;13:679–692. doi:10.1038/nrg3270. PMID:22945394
- Comprehensive molecular portraits of human breast tumours. Nature. 2012;490:61–70. doi:10.1038/nature11412. PMID:23000897
- Comprehensive molecular characterization of urothelial bladder carcinoma. Nature. 2014;507:315–322. doi:10.1038/nature12965. PMID:24476821
- Comprehensive molecular profiling of lung adenocarcinoma. Nature. 2014;511:543–550. doi:10.1038/nature13385. PMID:25079552
- Uehiro N, Sato F, Pu F, et al. Circulating cell-free DNA-based epigenetic assay can detect early breast cancer. Breast Cancer Res. 2016;18:129. doi:10.1186/s13058-016-0788-z. PMID:27993161
- Grutzmann R, Molnar B, Pilarsky C, et al. Sensitive detection of colorectal cancer in peripheral blood by septin 9 DNA methylation assay. PLoS One. 2008;3:e3759. doi:10.1371/journal.pone.0003759. PMID:19018278
- Lee WH, Isaacs WB, Bova GS, et al. CG island methylation changes near the GSTP1 gene in prostatic carcinoma cells detected using the polymerase chain reaction: a new prostate cancer biomarker. Cancer Epidem Biomar Prev. 1997;6:443–450. PMID:9184779
- Fackler MJ, Lopez Bujanda Z, Umbricht C, et al. Novel methylated biomarkers and a robust assay to detect circulating tumor DNA in metastatic breast cancer. Cancer Res. 2014;74:2160–2170. doi:10.1158/0008-5472.CAN-13-3392. PMID:24737128
- Wielscher M, Vierlinger K, Kegler U, et al. Diagnostic Performance of Plasma DNA Methylation Profiles in Lung Cancer, Pulmonary Fibrosis and COPD. EBioMedicine. 2015;2:929–936. doi:10.1016/j.ebiom.2015.06.025. PMID:26425700
- Lange CP, Campan M, Hinoue T, et al. Genome-scale discovery of DNA-methylation biomarkers for blood-based detection of colorectal cancer. PLoS One. 2012;7:e50266. doi:10.1371/journal.pone.0050266. PMID:23209692
- Kisiel JB, Raimondo M, Taylor WR, et al. New DNA methylation markers for pancreatic cancer: discovery, tissue validation, and pilot testing in pancreatic juice. Clin Cancer Res. 2015;21:4473–4481. doi:10.1158/1078-0432.CCR-14-2469. PMID:26023084
- Sanchez-Vega F, Gotea V, Petrykowska HM, et al. Recurrent patterns of DNA methylation in the ZNF154, CASP8, and VHL promoters across a wide spectrum of human solid epithelial tumors and cancer cell lines. Epigenetics. 2013;8:1355–1372. doi:10.4161/epi.26701. PMID:24149212
- Irizarry RA, Ladd-Acosta C, Wen B, et al. The human colon cancer methylome shows similar hypo- and hypermethylation at conserved tissue-specific CpG island shores. Nat Genet. 2009;41:178–186. doi:10.1038/ng.298. PMID:19151715
- Heyn H, Vidal E, Ferreira HJ, et al. Epigenomic analysis detects aberrant super-enhancer DNA methylation in human cancer. Genome Biol. 2016;17:11. doi:10.1186/s13059-016-0879-2. PMID:26813288
- Li X, Liu Y, Salz T, et al. Whole-genome analysis of the methylome and hydroxymethylome in normal and malignant lung and liver. Genome Res. 2016;26:1730–1741. doi:10.1101/gr.211854.116. PMID:27737935
- NCI, NHGRI, NIH. The Cancer Genome Atlas. Bethesda (MD): NIH, National Cancer Institute, National Human Genome Research Institute; 2016.
- Lofton-Day C, Model F, Devos T, et al. DNA methylation biomarkers for blood-based colorectal cancer screening. Clin Chem. 2008;54:414–423. doi:10.1373/clinchem.2007.095992. PMID:18089654
- Warren JD, Xiong W, Bunker AM, et al. Septin 9 methylated DNA is a sensitive and specific blood test for colorectal cancer. BMC Med. 2011;9:133. doi:10.1186/1741-7015-9-133. PMID:22168215
- Payne SR, Serth J, Schostak M, et al. DNA methylation biomarkers of prostate cancer: confirmation of candidates and evidence urine is the most sensitive body fluid for non-invasive detection. Prostate. 2009;69:1257–1269. doi:10.1002/pros.20967. PMID:19459176
- Wu T, Giovannucci E, Welge J, et al. Measurement of GSTP1 promoter methylation in body fluids may complement PSA screening: a meta-analysis. Br J Cancer. 2011;105:65–73. doi:10.1038/bjc.2011.143. PMID:21654682
- Van Neste L, Herman JG, Otto G, et al. The epigenetic promise for prostate cancer diagnosis. Prostate. 2012;72:1248–1261. doi:10.1002/pros.22459. PMID:22161815
- Ohm JE, McGarvey KM, Yu X, et al. A stem cell-like chromatin pattern may predispose tumor suppressor genes to DNA hypermethylation and heritable silencing. Nat Genet. 2007;39:237–242. doi:10.1038/ng1972. PMID:17211412
- Schlesinger Y, Straussman R, Keshet I, et al. Polycomb-mediated methylation on Lys27 of histone H3 pre-marks genes for de novo methylation in cancer. Nat Genet. 2007;39:232–236. doi:10.1038/ng1950. PMID:17200670
- Vrba L, Munoz-Rodriguez JL, Stampfer MR, et al. miRNA gene promoters are frequent targets of aberrant DNA methylation in human breast cancer. PLoS One. 2013;8:e54398. doi:10.1371/journal.pone.0054398. PMID:23342147
- Huang YW, Liu JC, Deatherage DE, et al. Epigenetic repression of microRNA-129-2 leads to overexpression of SOX4 oncogene in endometrial cancer. Cancer Res. 2009;69:9038–9046. doi:10.1158/0008-5472.CAN-09-1499. PMID:19887623
- Bandres E, Agirre X, Bitarte N, et al. Epigenetic regulation of microRNA expression in colorectal cancer. Int J Cancer. 2009;125:2737–2743. doi:10.1002/ijc.24638. PMID:19521961
- Wong KY, Yim RL, Kwong YL, et al. Epigenetic inactivation of the MIR129-2 in hematological malignancies. J Hematol Oncol. 2013;6:16. doi:10.1186/1756-8722-6-16. PMID:23406679
- Lu CY, Lin KY, Tien MT, et al. Frequent DNA methylation of MiR-129-2 and its potential clinical implication in hepatocellular carcinoma. Genes Chromosom Cancer. 2013;52:636–643. PMID:23580407
- Furuta M, Kozaki KI, Tanaka S, et al. miR-124 and miR-203 are epigenetically silenced tumor-suppressive microRNAs in hepatocellular carcinoma. Carcinogenesis. 2010;31:766–776. doi:10.1093/carcin/bgp250. PMID:19843643
- Kitano K, Watanabe K, Emoto N, et al. CpG island methylation of microRNAs is associated with tumor size and recurrence of non-small-cell lung cancer. Cancer Sci. 2011;102:2126–2131. doi:10.1111/j.1349-7006.2011.02101.x. PMID:21917081
- Gebauer K, Peters I, Dubrowinskaja N, et al. Hsa-mir-124-3 CpG island methylation is associated with advanced tumours and disease recurrence of patients with clear cell renal cell carcinoma. Br J Cancer. 2013;108:131–138. doi:10.1038/bjc.2012.537. PMID:23321515
- Wilting SM, van Boerdonk RA, Henken FE, et al. Methylation-mediated silencing and tumour suppressive function of hsa-miR-124 in cervical cancer. Mol Cancer. 2010;9:167. doi:10.1186/1476-4598-9-167. PMID:20579385
- Wang P, Chen L, Zhang J, et al. Methylation-mediated silencing of the miR-124 genes facilitates pancreatic cancer progression and metastasis by targeting Rac1. Oncogene. 2014;33:514–524. doi:10.1038/onc.2012.598. PMID:23334332
- Kang S, Li Q, Chen Q, et al. CancerLocator: non-invasive cancer diagnosis and tissue-of-origin prediction using methylation profiles of cell-free DNA. Genome Biol. 2017;18:53. doi:10.1186/s13059-017-1191-5. PMID:28335812
- Team RC. R: a language and environment for statistical computing. Vienna, Austria: R Foundation for Statistical Computing; 2015.
- Teschendorff AE, Marabita F, Lechner M, et al. A beta-mixture quantile normalization method for correcting probe design bias in Illumina Infinium 450 k DNA methylation data. Bioinformatics. 2013;29:189–196. doi:10.1093/bioinformatics/bts680. PMID:23175756
- Horvath S. DNA methylation age of human tissues and cell types. Genome Biol. 2013;14:R115.
- Smyth GK. Limma: linear models for microarray data. In: Gentleman RCV, Huber W, Irizarry R, Dudoit S, editors. Bioinformatics and computational biology solutions using R and bioconductor. New York: Springer; 2005. p. 397–420.
- Robin X, Turck N, Hainard A, et al. pROC: an open-source package for R and S+ to analyze and compare ROC curves. BMC Bioinformatics. 2011;12:77. doi:10.1186/1471-2105-12-77. PMID:21414208