
ABSTRACT
Cord blood DNA methylation is associated with numerous health outcomes and environmental exposures. Whole cord blood DNA reflects all nucleated blood cell types, while centrifuging whole blood separates red blood cells, generating a white blood cell buffy coat. Both sample types are used in DNA methylation studies. Cell types have unique methylation patterns and processing can impact cell distributions, which may influence comparability. We evaluated differences in cell composition and DNA methylation between cord blood buffy coat and whole cord blood samples. Cord blood DNA methylation was measured with the Infinium EPIC BeadChip (Illumina) in eight individuals, each contributing buffy coat and whole blood samples. We analyzed principal components (PC) of methylation, performed hierarchical clustering, and computed correlations of mean-centered methylation between pairs. We conducted moderated t-tests on single sites and estimated cell composition. DNA methylation PCs were associated with individual (PPC1 = 1.4 × 10⁻⁹; PPC2 = 2.9 × 10⁻⁵; PPC3 = 3.8 × 10⁻⁵; PPC4 = 4.2 × 10⁻⁶; PPC5 = 9.9 × 10⁻¹³, PPC6 = 1.3 × 10⁻¹¹) and not with sample type (PPC1-6>0.7). Samples hierarchically clustered by individual. Pearson correlations of mean-centered methylation between paired samples ranged from r = 0.66 to r = 0.87. No individual site significantly differed between buffy coat and whole cord blood when adjusting for multiple comparisons (five sites had unadjusted P<10−5). Estimated cell type proportions did not differ by sample type (P = 0.46), and estimated proportions were highly correlated between paired samples (r = 0.99). Differences in methylation and cell composition between buffy coat and whole cord blood are much lower than inter-individual variation, demonstrating that both sample preparation types can be analytically combined and compared.
Introduction
Early life epigenetic epidemiology is a highly promising and productive area of research [Citation1–3]. Prenatal environmental exposures may influence epigenetic factors, such as DNA methylation, which serves as a useful biomarker of previous exposures and conditions [Citation4,Citation5]. Similarly, DNA methylation at birth is also associated with birth outcomes and may mediate impacts on health outcomes later in life [Citation6]. Biological samples collected at birth allow for the investigation of epidemiological links between exposures, epigenetic changes through DNA methylation, and health. Cord blood collected at birth is often used as a proxy tissue in methylation studies on infants. Cord blood DNA methylation has been associated with numerous health outcomes and environmental exposures [Citation7–13].
Cord blood contains a mixture of DNA from multiple leukocyte cell types including granulocytes, other white blood cells, and nucleated red blood cells present in fetal life. Nucleated red blood cells only continue to be present in infant blood for a few days after birth [Citation14]. In contrast, non-nucleated red blood cells do not contribute DNA to methylation measures. Since cord blood cell types have unique methylation patterns [Citation15–17], differential cell proportions across samples highly influence DNA methylation measures and can confound analyses if related to variables of interest [Citation18].
Critical to epidemiological testing and interpretation, blood sample processing impacts cell composition. DNA isolations from whole cord blood, commonly collected in anti-coagulant tubes (containing heparin or EDTA), reflect all nucleated cell types, including nucleated red blood cells. Some investigators elect to centrifuge the whole blood, generating a buffy coat of white blood cells (including granulocytes) separated from red blood cells. These two methods are the most commonly used for processing cord blood in epigenetic epidemiology. A third processing method, beyond the scope of this study, involves density centrifugation (e.g. with Ficoll), to isolate cord blood mononuclear cells (CBMCs), removing both granulocytes and red blood cells [Citation19]. An important consideration is the fate of fetal nucleated red blood cells in processing methods. These uniquely hypomethylated cells interact with white blood cells, forming doublets that can result in cross-contamination during fluorescence-activated cell sorting [Citation16]. Furthermore, in density centrifugation of newborn blood, the mononuclear cell layer is visibly contaminated with red blood cells appearing pink, while the corresponding layer in adult blood is white [Citation19]. These observations suggest buffy coat separation may not successfully remove nucleated red blood cells, minimizing impacts on cell composition.
Replication across studies is an essential component of epigenetic epidemiology, but the comparability across sample processing methods has not yet been tested. Therefore, it is important to experimentally test the effect of cord blood sample processing on the cellular composition and thus the DNA methylation of samples commonly used for epidemiological measures. We examined differences in cell proportions and DNA methylation by whole cord blood or cord buffy coat sample types. We hypothesized that since nucleated red blood cells can stick to white blood cells, buffy coat samples will be similar in cell composition and DNA methylation to whole cord blood samples.
Methods
Study sample
The Early Autism Risk Longitudinal Investigation (EARLI) is a pregnancy cohort study that recruited mothers who already had a child diagnosed with autism spectrum disorder (ASD). Full details of the study have been previously described [Citation20]. Informed consent was obtained from all participants. This study was approved by Institutional Review Boards at all study sites (Johns Hopkins University, Drexel University, UC Davis, Kaiser Permanente) and the secondary analysis site (University of Michigan). Demographic characteristics, such as race, were self-reported throughout pregnancy. At birth, biological samples including cord blood were collected. In EARLI, whole cord blood was drawn into EDTA tubes. One tube was archived as whole blood and the second was centrifuged to separate the buffy coat. Samples were archived at -80°C prior to processing for this study. For this sub-study, we randomly selected eight term births (two from each study site) with adequate buffy coat and whole blood biorepository samples, from subjects with no ASD based on clinical assessment at 36 months.
DNA methylation measures
DNA was extracted using the DNeasy Blood kit (Qiagen) per manufacturer instructions. DNA was bisulfite treated and cleaned using the EZ DNA methylation kit (Zymo Research) at the University of Michigan Epigenetics Core. Bisulfite treated DNA was hybridized and imaged on the Infinium MethylationEPIC (EPIC) BeadChip (Illumina) at the University of Michigan DNA Sequencing Core. One slide can measure eight samples and 96 samples are run together on a plate. We used two slides from a single plate for this study. Samples were randomly plated, with pairs together on the same slide, to reduce potential batch effects. In total, there were eight whole cord blood DNA paired with eight buffy DNA from the same cord sample among EARLI participants. Raw DNA methylation data are available through the Genome Expression Omnibus (GSE103189).
Data preprocessing
Raw image array files were processed in R statistical software (version 3.3) using the minfi package (version 1.20.2) [Citation21]. We estimated sex from raw methylation data, and observed pair concordance with demographic data. Probes on sex chromosomes were included in the analysis. All samples had overall methylated and unmethylated image intensities greater than 11 relative fluorescence units, and fewer than 1% failed probes. Data were processed with noob for within-sample background correction and dye-bias equalization [Citation22]. Probes that failed detection P value >0.01 in one or more samples were dropped (n = 2,699). An additional 43,096 probes annotated as cross reactive were also removed [Citation23]. The final study sample contained 821,041 probes from 16 samples. Beta values from the processed data were used to approximate percent methylation per site. As a sensitivity analysis, we repeated analyses using logit transformed M-values for methylation [Citation24].
Statistical analyses
We examined DNA methylation distributions of samples using density plots of beta values, colored by sample pair and sample type. DNA methylation data were compared using principal components analysis (PCA). Principal components (PCs) were considered until the cumulative proportion of variance reached >80%, which was achieved with six PCs. In pairwise PCA plots up to the sixth PC, data points were colored by technical covariates (slide, row number), biological covariates (sex, race), and experimental conditions (individual, sample type) to visualize differences by these variables. We tested for these differences in PCA using t-tests for categorical variables, ANOVA for multi-category data, and Pearson correlation tests for continuous variables. We then performed hierarchical clustering on the DNA methylation data, with Euclidian distance calculation and complete linkage clustering. DNA methylation in whole blood and buffy coat were compared using plots of mean-centered correlations at all sites for each pair [Citation25]. To center data for each CpG, the mean across all samples was subtracted from the observed values in each sample for that CpG. Pearson correlations were then computed between paired buffy coat and whole blood samples [Citation25]. We also created Bland and Altman plots [Citation26] to evaluate differences between methylation values measured from paired samples. We counted sites with >5% magnitude DNA methylation difference within pairs and checked for overlap in discordant sites between pairs.
Single site analysis was performed to investigate possible CpGs that were differentially methylated in buffy coat and whole blood samples. We performed moderated paired t-tests for each CpG using the limma package (version 3.30.13) [Citation27]. No other covariates were included in the model for adjustment, due to the paired design. When adjusting for multiple comparisons, we considered Bonferroni P<6.09 × 10⁻⁸ reaching genome-wide significance. We compared the single site results to published signatures of cord blood cell types [Citation15]. We tested the single site results for enrichment in Illumina annotated genomic features (CpG island, shore, shelf, open sea) and for representation of hypermethylated (>80% methylated), partially methylated (20-80%), or lowly methylated (<20%) sites using chi-square tests. With the DMRcate package (version 1.10.10), single site results were used as input to analyze for differentially methylated regions [Citation28]. In DMRcate, default false discovery rate (FDR) cutoff of 0.05 for CpG sites was relaxed to a FDR cutoff of 0.8.
Cord blood cell composition was estimated in minfi from DNA methylation references created on the Illumina HumanMethylation450 BeadChip (450K) array [Citation15]. We compared estimated cell distributions by sample type (buffy coat, whole blood) using repeated-measures ANOVA and Pearson correlation. Cell composition was also estimated on publicly available neonatal blood spot DNA methylation data with paired repeated EPIC and 450K array measures to compare against technical variation [Citation23]. In addition to the above lookup of most significant sites for previously identified cell type markers, we conducted enrichment testing for cord blood cell type signatures among our single site results, where possible in overlapping EPIC and 450K sites. In the cell type reference dataset, we used P<10−8 to determine the cell type signatures [Citation15]. To include a sufficient number of sites in our dataset for analysis, a P<10−3 cutoff was used for our buffy and whole blood single site results. We tested for overlap in cell type reference and our buffy/whole blood CpG sites meeting these cut points with a chi-square test.
Results
Study sample characteristics
Among the eight participants in our study (16 paired whole blood and buffy coat samples), three infants were female, six mothers identified as white, one as Asian Indian, and one as mixed race (). Mean gestational age at birth was 38.9 weeks (standard deviation = 0.6).
Table 1. Subject and sample characteristics.
DNA methylation principal component analysis (PCA)
Overall distributions of DNA methylation by sample did not group by buffy coat or whole blood sample type (Supplementary Figure 1). In PCA, samples separated by individual rather than sample type (buffy coat/whole blood), suggesting there were greater differences between individuals than within (). We observed differences by the technical variable slide (Supplementary Figure 2), as well as differences by sex and race (Supplementary Figure 3). In hierarchical clustering of DNA methylation data, samples also grouped by individual rather than type (). The first principal component (PC) of the DNA methylation data was associated with individual (P = 1.4 × 10⁻⁹), sex (P = 4.2 × 10⁻⁹), estimated percent granulocytes (P = 1.08 × 10⁻⁴), and estimated percent nucleated red blood cells (P = 6.0 × 10⁻⁵) (Supplementary Figure 4). PC2 was associated with individual (P = 2.9 × 10⁻⁵) and slide (P = 5.3 × 10⁻³). PCs 3-6 were further associated with individual (P = 3.8 × 10⁻⁵, 4.2 × 10⁻⁶, 9.9 × 10⁻¹³, 1.3 × 10⁻¹¹, respectively). Importantly, sample type (buffy vs. whole) was not associated with any DNA methylation PC, with all P>0.7 (Supplementary Figure 4).
Figure 1. Principal components analysis of EPIC array DNA methylation for 16 cord blood samples (pairs of 8 buffy coat and 8 whole blood). We do not observe differences by sample type (blue: buffy coat, red: whole blood) and paired samples tended to cluster together.
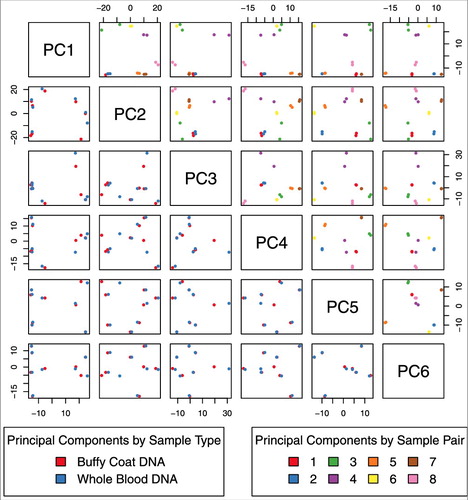
Figure 2. Dendrogram from hierarchical clustering on DNA methylation data, using complete linkage method. Samples clustered together by pairs.
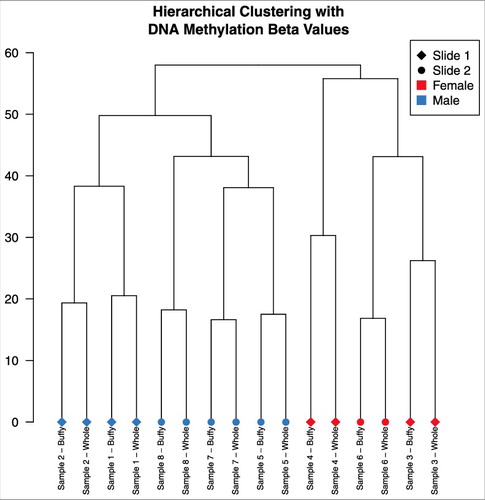
Figure 3. Mean centered percent methylations at CpGs in buffy coat and whole blood paired samples. 100 points in the least dense regions are plotted. We observe high correlation between methylation in buffy coat and whole blood.
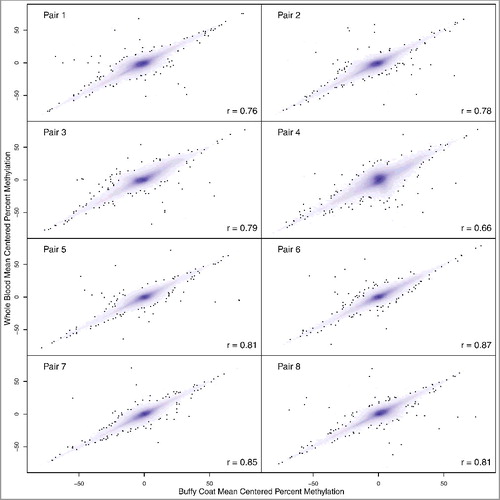
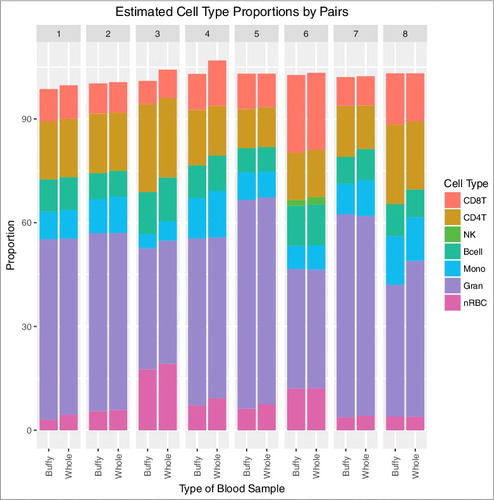
Figure 4. Estimated cell type proportions from 8 matched buffy coat and whole blood cord samples. We observe that cell type proportions within subject are correlated.
DNA methylation comparison between whole blood and buffy coat
Individual pairs of whole blood and buffy coat mean-centered DNA methylation values were highly correlated (). The least correlated sample pair had Pearson r = 0.66, while the most correlated had r = 0.87. As seen in Bland-Altman plots, the differences in methylation values tended to be small and were scattered around zero, with exceptions in each pair with extreme differences (Supplementary Figure 5). When characterizing buffy versus whole blood variation within the pairs, 50% of absolute differences were within approximately 1% methylation, and 95% of absolute differences were within approximately 5% methylation. The number of sites discordant by more than 5% methylation (absolute value) in pair one was 35,246. The remaining pairs (two through eight) had a range of discordant sites (29,307; 67,512; 88,735; 20,854; 17,646; 17,347; 23,998, respectively). Across these 5% methylation discordant sites, only four CpG sites were present in all pairs: cg03543448, cg19976363, cg08668544, and cg23933193. Two of these CpG sites are not in the cell type reference datasets; however, both cg03543448 and cg19976363 were previously identified as hypomethylated in nRBCs compared to other blood cell types [Citation15]. Note, direction of differences for these CpGs was heterogeneous across sample pairs. For example, cg03543448 was hypermethylated in buffy coat compared to whole blood in three pairs, but hypomethylated for five pairs.
Estimated cell proportions between whole blood and buffy coat
Cell proportions were estimated for each sample (). Granulocytes made up the largest fraction, with estimated proportions ranging from 35% to 60%. Natural killer cells had the smallest fractions, with most samples (12 of 16) having an estimated proportion of 0%. Buffy coat did indeed include nucleated red blood cells in cell type estimation (mean = 7.4%). In all but one pair, buffy coat had a lower estimated nRBC proportion than in whole cord blood. The average difference in estimated proportion of nRBCs was −0.90% (95% CI: −1.56%, −0.24%). Buffy coat samples had an average of 1.23% higher estimated CD4T proportion (95% CI: 0.11%, 2.34%), −0.39% lower estimated CD8T proportion (95% CI: −1.40%, 0.62%), −0.23% lower estimated B cell proportion (95% CI: −0.85%, 0.39%), −0.50% estimated monocyte proportion (95% CI: −1.38%, 0.38%), and -0.32% estimated granulocyte proportion (95% CI: −2.64%, 2.00%). When considering all cell types together, we did not observe differences in estimated cell proportions between buffy coat and whole blood samples (P = 0.46) (). Estimated cell proportions were highly correlated (Pearson r = 0.995). Within individual cell types, correlation was very high between buffy coat and whole cord blood samples (CD8T r = 0.97, CD4T r = 0.97, B cell r = 0.93, monocytes r = 0.94, granulocytes r = 0.96, nRBC r = 0.99, NK r = 1 due to previously mentioned 0% estimates). Cell proportions in publicly available repeated blood spot data were also estimated and estimated cell proportions were also highly correlated (Pearson r = 0.997) (Supplementary Figure 6).
Single CpG site analysis
In single site analysis, no CpG site was significant when adjusting for multiple comparisons. The model had a lambda inflation factor of 1.37 (Supplementary Figure 7). The lowest observed unadjusted P value was 1.63 × 10⁻⁶ for cg10480693, which had an estimated mean difference of 2.69% methylation comparing whole cord blood to buffy coat. Five sites had P<10−5 (summarized in Supplementary Table 1, results for all probes can be found in Supplementary Table 2), adjusting for false discovery rate yielded Q-values of 0.66 for these sites. Three of these five sites did not overlap with cord blood sorted cell type references. Among those overlapping, cg00648883 was previously strongly associated with cell type and was hypomethylated in monocytes and granulocytes relative to other cell types [Citation15]. Further, cg10701033 was slightly hypomethylated in nucleated red blood cells [Citation15].
We observed 1,131 sites differing between buffy coat and whole blood with P<10−3. Among these probes, 58% were highly methylated sites (compared to 50% on the entire array), 5.4% of probes were lowly methylated (27% on the array), and 36.6% were in between (23% on the array) (Supplementary Figure 8). Thus, the most significant sites were more likely to be highly methylated sites and partially methylated sites (chi-square P = 2.1 × 10−64). Top sites also significantly differed by genomic annotation from the proportion represented on the entire EPIC array (chi-square P = 2.3 × 10⁻²⁵). On the EPIC array 18.6% of probes are in CpG islands, while only 6.7% were in CpG islands in our results. Conversely, 56% of probes on the EPIC array are in the open sea region and amongst our top sites, 68% were in open sea regions.
There were 400,551 CpG sites that overlapped between our analysis and 450K array data used in published cell type signatures. Of these sites, 148,707 sites differentially methylated in nRBCs met a P<10−8 threshold [Citation15]. Restricting to the 400,551 common sites, 477 CpG sites met a P<10−3 threshold in our paired buffy and whole cord blood model. By chance, 177 sites would be expected to overlap with known nRBC sites, and we observed 247 overlapping sites, representing enrichment for nRBC signatures in the buffy versus whole blood comparison (P = 4.6 × 10⁻¹¹). CD4T signatures were also enriched (P = 1.7 × 10⁻⁷). Other cord blood cell type signatures were not significantly enriched.
Single site results were used to test for differentially methylated regions (DMRs). No DMRs were observed with FDR of 0.05, as expected since no single sites were FDR significant. When relaxing the cutoff, we observed 479 DMRs with a regional Stouffer transformed significance of 0.72. These regions are reported in Supplementary Table 3, along with the maximum single site difference in each region, and the difference in methylation averaged across sites in a region.
Sensitivity Analyses
PCA was repeated using M-values instead of beta values for methylation (Supplementary Figure 9). Grouping of samples by PCs of M-values behaved similarly as they did for beta values. The exception is pair four, where samples appear to have a greater separation when using M-values. Hierarchical clustering on M-values mirrors this observation (Supplementary Figure 10). Pairing by individual, as in the case using beta values, is seen, except for individual four. The whole blood sample for individual four is placed in a group by itself, away from all other samples. In single site analysis using M-values, no site reached P<10−5. Full results for all probes are provided in Supplementary Table 4.
Discussion
Newborn cord blood is an effective biosample for epigenetic epidemiology studies. In published studies based on whole cord blood, DNA methylation associations were identified with prenatal antidepressant exposure [Citation29], fetal growth restriction [Citation30], and cord blood triglyceride levels [Citation31]. Other studies elected to process and extract DNA from buffy coat, and identified associations between DNA methylation and maternal depression or anxiety [Citation32], parental obesity [Citation33], birth weight-for-gestational age [Citation13], and prenatal mercury exposure [Citation34]. Whole cord blood and cord blood buffy coat are the most commonly used sample types in perinatal epigenetic epidemiology, but their estimated cell composition and DNA methylation need to be rigorously compared prior to meta-analysis.
Our results suggest DNA methylation of buffy coat and whole cord blood are comparable. Paired samples of whole cord blood and buffy coat had similar DNA methylation estimated cell type proportions. nRBCs were present in buffy coat samples, though there was a reduction in the estimated proportion of nRBCs in buffy coat compared to whole blood (mean difference -0.90%, 95% CI: -1.56%, -0.24%). Our single CpG site results comparing buffy coat and whole blood were enriched for nRBC reference signals, likely reflecting the difference in estimated nRBC proportion. Despite the reduction of nRBCs in buffy coat, overall DNA methylation did not differ between buffy coat and whole blood samples. Mean-centered methylation measures were highly correlated between paired buffy coat and whole blood samples, with Pearson correlation coefficients ranging from 0.66 to 0.87. Principal components of DNA methylation show that the samples cluster by subject, and not by sample type. We observed that DNA methylation and cell composition differences between whole blood and buffy coat sample types are minimal, and we therefore predict that epigenome-wide association studies may replicate across these sample types.
No single CpG site was a significant marker of buffy coat versus whole blood sample type when adjusting for multiple comparisons. Eight CpG sites were previously identified as “erythroid DNAm markers” by de Goede et al. for identification of nRBC contamination, selected based on an average hypomethylation of >50% in nRBCs compared to other cell types [Citation16]. One of these sites identified on the 450K array is not on the EPIC array. Of the seven remaining sites, we found that cg10018933 was 1.8% hypomethylated in whole blood compared to buffy (P = 0.057). The next two sites in our study with the highest magnitudes of change were cg20555305 (1.5% hypermethylated in whole blood, P = 0.13) and cg26876834 (1.3% hypomethylated in whole blood, P = 0.36). The four other marker sites had mean differences of <1.0% methylation in our study.
To evaluate the pairwise comparisons of our small buffy coat and whole blood study in context of potential technical variation, we explored data from previous studies. Mean-centered correlations in our samples are higher than those in publicly available paired EPIC and 450K measures of five infant blood spot samples [Citation23]. Their data ranged from 0.37 to 0.54, though platform differences make this an imperfect analogue of technical variation. The mean difference in nRBC proportion between the paired measures (450K – EPIC) on the infant blood spots was 0.63% (95% CI: −0.31%, 1.57%), compared to 0.90% mean difference in our buffy and whole blood samples. The mean difference in estimated granulocyte proportion was −2.70% (95% CI: −0.70%, −4.71%). As seen by the confidence interval, granulocytes had the largest variation in estimation cell proportion, as was the case in our study (−0.32%, 95% CI: −2.64%, 2.00%). Average estimated monocyte proportions in the EPIC measures were −0.67% lower (95% CI: −1.32%, −0.02%). Average difference in estimated proportions in the paired blood spot data were not significantly different for CD8T cells (−0.03%, 95% CI: −1.83%, 1.77%), CD4T cells (1.00%, 95% CI: −0.44%, 2.44%), natural killer cells (0.85%, 95% CI: −0.61%, 2.30%), and B cells (0.27%, 95% CI: −0.80%, 1.33%). The range of differences seen in the EPIC and 450K replicates on blood spots are similar to those seen in our samples. As in the case of mean-centered correlations, platform differences may introduce more variation in estimated cell proportions. The number of discordant sites we observed between buffy and whole cord blood samples was also comparable to numbers seen in technical replicates on the EPIC array. In a validation of the EPIC array, approximately 40,000 sites were discordant by >5% methylation between two runs of a normal colon sample [Citation35]. In another similar study, a technical replicate for a transformed prostate cancer cell line sample had approximately 39,000 discordant sites, while repeated measures for a prostate epithelial cell culture showed approximately 54,000 discordant sites [Citation23]. Variation within our buffy and whole blood pairs is similar to published technical replicates, implying high sample type comparability.
Meta-analyses and replication testing are important and necessary future directions for epigenetic epidemiology to overcome sample size limitations with multiple comparisons. In general, we should take care when combining findings from samples with different underlying cell distributions. Differences in nucleated red blood cell counts are especially worrisome, as they have been observed to have some of the most extensive methylation changes among the cell types in cord blood [Citation12]. Specific to cord blood buffy coat and whole blood samples, our findings of similar cell compositions between the two sample types gives some reassurance to this concern. Studies have already meta-analyzed epigenetics data from both whole cord blood and buffy coat sources. For example, in a meta-analysis of 13 cohorts on the effect of maternal smoking on newborn cord blood DNA methylation, two cohorts used buffy coat samples and 11 whole blood [Citation7]. Observed associations between CpG methylation and maternal smoking were generally consistent across cohorts, regardless of sample type [Citation7]. Replication across studies is an essential component of genome-wide testing and whole cord blood and buffy coat are compatible sample types.
One limitation to our study was the relatively small sample size with only eight buffy coat and whole cord blood pairs, which limits power to detect small differences that may exist. The pairing of samples types by individual subject alleviates some of this weakness. Pairing also controls for other factors that impact DNA methylation, such as gestational age. Our samples were limited to full term cord blood, and preterm infants display altered cord blood DNA methylation and differences in cell type composition [Citation12]. Future work should compare DNA methylation of blood sample types in preterm infants. The Illumina EPIC array is a widely used platform, and its use in this study offers coverage across the genome at approximately 850,000 sites. DNA was isolated in all samples using the DNeasy Blood kit (Qiagen), but use of different methods for isolation may impact DNA methylation. Another potential limitation of this study is that we did not evaluate other blood sample processing methods, such as using Ficoll density centrifugation to isolate cord blood mononuclear cells (CBMCs) [Citation19]. Since Ficoll separates out granulocytes, we hypothesize that these sample types would have different cell type distributions and methylation measurements. Further testing should investigate CBMCs relative to whole cord blood and buffy coat.
Our results suggest that DNA methylation measurements from buffy coat and whole cord blood samples are highly comparable on the new EPIC array platform. DNA methylation was highly correlated between the two sample types, and principal components of methylation data reveal clustering by sample pairs. Differences between whole cord blood and buffy coat are much smaller than the inter-individual differences, and the frequency of cell types are not significantly different by sample processing. Future studies, and those that have already done so, can thus accurately combine and compare results from buffy coat and whole cord blood samples.
Disclosures of interest
The authors report no conflict of interest.
Suppl-mat-Cord_blood_buffy_coat_DNA_methylation_-Dou.rar
Download (70.9 MB)Acknowledgments
We thank the EARLI study participants and staff. We thank the Johns Hopkins Biological Repository (JHBR) for archiving and processing the samples. We thank the University of Michigan Epigenetics and DNA Sequencing Cores for conducting the DNA methylation measurements.
Additional information
Funding
Related Research Data
References
- Bakulski KM, Fallin MD. Epigenetic epidemiology: Promises for public health research. Environ Mol Mutagen. 2014;55(3):171–183. doi:10.1002/em.21850. PMID:24449392
- Michels KB. The promises and challenges of epigenetic epidemiology. Exp Gerontol. 2010;45(4):297–301. doi:10.1016/j.exger.2009.12.011. PMID:20034553
- Mill J, Heijmans BT. From promises to practical strategies in epigenetic epidemiology. Nat Rev Genet. 2013;14(8):585–594. doi:10.1038/nrg3405. PMID:23817309
- Ladd-Acosta C. Epigenetic signatures as biomarkers of exposure. Curr Environ Health Rep. 2015;2(2):117–125. doi:10.1007/s40572-015-0051-2. PMID:26231361
- Hodyl NA, Roberts CT, Bianco-Miotto T. Cord blood dna methylation biomarkers for predicting neurodevelopmental outcomes. Genes. 2016;7(12). doi:10.3390/genes7120117. PMID:27918480
- Küpers LK, Xu X, Jankipersadsing SA, et al. Dna methylation mediates the effect of maternal smoking during pregnancy on birthweight of the offspring. International Journal of Epidemiology. 2015;44(4):1224–1237. doi:10.1093/ije/dyv048. PMID:25862628
- Joubert BR, Felix JF, Yousefi P, et al. Dna methylation in newborns and maternal smoking in pregnancy: Genome-wide consortium meta-analysis. Am J Hum Genet. 2016;98(4):680–696. doi:10.1016/j.ajhg.2016.02.019. PMID:27040690
- Bakulski KM, Lee H, Feinberg JI, et al. Prenatal mercury concentration is associated with changes in dna methylation at tceanc2 in newborns. Int J Epidemiol. 2015;44(4):1249–1262. doi:10.1093/ije/dyv032. PMID:25906783
- Kaushal A, Zhang H, Karmaus WJJ, et al. Genome-wide dna methylation at birth in relation to in utero arsenic exposure and the associated health in later life. Environ Health. 2017;16(1):50. doi:10.1186/s12940-017-0262-0. PMID:28558807
- Solomon O, Yousefi P, Huen K, et al. Prenatal phthalate exposure and altered patterns of dna methylation in cord blood. Environ Mol Mutagen. 2017. doi:10.1002/em.22095. PMID:28556291
- Caramaschi D, Sharp GC, Nohr EA, et al. Exploring a causal role of dna methylation in the relationship between maternal vitamin b12 during pregnancy and child's iq at age 8, cognitive performance and educational attainment: A two-step mendelian randomization study. Hum Mol Genet. 2017. doi:10.1093/hmg/ddx164. PMID:28453778
- de Goede OM, Lavoie PM, Robinson WP. Cord blood hematopoietic cells from preterm infants display altered dna methylation patterns. Clin Epigenetics. 2017;9:39. doi:10.1186/s13148-017-0339-1. PMID:28428831
- Agha G, Hajj H, Rifas-Shiman SL, et al. Birth weight-for-gestational age is associated with dna methylation at birth and in childhood. Clin Epigenetics. 2016;8:118. doi:10.1186/s13148-016-0285-3. PMID:27891191
- Baschat AA, Gungor S, Kush ML, et al. Nucleated red blood cell counts in the first week of life: A critical appraisal of relationships with perinatal outcome in preterm growth-restricted neonates. Am J Obstet Gynecol. 2007;197(3):286.e281–288. doi:10.1016/j.ajog.2007.06.020.
- Bakulski KM, Feinberg JI, Andrews SV, et al. Dna methylation of cord blood cell types: Applications for mixed cell birth studies. Epigenetics. 2016;11:354–362.
- de Goede OM, Razzaghian HR, Price EM, Jones MJ, et al. Nucleated red blood cells impact dna methylation and expression analyses of cord blood hematopoietic cells. Clin Epigenetics. 2015;7(1):95. doi:10.1186/s13148-015-0129-6. PMID:26366232
- Gervin K, Page CM, Aass HC, et al. Cell type specific dna methylation in cord blood: A 450k-reference data set and cell count-based validation of estimated cell type composition. Epigenetics. 2016;11(9):690–698. doi:10.1080/15592294.2016.1214782. PMID:27494297
- Jaffe AE, Irizarry RA. Accounting for cellular heterogeneity is critical in epigenome-wide association studies. Genome biology. 2014;15(2):R31–R31. doi:10.1186/gb-2014-15-2-r31. PMID:24495553
- Fuss IJ, Kanof ME, Smith PD, et al. Isolation of whole mononuclear cells from peripheral blood and cord blood. Hoboken, NJ, USA: John Wiley & Sons, Inc; 2009. p. 7.1.1–7.1.8.
- Newschaffer CJ, Croen LA, Fallin MD, et al. Infant siblings and the investigation of autism risk factors. J Neurodevelop Disorders. 2012;4(1):7–7. doi:10.1186/1866-1955-4-7. PMID:22958474
- Aryee MJ, Jaffe AE, Corrada-Bravo H, et al. Minfi: A flexible and comprehensive bioconductor package for the analysis of infinium dna methylation microarrays. Bioinformatics. 2014;30(10):1363–1369. doi:10.1093/bioinformatics/btu049. PMID:24478339
- Triche TJ, Weisenberger DJ, Van Den Berg D, Laird PW, et al. Low-level processing of illumina infinium dna methylation beadarrays. Nucleic acids research. 2013;41(7):e90–e90. doi:10.1093/nar/gkt090. PMID:23476028
- Pidsley R, Zotenko E, Peters TJ, et al. Critical evaluation of the illumina methylationepic beadchip microarray for whole-genome dna methylation profiling. Genome biology. 2016;17(1):208–208. doi:10.1186/s13059-016-1066-1. PMID:27717381
- Du P, Zhang X, Huang CC, et al. Comparison of beta-value and m-value methods for quantifying methylation levels by microarray analysis. BMC Bioinformatics.2010;11:587. doi:10.1186/1471-2105-11-587. PMID:21118553
- Xu Z, Niu L, Li L, et al. 2016; Enmix: A novel background correction method for illumina humanmethylation450 beadchip. Nucleic Acids Res. 2010;44(3):e20. doi:10.1093/nar/gkv907.
- Giavarina D. Understanding bland altman analysis. Biochemia medica. 2015;25(2):141–151. doi:10.11613/BM.2015.015. PMID:26110027
- Ritchie ME, Phipson B, Wu D, et al. Limma powers differential expression analyses for rna-sequencing and microarray studies. Nucleic acids research. 2015;43(7):e47–e47. doi:10.1093/nar/gkv007. PMID:25605792
- Peters TJ, Buckley MJ, Statham AL, et al. De novo identification of differentially methylated regions in the human genome. Epigenetics Chromatin. 2015;8:6. PMID:25972926
- Gurnot C, Martin-Subero I, Mah SM, et al. Prenatal antidepressant exposure associated with cyp2e1 dna methylation change in neonates. Epigenetics. 2015;10(5):361–372. doi:10.1080/15592294.2015.1026031. PMID:25891251
- Hillman SL, Finer S, Smart MC, et al.; Novel dna methylation profiles associated with key gene regulation and transcription pathways in blood and placenta of growth-restricted neonates. Epigenetics.2015;10(1):50–61. doi:10.4161/15592294.2014.989741. PMID:25496377
- Kwon EJ, Lee HA, You YA, et al. Dna methylations of mc4r and hnf4α are associated with increased triglyceride levels in cord blood of preterm infants. Medicine (Baltimore). 2016;95(35):e4590. doi:10.1097/MD.0000000000004590. PMID:27583872
- Non AL, Binder AM, Kubzansky LD, et al. Genome-wide dna methylation in neonates exposed to maternal depression, anxiety, or ssri medication during pregnancy. Epigenetics. 2014;9(7):964–972. doi:10.4161/epi.28853. PMID:24751725
- Soubry A, Murphy SK, Wang F, et al. Newborns of obese parents have altered dna methylation patterns at imprinted genes. Int J Obes (Lond). 2015;39(4):650–657. doi:10.1038/ijo.2013.193. PMID:24158121
- Cardenas A, Rifas-Shiman SL, Agha G, et al. Persistent dna methylation changes associated with prenatal mercury exposure and cognitive performance during childhood. Sci Rep. 2017;7(1):288. doi:10.1038/s41598-017-00384-5. PMID:28325913
- Moran S, Arribas C, Esteller M. Validation of a dna methylation microarray for 850,000 cpg sites of the human genome enriched in enhancer sequences. Epigenomics. 2016;8(3):389–399. doi:10.2217/epi.15.114. PMID:26673039