
ABSTRACT
Gene regulatory analysis of highly diverse human tissues in vivo is essentially constrained by the challenge of performing genome-wide, integrated epigenetic and transcriptomic analysis in small selected groups of specific cell types. Here we performed genome-wide bisulfite sequencing and RNA-seq from the same small groups of bronchial and alveolar cells isolated by laser capture microdissection from flash-frozen lung tissue of 12 donors and their peripheral blood T cells. Methylation and transcriptome patterns differed between alveolar and bronchial cells, while each of these epithelia showed more differences from mesodermally-derived T cells. Differentially methylated regions (DMRs) between alveolar and bronchial cells tended to locate at regulatory regions affecting promoters of 4,350 genes. A large number of pathways enriched for these DMRs including GTPase signal transduction, cell death, and skeletal muscle. Similar patterns of transcriptome differences were observed: 4,108 differentially expressed genes (DEGs) enriched in GTPase signal transduction, inflammation, cilium assembly, and others. Prioritizing using DMR-DEG regulatory network, we highlighted genes, e.g., ETS1, PPARG, and RXRG, at prominent alveolar vs. bronchial cell discriminant nodes. Our results show that multi-omic analysis of small, highly specific cells is feasible and yields unique physiologic loci distinguishing human lung cell types in situ.
Introduction
Epigenetic regulation is central to development, aging, and disease processes in mammalian organisms, including humans. Dynamic changes in the epigenome play a critical role in establishing and maintaining cellular phenotypes during differentiation. Advances in high-throughput sequencing have enabled the study of various aspects of the epigenome, including DNA methylation and chromatin status, in a genome-wide manner, which in turn allows an integrated analysis of normal and disease-related processes. Several studies have now been conducted providing comprehensive surveys of the human methylome, often integrated with messenger RNA sequencing (RNA-seq), to assess relationships between variation in the epigenome and transcriptome [Citation1,Citation2]. However, little is known about normal, in vivo methylomic differences between functionally distinct cell types within a given human tissue.
Accurate studies of epigenomic alterations in highly complex human tissues composed of multiple cell types is essentially constrained by the challenge of performing genome-wide, integrated epigenetic and transcriptomic analysis in small groups of specific cell types. Here we performed whole-genome bisulfite sequencing (WGBS) and RNA-seq from the same, 1,000-to-4,000 cell bronchial or alveolar epithelium samples, isolated by laser capture microdissection (LCM) from flash-frozen surgical normal lung tissue of 12 human donors (Materials and Methods). As a control we performed the same analysis on peripheral blood T lymphocytes from the same 12 individuals. We observed global differences between these three cell types in both DNA methylation and RNA expression levels, with the differences between the two lung cell types significantly fewer than those between each of these epithelial cell types and T lymphocytes (mesenchymal origin). These differentially methylated or expressed genes contribute to unique functional pathways specific to each of the cell types. Integration of the two data sets suggests a substantial number of regulatory hotspots distinguishing these cell types. These results provide a robust experimental approach to study global changes in DNA methylome and RNA transcriptome in vivo between cell types using only small collections of cells of interest.
Results
Overview of the approach
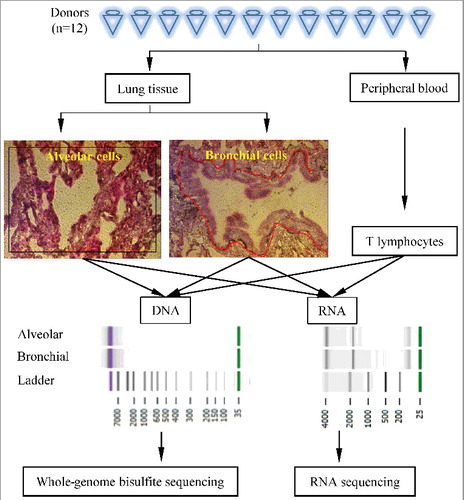
Our procedure to obtain genome-wide CpG methylation patterns and their corresponding gene expression profiles for the targeted cell types is schematically depicted in . For the isolation of small groups of bronchial and alveolar cells from frozen, heterogeneous human lung samples, we used a modified LCM procedure to optimize RNA quality (indicated by the RNA integrity number, RIN) from collected samples (Materials and Methods). Groups of approximately 1,000 to 4,000 cells were identified (), dissected, and deposited in small extraction buffer-containing tubes. Subsequently, both DNA and RNA were extracted from the same samples. also shows typical patterns after agarose gel electrophoresis indicating the high quality of the nucleic acids extracted in this way. The success rate of obtaining both good quality RNA, i.e., RIN>7, and DNA, i.e., little or no degradation, from a given LCM sample was approximately 75%. Peripheral blood T lymphocytes of the same donors were isolated using the Pan T Cell Isolation Kit (Miltenyi Biotec, Inc.) from peripheral blood mononuclear cells (PBMCs) and subjected to the same DNA and RNA isolation protocols. Libraries were prepared for WGBS and RNA-seq using amplification-based procedures (Materials and Methods) and sequenced using Illumina sequencing. Tables S1 and S2 provide the sequencing statistics of WGBS and RNA-seq analysis, respectively.
Figure 1. Overview of the experimental approach. Schematic illustration of the experimental procedure. Alveolar and bronchial samples from Donor#11 were used as an example. LCM image under 40x and the circled parts are respective alveolar and bronchial cells selected for DNA and RNA extraction (circled) of sample.
Characteristics of DNA methylation profiles
For WGBS, in total, we sequenced on average 230 million 100 bp single-end reads per sample (Table S1) and covered, on average, 33.6, 30.7, and 38.3 million CpGs (Cs counted on both strands) in alveolar, bronchial, and T cells with average depths of single Cs at CpGs of 2.7×, 2.2×, and 2.7×, respectively. Sequencing data analyses, including quality control, trimming, alignment, and methylation calling are described in Materials and Methods. Using unsupervised clustering, samples were readily classified according to their cell types, with alveolar and bronchial epithelial cells showing more similar methylation patterns to each other than each compared to T cells (). Overall the genome of alveolar (66.9%) and bronchial (68.2%) cells displayed 3% and 4% lower methylation, respectively, than T cells (71.2%; P<0.01, paired t tests, two tailed; ). Of all CpGs covered, 10.5%, 9.9%, and 8.9% mapped to CpG-island (CGI) associated regions in alveolar, bronchial, and T cells, respectively, leaving the vast majority mapping to regions with lower CpG density.
Figure 2. DNA methylome profiles of alveolar, bronchial, and T cells. (a) Heatmap of 1,000 1-kb bins with the most variable methylation levels across all samples. A row represents one bin. A column represents a sample. (b) Genome-wide average methylation level in three group of samples, n = 12 for each cell type; error bars indicate s.d. (c) Methylation level in genome annotations, n = 12 for each cell type; error bars indicate s.d. (d) Distribution of methylation in the genome in 1-Mb non-overlapping bins. The figure was generated using OmicCircos [Citation32]. (e) Distribution of methylation in the chromosome 1 in 1-Mb non-overlapping bins.
![Figure 2. DNA methylome profiles of alveolar, bronchial, and T cells. (a) Heatmap of 1,000 1-kb bins with the most variable methylation levels across all samples. A row represents one bin. A column represents a sample. (b) Genome-wide average methylation level in three group of samples, n = 12 for each cell type; error bars indicate s.d. (c) Methylation level in genome annotations, n = 12 for each cell type; error bars indicate s.d. (d) Distribution of methylation in the genome in 1-Mb non-overlapping bins. The figure was generated using OmicCircos [Citation32]. (e) Distribution of methylation in the chromosome 1 in 1-Mb non-overlapping bins.](/cms/asset/fda7a210-0fb4-4f9d-a59b-ca063451107b/kepi_a_1441650_f0002_oc.jpg)
To investigate DNA methylation status in different genomic features, we collected annotation from multiple resources described in Table S3. Consistent with previous reports [Citation3], we observed the lowest methylation level (13.4-20.0%) in these non-malignant cells in CGIs and 5′UTRs, moderate methylation level (38.6–55.4%) in transcription factor (TF) binding regions, DNase hypersensitive regions, promoters, and exons, and high methylation level (70.6-86.1%) in introns and repeat regions (). We then compared genome-wide DNA CpG methylation patterns of bronchial and alveolar cells with those in T lymphocytes. Alveolar and bronchial cells displayed more similarity in methylation pattern across the genome as compared to each of these cell types with T cells ().
We further identified differentially methylated regions (DMRs) using a sliding window approach with 1 kb window width and 500 bp step size [Citation4,Citation5]. Bins with FDR<0.05 by paired two-tailed t tests and differences in methylation level >10% were considered as DMRs (Materials and Methods) [Citation6–Citation8]. shows the frequencies of DMRs for each pair-wise comparison of the three cell types. Between alveolar and bronchial cells a total of 6.4% of the genomes are DMRs, with T cells differing by 11.3% and 19.1% of the genome from alveolar and bronchial cells, respectively. The DMRs are preferably enriched at proximal transcription regulatory regions, such as DNase hypersensitive regions, TF binding regions, and promoters (on average 1.2, 1.4, and 1.2 times higher than expected, respectively; all P values <1 × 10⁻⁸, Fisher's exact test after Bonferroni correction; ).
Figure 3. Differentially methylated regions. (a) Radar plot of frequencies of DMRs, where each isopleth gives percent of DMRs out of the entire genome. (b) Enrichment of DMRs on functional genomic features. (c) Genes associated with promoter DMRs. (d) GO biological process enrichment of promoter DMRs. The P value is corrected for multiple hypothesis testing using the Benjamini-Hochberg method and calculated using David tool [Citation9]. In the last two rows, “T” refers to T cells. “Lung > T” refers to promoter DMR genes show significant higher methylation in both comparisons between Alveolar and T cells and between Bronchial and T cells. (e) Example of DMR region. Chr10:79,610,000-79,700,000. Red, blue, and grey dots represents samples from alveolar, bronchial, and T cells, respectively. DLG5 is in reverse orientation and promoters are considered +1500 to −500 from transcription start sites for all of its transcripts. Two regions highlighted in yellow indicate DMRs. The figure is generated using “Gviz” package in R. (f) Heatmap of observed/expected number of DMRs in target regions of TFs. Top 40 TFs most variable changes were plotted, and see Figure S1 for the full heatmap.
![Figure 3. Differentially methylated regions. (a) Radar plot of frequencies of DMRs, where each isopleth gives percent of DMRs out of the entire genome. (b) Enrichment of DMRs on functional genomic features. (c) Genes associated with promoter DMRs. (d) GO biological process enrichment of promoter DMRs. The P value is corrected for multiple hypothesis testing using the Benjamini-Hochberg method and calculated using David tool [Citation9]. In the last two rows, “T” refers to T cells. “Lung > T” refers to promoter DMR genes show significant higher methylation in both comparisons between Alveolar and T cells and between Bronchial and T cells. (e) Example of DMR region. Chr10:79,610,000-79,700,000. Red, blue, and grey dots represents samples from alveolar, bronchial, and T cells, respectively. DLG5 is in reverse orientation and promoters are considered +1500 to −500 from transcription start sites for all of its transcripts. Two regions highlighted in yellow indicate DMRs. The figure is generated using “Gviz” package in R. (f) Heatmap of observed/expected number of DMRs in target regions of TFs. Top 40 TFs most variable changes were plotted, and see Figure S1 for the full heatmap.](/cms/asset/f92b7b70-be83-4d34-945c-51b61f8bef38/kepi_a_1441650_f0003_oc.jpg)
We took the promoter-associated DMRs, e.g., DMRs overlapping with proximal promoter regions (−1500 to +500 from transcription start sites), and matched them to their corresponding downstream genes (Materials and Methods). Similar to the total numbers of DMRs, alveolar and bronchial cells showed dramatic differences from T cells, but the difference between alveolar and bronchial cells was also substantial (). We found 4,360 genes display higher promoter methylation in alveolar cells compared to bronchial cells (Table S4); conversely, fewer genes (1,126 genes) showed lower promoter methylation in alveolar than in bronchial cells. Using gene ontology (GO) enrichment analysis with David [Citation9] (Materials and Methods), we found that alveolar cells displayed less promoter methylation in genes governing blood vessel development, tube development, and skeletal system development than bronchial cells, whereas bronchial cells were less methylated in promoters of genes governing GTPase, Rho, or Ras signaling, and cell death pathways ( and Table S5). Notable individual genes involved in signal transduction, growth regulation, or epithelial-specific function showing promoter DMRs between alveolar and bronchial epithelia included DLG5, an extracellular signal transmitter via adherens junctions/cytoskeleton ( and Table S4); DMAP, a DNMT-associated protein; PTPDC1, a regulatory component of signal transduction and cell cycle; PPARG, a member of the peroxisome proliferator-activated receptor; RXRG, a member of the retinoid X receptor (RXR) family of nuclear receptors that are involved in mediating the antiproliferative effects of retinoic acid (RA) (Table S4).
When compared with T cells, we identified 870 genes with higher promoter methylation in both alveolar and bronchial cells, and many more genes (5,238 genes; Table S4) with lower promoter methylation. GO enrichment analysis indicates that lymphocytic activation and immune response pathways had lower promoter methylation than T cells (), while promoters of genes related to adhesion, response to organic substances, and others were generally less methylated in both alveolar and bronchial cells ( and Table S5). We found promoter hypomethylation of immune-related genes, such as LILRA1 and LILRA2 (regulatory immune-receptors) and LGMN (processors of bacterial peptides), in T cells. Reciprocally, both alveolar and bronchial cell promoter hypomethylation were observed in epithelial cell function genes, such as RND2, a GTPase signal transduction protein, and ADAMTSL4, which is involved in adhesion and angiogenesis.
We also analyzed the enrichment of DMRs on TF target regions. Based on 161 TFs analyzed, we found that alveolar and bronchial cells show similar patterns of differences compared with T cells (Figure S1). shows the top 40 most variable TFs in different paired-wise comparisons. Lower promoter methylation in T cells (compared with alveolar and bronchial cells) included examples such as TCF3, known to be involved in lymphopoiesis, IRF4, which regulates interferons/innate immunity, and RELA, which regulates NFK-Beta. Comparing alveolar and bronchial cells, we observed that there are more specific TFs with enriched DMRs on their target regions. Among them, those less methylated in alveolar cells included EZH2 a polycomb family member involved in maintaining transcriptional repression, and SUZ12 a zinc finger polycomb repressor. Those less methylated in bronchial cells included ESR1 estrogen receptor alpha, SMARCC1, a SWI/SNF helicase member regulating transcription, and ZNF217 a zinc finger protein.
Characteristics of transcriptome profiles
For RNA-seq, we sequenced 23 million 50-bp paired-end read pairs on average per sample (Table S2). Sequencing data analyses including quality control, alignment, and expression quantification are described in Materials and Methods. Fragments per kilobase of exon per million fragments mapped (FPKM) values of protein coding genes were estimated (Materials and Methods) [Citation10,Citation11]. After an additional quantile normalization that corrected some bias due to amplification from the very small amounts of input RNA [Citation12] (Figures S2a-c and S3a-c; Materials and Methods) samples clustered according to their cell types (). Therefore, these quantile-normalized FPKM values were used in the subsequent analyses.
Figure 4. Transcriptome profiles of alveolar, bronchial, and T cells. (a) Heatmap of 500 genes with the most variable expression across the cell types. A row represents a gene. (b) Overlap of DEGs in each pair-wise comparison. (c) GO biological process enrichment of DEGs. The P value is corrected for multiple hypothesis testing using the Benjamini-Hochberg method and calculated using David tool [Citation9]. In the last two rows, “T” refers to T cells. “Lung > T” refers to promoter DMR genes show significant higher methylation in both comparisons between Alveolar and T cells and between Bronchial and T cells.
![Figure 4. Transcriptome profiles of alveolar, bronchial, and T cells. (a) Heatmap of 500 genes with the most variable expression across the cell types. A row represents a gene. (b) Overlap of DEGs in each pair-wise comparison. (c) GO biological process enrichment of DEGs. The P value is corrected for multiple hypothesis testing using the Benjamini-Hochberg method and calculated using David tool [Citation9]. In the last two rows, “T” refers to T cells. “Lung > T” refers to promoter DMR genes show significant higher methylation in both comparisons between Alveolar and T cells and between Bronchial and T cells.](/cms/asset/5f2e08a3-5a70-4ad9-8c99-bdad1841278c/kepi_a_1441650_f0004_oc.jpg)
To discover differentially expressed genes (DEGs), we applied paired Wilcoxon Rank test, a non-parametric test allowing DEG calling without any assumption of distribution of the quantile-normalized FPKM values. Genes with fold change of FPKM >2 and FDR <0.05 were considered as DEGs (Materials and Methods, Figures S4a-c and S5a-c). Out of 12,780, 12,148, and 11,977 expressed protein-coding genes in alveolar, bronchial, and T cells, respectively. Substantial fractions showed differential expression between the cell types: 4,108 genes were DEGs between alveolar and bronchial cells, and 6,005, and 7,226 between alveolar and T cells, and bronchial and T cells, respectively ( and Table S6). We found 2,222 genes upregulated in alveolar cells compared with bronchial cells. Many of them are involved in signal transduction, growth regulation, or epithelial-specific function, e.g., HGF hepatocyte growth factor, FLT4, a tyrosine kinase receptor for VEGF related to lympogenesis, and PRKCQ, a protein kinase involved in NFK-B and AP-1 activation and T cell activation. A total of 1,886 genes were downregulated, e.g., EYA2, the silencing of which is implicated in pancreatic cancer, NTN1, which is implicated in cancer development, and ATP12A, which is involved in H+ and K+ exchange across cell membranes. GO enrichment analyses showed higher alveolar expression of inflammatory responses and positive regulation of GTPases and cell adhesion factor, while higher bronchial expression involved cilium assembly and smoothened signaling ( and Table S7). When compared with T cells, alveolar and bronchial cells have 1,667 genes upregulated and 2,637 genes downregulated. GO enrichment analyses showed higher alveolar and bronchial expression of cellular oxidant reduction, cell adhesion, and other pathways, and higher T cell expression of T cell activation, viral transcription, cellular response to DNA damage, and others ( and Table S7).
Integrated analyses of methylomes and transcriptomes
We observed significant overlap of promoter DMR genes and DEGs. As expected, this overlap was significantly enriched in canonical “methylation-down-expression-up-regulated” and “methylation-up-expression-down-regulated” pairs (on average 200% of the expected), and depleted in non-canonical “methylation-down-expression-down-regulated” pairs and “methylation-up-expression-up-regulated” pairs (on average 83% of the expected; , b).
Figure 5. Interactions between DMRs and DEGs. Number of overlapping promoter DMR genes and DEGs: (a) alveolar compared with bronchial cells and (b) alveolar and bronchial compared with T cells. RF: representation factor, i.e., the ratio of observed to expected number of genes. ** or *** indicate P<0.01 or 0.001, respectively, two-tailed hypergeometric test (http://nemates.org/MA/progs/overlap_stats.html). (c) The DEG-DMR GRN. Each node represents a gene, and a directed edge represents known TF->Target gene regulations. (d) The DEG GRN. A subnetwork of the DEG-DMR GRN with only DEGs included.
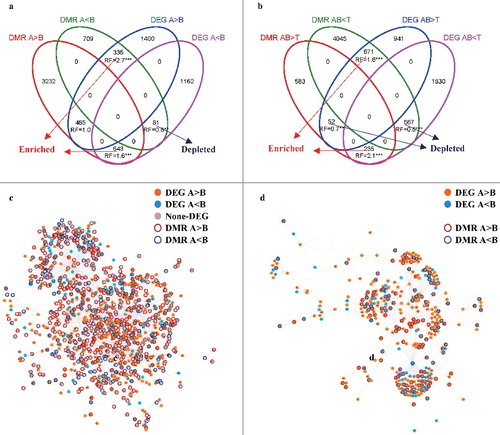
To better understand the complex regulatory changes in both methylome and transcriptome, we focused on the comparison between alveolar and bronchial cells, and integrated promoter DMR genes and DEGs into a gene-regulatory network (GRN; Materials and Methods). We constructed a general GRN for the human species based on published data and only kept interactions between regulators and targets with experimental validation and high confidence score defined by the RegNetwork database [Citation13]. Based on the observed DEGs and DMRs, a sub-network (DEG-DMR GRN) was constructed from the general GRN by trimming off genes that were not DEGs nor promoter DMR genes. The sub-network was completed by further trimming those genes that now no longer had connections. The final DEG-DMR GRN () is composed of 1,076 genes (600 DEGs, 720 promoter DMR genes). shows a subnetwork of the DEG-DMR GRN with only DEGs (DEG GRN).
We prioritized genes in the two GRNs by considering average ranking of their three centrality parameters, i.e., degree, betweenness, and eigenvector centralities (Table S8). The degree centrality reflects the direct number of connections of a gene to others, while betweenness and eigenvector centralities also reflect the gene's position in the network. Among the top network DMR-DEG coupling, TF genes were prominent, as expected (e.g., ETS1, TFAP2, SPII, AR, RARA, RARB, PPARG, and RXRG).
Discussion
This study represents one of the first direct genome-wide comparisons of gene regulatory networks in two prominent human lung cell types harvested in situ, both of which are implicated in myriad lung diseases, from chronic obstructive pulmonary disease to lung cancer, as well as in circulating T cells, known to be involved in both lung and non-lung disorders. The integrated analysis of genome-wide CpG methylome and transcriptome patterns in these two cell types has also not previously been reported at this level of histologic and genomic resolution in tandem, certainly not in human lung tissue-captured cells.
Compared to other methylation and expression databases, our use of LCM to partition lung compartments, and compare them to same-donor peripheral blood T cells likely is a large source of differences from current databases, particularly in lung. Previous reports about lung are mostly focused on differences between lung homogenates or samples derived from one cell type or tissue of donors with different phenotypes, e.g., lung cancer cases or controls [Citation14,Citation15], or smoking [Citation16,Citation17], and confined to one genomic platform, either methylome or transcriptome [Citation18].
In study design, we controlled for smoking (all former smokers), yet there was heterogeneity in age and lung cancer case-control status of donors. However, in these tissue-to-tissue comparisons within each of the 12 individual subjects, these exposure/demographic variations are obligately controlled by intra-individual matching—all three cell types were collected from the same donors and compared to each other in a paired way. Therefore, this cell type-to-cell type comparison is technically robust, even given the small sample size. However, biological conclusions regarding age, smoking, and cancer status, in the context of these types of genome surveys, must await much larger sample sizes.
We found that there were thousands of discriminant sites among the three cell types interrogated, with as expected the two lung cell types most similar, as compared to the mesenchymal-derived blood T-lymphocyte from the same donor. Lower methylation rates in the CGI and 5′UTR were notably concordant among the cell types, suggesting more broadly that methylation variation in chromatin in such TSS-proximate regions likely have general regulatory importance [Citation19,Citation20]. To some extent, DMRs preferably occurred at TF binding regions, open chromatin regions and promoters, suggesting important regulatory differences of the DNA methylome between cell types, while previously promoter methylation alterations studied alone have been compared between tissues in lung cancer patients [Citation21,Citation22].
The patterns of DMRs often were aligned with known cell type differences. Alveolar epithelial hypo-methylation was observed in PPARG, which has wide effects including heterodimerization with RXR, and in RXR itself, suggesting differentiation and growth regulation functions [Citation23]. Lower promoter methylation was observed in bronchial epithelia in DMAP, a DNMT-associated protein, DLG5, an extracellular signal transmitter via adherens junctions/cytoskeleton, and PTPDC1, a regulatory component of signal transduction and cell cycle. Differences between alveolar or bronchial epithelia and circulating T cells were even more prominent, reinforcing the view that cell embryologic origin and differentiation are likely regulated in part via DNA methylation [Citation24]. Comparing alveolar and bronchial cells, we noted DMRs enriched in TF target regions on their target regions, an already well-known site of cell type-specific regulation [Citation25].
For DEGs, our results differ from other public repositories or publications [Citation15–Citation17] for many reasons: lung tissue compartment partitioning is rarely done at this scale; we focused on normal lung cells; and the three cell types were collected from the same donors. Because we performed an intra-individual, tissue-to-tissue comparison, our gene lists largely differ from those from the brushed bronchial cell transcriptome studies that compare different donor phenotypes (lung cancer cases versus controls). For example, Spira et al. compared major airway bronchial cells from individuals with cancer to those from individuals without cancer [Citation17], while we interrogated deep lung alveolar and bronchial cells from the same individuals. In this sense, our datasets are unique.
Our integrative analysis of methylome and transcriptome using the GRN allowed us to prioritize and identify key regulators of these differences. Notably central in the DMR-DEG network, the gene with the highest rank in our list is ETS Proto-Oncogene 1 (ETS1). This gene is known to be expressed in bronchial epithelium (http://www.proteinatlas.org/ENSG00000134954-ETS1/tissue/lung). Its protein functions as either activator or repressor of transcription of numerous genes, and is involved in development, cell senescence and death, and tumorigenesis [Citation26]. PPARG and RXRG are also among the most prioritized genes. It has been reported that PPAR-RXR heterodimers are important regulators in lung development [Citation23].
How much precision (promoter, promoter compartment, or down to single CpG residue resolution) optimizes the DMR-DEG relationship remains unclear. In an earlier study [Citation25], we have found that details of 5-methylcytosine position and topologic pattern, as well as CpG density, even down to single CpG residue, can impact on transcription. Hence, given likely residual heterogeneity in the cell types captured in LCM, our mean 2–3× depth was likely inadequate to refine the DMR-DEG relationship further in this study.
The strengths of this study include the intra-individual tissue-to-tissue comparisons, the added precision of laser capture microdissection for this complex tissue, and use and integration of epigenome and transcriptome. However, precision of microdissection may not be perfect, particularly for the complex multi-cell type that is the alveolus, hence the likely inadequate refinement of the DMR-DEG relationship.
In summary, our present study of two specific cell types isolated from frozen human lung tissue provides the first integrated analysis of CpG methylome and transcriptome from the same individual. Gene functional compartment analysis confirms the relative under-methylation of CGIs and 5′UTRs. Overall, DMRs and DEGs do reflect the epithelial versus immune function of the respective cell types. Many TF binding sites are differentially methylated in each cell type, partly underlying some of these functional differences. The present work provides a model readily applicable to human tissues and organs other than lung, and can be easily scaled up to further translational hypothesis testing on clinical factors such as age, smoking, and cancer case-control status.
Materials and methods
Patient recruitment and sample collection
Twelve consenting former smoking individuals undergoing resectional surgery for clinically suspected lung cancer were enrolled under a protocol approved by the Einstein-Montefiore institutional review board (IRB). Lung tissue resection samples were visually divided into tumor and non-tumor (far-adjacent >3 cm from tumor) in a pathology cutting room immediately adjacent to the operating room and partitioned for research purposes. The assigned clinical surgical pathologist confirmed the diagnosis of lung cancer, per clinical routine, and classified the samples as adenocarcinoma, squamous cell carcinoma, mixed non-small cell carcinoma, or benign process of lung, according to the 2007 ATS/ERS/IASLC histologic classification of lung and pleural tumors and recent updates. The study exclusively focused on non-malignant lung tissues (non-tumor tissues); the tumors/cancers were not interrogated.
Tissue handling and laser capture microdissection (LCM) of human lung
On receipt form the operating room, the freshly resected lung tissues were promptly embedded in Tissue-Tek optimal cutting temperature medium (Sakura Finetek USA, Inc.), and immediately snap frozen in liquid nitrogen within 15–20 minutes of blood supply ligation, and stored at −170°C until analysis. The frozen lung tissue was subsequently subjected to frozen microtome sectioning (thickness: 8 um) at −20°C, using a refrigerated cryostat, the sections were mounted on PEN membrane slide (Applied Biosystems, Catalog number: LCM0522), and the slides with sections were stored on dry ice. The slide-mounted frozen sections were then fixed by placement in 75% ethanol for 30 sec, and then were immediately stained for 1 min with staining solution (staining solution: 2.8% cresyl violet, 0.15% eosin Y, and 70% ethanol), and were dehydrated by a series of 75% ethanol (30 sec), 75% ethanol (20 dips), 95% ethanol (30 s), 100% ethanol (1 min), 100% ethanol (1 min), and xylene (5 min) treatments. The above procedure involves the use of high concentration of ethanol designed to prevent the activity of RNase, and ensure high quality RNA (RIN>7) upon extraction from the LCM samples. The sections were completely air-dried within 2–5 min and immediately subject to LCM. The bronchial and alveolar cell groups were obtained by direct optical visualization by a skilled operator and captured using the Leica laser microdissection system, all from the sections of normal lung tissues. Microdissected specimens were dropped into a combined DNA/RNA lysis buffer (ZR-Duet™ DNA/RNA MiniPrep, Zymo research, Catalog number: D7001), and stored at −80°C until use.
Collecting T lymphocytes from blood
Peripheral blood T lymphocytes were isolated using the Pan T Cell Isolation Kit (Miltenyi Biotec, Inc.) from peripheral blood mononuclear cell (PBMC) by the Molecular Cytogenetic Core of Department of Genetics, Albert Einstein College of Medicine.
DNA and RNA extraction
DNA and RNA were extracted using ZR-Duet™ DNA/RNA MiniPrep (Zymo Research). RNA quality was assessed by Agilent 2100 Bioanalyzer. RNA samples with a RIN score >7 were considered as qualified. Only LCM samples with both good quality DNA and RNA were used for sequencing.
Amplification and library preparation
Whole-genome bisulfite library preparations were carried out as follows. DNA (100 to 200 pg) was bisulfite-converted and subjected to library preparation using the Pico Methyl-Seq™ Library Prep Kit (Zymo Research) according to the instructions of the supplier. Agilent 2100 Bioanalyzer High-Sensitivity DNA chips were used for the quality assessment of the libraries. The quantity of each sequencing library was measured with a Qubit fluorometer. RNA-seq libraries were created by first making cDNAs using the SMART Seq v4 Ultra Low Input kit (Clontech, Mountain View CA, USA) First Strand synthesis was done using 500 pg of RNA; full-length ds cDNA amplification by LD-PCR for 15 cycles; amplified cDNA was purified with Agencourt AMPure XP kit(Beckman Coulter, Brea, Ca). The amplified cDNAs were made into libraries at the New York Genome Center using KAPA Hyper (KAPABiosystems, Wilmington, MA)
Whole-genome bisulfite sequencing
Amplified libraries were validated and quantified on Bioanalyzer High Sensitivity DNA Chips and underwent 100-bp single-end sequencing on Illumina HiSeq2500 systems by the Epigenomics Core facility at The Albert Einstein College of Medicine. We sequenced the samples of 12 individuals (12 alveolar, 12 bronchial and 12 T cell samples).
WGBS data processing and sequence alignment
We applied a standard data processing pipeline for bisulfite sequencing as previously used [Citation5]. Raw sequence reads were subjected to quality control using FastQC, and quality-trimmed using trim galore v0.3.3 with default parameters except additional trimming of the first four and last one base pairs of a read due to abnormal GC content. Trimmed sequences were aligned to the human reference genome (GRCh37.73) using Bismark 0.10.0 and Bowtie2 2.1.0. Sequence duplicates were removed and single CpG methylation was called using Bismark. Table S1 shows a summary of WGBS.
Detecting differentially methylated regions
We estimated CpG methylation variations using sliding windows (bins) of 1 kb width and 500 bp in step size similar to Gravina S et al. [Citation5]. This procedure of normalizing and quantifying methylation level has been often applied to WGBS studies [Citation4,Citation5,Citation8]. Bins covering at least 5 CpGs across all 36 samples were used in the analysis. The methylation frequency of a bin in one sample was estimated based on a Bayesian binomial distribution, i.e., methylation level = (No. methylated reads + 1) / (No. total reads + 2). Paired two-tailed t test was used to test difference between each group of samples (n = 12 for each group), which is often used for identifying DMR [Citation6–Citation8]. P values were adjusted for multiple testing with Benjamini-Hochberg procedure using R [Citation27]. Bins with FDR<0.05 and differences in methylation level >10% are considered as DMRs. Genes are considered as promoter DMR genes when its promoter overlaps with at least one DMR bin and if overlaps with multiple DMR bins, the directions of methylation changes in these DMR bins are consistent.
Messenger RNA sequencing
The RNA-seq libraries were quality controlled on a Bioanalyzer and underwent 50-bp paired-end sequencing on the Illumina HiSeq2500 system at the New York Genome Center.
RNA-seq data processing and sequence alignment
The RNA-seq data processing follows one of the typical procedures reviewed by Conesa et al. [Citation10]. Breifly, reads from RNA-seq were subjected to quality control using FastQC, and aligned to human reference genome (GRCh37.73) using TopHat v2.1.1 procedure with bowtie2 v2.2.3 [Citation28,Citation29]. Duplicated reads were discovered using Picard and removed. Gene annotations (gtf file; GRCh37.73) were obtained from Ensembl (ftp.ensembl.org under /pub/release-73/gtf/homo_sapiens). FPKM values of genes were estimated using cufflinks v2.2.1 [Citation28]. FPKM is a quantification of gene expression level after normalizing sequencing depth and gene length. Protein coding genes were included in downstream analyses.
Normalization of expression values
We first compared transcriptome of samples in each of three groups pair-wise, and noticed that for some samples there are biases in FPKM values at the transcriptome level (Figures S2a-c). This is likely a result of amplification bias in amplifying cDNA before library construction (we amplified cDNA from 1,000-4,000 cells) [Citation30]. Therefore, we performed a quantile normalization of the entire dataset including all three sample groups using an R package “preprocessCore” [Citation12]. The quantile-normalized FPKM values show no such bias (Figures S3a-c) and were used for downstream analyses.
Detecting differentially expressed genes
Because existing software tools for DEG analysis often do not account for amplification bias, we used a non-parametric test (paired Wilcoxon signed rank test). Although this test is not the most powerful one, it can yield more reliable DEGs than commonly used software tools because it is completely robust to the assumption of distribution of the gene expression level. This is considered to be a more conservative test than tests with assumption of distribution (e.g., negative binomial distribution). Before testing, genes with a quantile-normalized FPKM value <1 were considered as not expressed and their expression values were reset to 0. After testing, P values were adjusted for multiple testing with Benjamini-Hochberg procedure using R [Citation27]. Genes with fold change >2 and false discovery rate (FDR) <0.05 were considered as DEGs (Figures S4 and S5).
Region definitions and genomic feature association
Human reference genome (GRCh37.73) was used in the analyses. Annotations including genes, CpG islands (CGI), DNase hypersensitive regions, transcription factor binding regions, and repeat regions are summarized in Table S3. A CGI shore is defined as 2 kb upstream or 2 kb downstream of a CGI. Promoter regions are defined as 1,500 bp upstream and 500 bp downstream of transcription start sites.
GO term enrichment of differentially methylated or expressed genes
Differentially methylated or expressed genes were tested for enrichment of gene ontology (GO) using David (v6.7) [Citation9]. Heatmaps of P values of GO enrichment were plotted using “gplots” package in R.
Gene regulatory networks
We constructed a GRN based on RegNetwork [Citation13]. Experimental validated interactions between regulators and targets with “high confidence score”, scored by RegNetwork, were kept. In the GRN, a node represents one gene and an edge represents a transcription factor to target gene interaction. Genes that were neither DEGs nor promoter DMR genes, and isolated genes were trimmed of the network to construct the DEG-DMR GRN using “igraph” package in R [Citation31]. For each gene (node), its degree, betweenness, and eigenvector centrality scores were calculated using “igraph”. We then prioritized the genes based on the average of ranks of the three centrality scores (Table S8), i.e., genes with highest centrality were assigned the highest priority.
Accession number
Raw sequencing data were accessible from SRA database (SRA ID: SRP130768).
Disclosure of potential conflicts of interest
X.D., M.L. and J.V. are co-founders of SingulOmics Corp. M.S. is the founder of Evergreen Biotech Group, Inc. Others declare no conflict of interest.
Authors' contributions
J.V., Y.S. and S.D.S. conceived this study and designed the experiments. M.S., M.L., R.T., S.G. and W.H. performed the experiments. X.D., S.Y., T.W., and Z.Z. analyzed the data. X.D., M.S., M.L., R.T., J.V., Y.S. and S.D.S wrote the manuscript.
2017EPI0254R-s03.pdf
Download PDF (636.6 KB)2017EPI0254R-s02.pdf
Download PDF (2.7 MB)Acknowledgments
The authors thank Shahina B. Maqbool from Epigenomics Core and Jidong Shan from Molecular Cytogenetic Core of Department of Genetics, Albert Einstein College of Medicine for providing sequencing and T cell isolation services.
Additional information
Funding
Related Research Data
References
- Lou S, Lee HM, Qin H, et al. Whole-genome bisulfite sequencing of multiple individuals reveals complementary roles of promoter and gene body methylation in transcriptional regulation. Genome Biol. 2014;15:408. https://doi.org/10.1186/s13059-014-0408-0. PMID:25074712
- Lim AS, Srivastava GP, Yu L, et al. 24-hour rhythms of DNA methylation and their relation with rhythms of RNA expression in the human dorsolateral prefrontal cortex. PLoS Genet. 2014;10:e1004792. https://doi.org/10.1371/journal.pgen.1004792. PMID:25375876
- Jones PA. Functions of DNA methylation: islands, start sites, gene bodies and beyond. Nat Rev Genet. 2012;13:484–492. https://doi.org/10.1038/nrg3230. PMID:22641018
- Ziller MJ, Gu H, Muller F, et al. Charting a dynamic DNA methylation landscape of the human genome. Nature. 2013;500:477–481. https://doi.org/10.1038/nature12433. PMID:23925113
- Gravina S, Dong X, Yu B, et al. Single-cell genome-wide bisulfite sequencing uncovers extensive heterogeneity in the mouse liver methylome. Genome Biol. 2016;17:150. https://doi.org/10.1186/s13059-016-1011-3. PMID:27380908
- Bock C. Analysing and interpreting DNA methylation data. Nat Rev Genet. 2012;13:705–719. https://doi.org/10.1038/nrg3273. PMID:22986265
- Robinson MD, Kahraman A, Law CW, et al. Statistical methods for detecting differentially methylated loci and regions. Front Genet. 2014;5:324. https://doi.org/10.3389/fgene.2014.00324. PMID:25278959
- Yu B, Dong X, Gravina S, et al. Genome-wide, single-cell DNA methylomics reveals increased non-CpG methylation during human oocyte maturation. Stem Cell Rep. 2017;9:397–407. https://doi.org/10.1016/j.stemcr.2017.05.026. PMID:28648898
- Huang da W, Sherman BT, Lempicki RA. Bioinformatics enrichment tools: paths toward the comprehensive functional analysis of large gene lists. Nucleic Acids Res. 2009;37:1–13. https://doi.org/10.1093/nar/gkn923. PMID:19033363
- Conesa A, Madrigal P, Tarazona S, et al. A survey of best practices for RNA-seq data analysis. Genome Biol. 2016;17:13. https://doi.org/10.1186/s13059-016-0881-8. PMID:26813401
- Trapnell C, Williams BA, Pertea G, et al. Transcript assembly and quantification by RNA-Seq reveals unannotated transcripts and isoform switching during cell differentiation. Nat Biotechnol. 2010;28:511–515. https://doi.org/10.1038/nbt.1621. PMID:20436464
- Bolstad B. preprocessCore: a collection of pre-processing functions. R package version 1.40.0, 2017. https://github.com/bmbolstad/preprocessCore.
- Liu ZP, Wu C, Miao H, et al. RegNetwork: an integrated database of transcriptional and post-transcriptional regulatory networks in human and mouse. Database: The Journal of Biological Databases and Curation. 2015;2015. https://doi.org/10.1093/database/bav095.
- Mullapudi N, Ye B, Suzuki M, et al. Genome wide methylome alterations in lung cancer. PLoS One. 2015;10:e0143826. https://doi.org/10.1371/journal.pone.0143826. PMID:26683690
- Silvestri GA, Vachani A, Whitney D, et al. A bronchial genomic classifier for the diagnostic evaluation of lung cancer. New Engl J Med. 2015;373:243–251. https://doi.org/10.1056/NEJMoa1504601. PMID:25981554
- Spira A, Beane J, Shah V, et al. Effects of cigarette smoke on the human airway epithelial cell transcriptome. Proc Natl Acad Sci U S A. 2004;101:10143–10148. https://doi.org/10.1073/pnas.0401422101. PMID:15210990
- Spira A, Beane JE, Shah V, et al. Airway epithelial gene expression in the diagnostic evaluation of smokers with suspect lung cancer. Nat Med. 2007;13:361–366. https://doi.org/10.1038/nm1556. PMID:17334370
- Lin J, Marquardt G, Mullapudi N, et al. Lung cancer transcriptomes refined with laser capture microdissection. Am J Pathol. 2014;184:2868–2884. https://doi.org/10.1016/j.ajpath.2014.06.028. PMID:25128906
- Leng S, Do K, Yingling CM, et al. Defining a gene promoter methylation signature in sputum for lung cancer risk assessment. Clinical Cancer Research: An Official Journal of the American Association for Cancer Research. 2012;18:3387–3395. https://doi.org/10.1158/1078-0432.CCR-11-3049. PMID:22510351
- Baylin SB, Belinsky SA, Herman JG. Aberrant methylation of gene promoters in cancer—concepts, misconcepts, and promise. J Natl Cancer Inst. 2000;92:1460–1461. https://doi.org/10.1093/jnci/92.18.1460. PMID:10995795
- Brock MV, Hooker CM, Ota-Machida E, et al. DNA methylation markers and early recurrence in stage I lung cancer. New Engl J Med. 2008;358:1118–1128. https://doi.org/10.1056/NEJMoa0706550. PMID:18337602
- Hulbert A, Jusue-Torres I, Stark A, et al. Early detection of lung cancer using DNA promoter hypermethylation in plasma and sputum. Clinical Cancer Research: An Official Journal of the American Association for Cancer Research. 2017;23:1998–2005. https://doi.org/10.1158/1078-0432.CCR-16-1371. PMID:27729459
- Simon DM, Mariani TJ. Role of PPARs and retinoid X receptors in the regulation of lung maturation and development. PPAR Res. 2007;2007:91240. https://doi.org/10.1155/2007/91240. PMID:17710236
- Smith ZD, Meissner A. DNA methylation: roles in mammalian development. Nat Rev Genet. 2013;14:204–220. https://doi.org/10.1038/nrg3354. PMID:23400093
- Han W, Shi M, Spivack SD. Site-specific methylated reporter constructs for functional analysis of DNA methylation. Epigenetics. 2013;8:1176–1187. https://doi.org/10.4161/epi.26195. PMID:24004978
- Dittmer J. The biology of the Ets1 proto-oncogene. Mol Cancer. 2003;2:29. https://doi.org/10.1186/1476-4598-2-29. PMID:12971829
- Benjamini Y, Hochberg Y. Controlling the false discovery rate – a practical and powerful approach to multiple testing. J Roy Stat Soc B Met. 1995;57:289–300.
- Trapnell C, Roberts A, Goff L, et al. Differential gene and transcript expression analysis of RNA-seq experiments with TopHat and Cufflinks. Nat Protoc. 2012;7:562–578. https://doi.org/10.1038/nprot.2012.016. PMID:22383036
- Langmead B, Salzberg SL. Fast gapped-read alignment with Bowtie 2. Nat Methods. 2012;9:357–359. https://doi.org/10.1038/nmeth.1923. PMID:22388286
- Grun D, van Oudenaarden A. Design and analysis of single-cell sequencing experiments. Cell. 2015;163:799–810. https://doi.org/10.1016/j.cell.2015.10.039. PMID:26544934
- Csardi G, Nepusz T. The igraph software package for complex network research. InterJournal. 2006; Complex Systems:1695.
- Hu Y, Yan C, Hsu CH, et al. OmicCircos: a simple-to-use R package for the circular visualization of multidimensional omics data. Cancer Inform. 2014;13:13–20. https://doi.org/10.4137/CIN.S13495. PMID:24526832