
ABSTRACT
DNA methylation can affect tissue-specific gene transcription in ways that are difficult to discern from studies focused on genome-wide analyses of differentially methylated regions (DMRs). To elucidate the variety of associations between differentiation-related DNA hypermethylation and transcription, we used available epigenomic and transcriptomic profiles from 38 human cell/tissue types to focus on such relationships in 94 genes linked to hypermethylated DMRs in myoblasts (Mb). For 19 of the genes, promoter-region hypermethylation in Mb (and often a few heterologous cell types) was associated with gene repression but, importantly, DNA hypermethylation was absent in many other repressed samples. In another 24 genes, DNA hypermethylation overlapped cryptic enhancers or super-enhancers and correlated with down-modulated, but not silenced, gene expression. However, such methylation was absent, surprisingly, in both non-expressing samples and highly expressing samples. This suggests that some genes need DMR hypermethylation to help repress cryptic enhancer chromatin only when they are actively transcribed. For another 11 genes, we found an association between intergenic hypermethylated DMRs and positive expression of the gene in Mb. DNA hypermethylation/transcription correlations similar to those of Mb were evident sometimes in diverse tissues, such as aorta and brain. Our findings have implications for the possible involvement of methylated DNA in Duchenne's muscular dystrophy, congenital heart malformations, and cancer. This epigenomic analysis suggests that DNA methylation is not simply the inevitable consequence of changes in gene expression but, instead, is often an active agent for fine-tuning transcription in association with development.
Introduction
DNA methylation is implicated in controlling expression of many differentiation-related genes in mammals [Citation1–Citation5]. Disease-linked or experimentally introduced methylation throughout CpG-rich, active promoters usually leads to cis-silencing of the previously active genes due to altered binding of certain transcription factors (TFs) and changes in modification of histones [Citation5–Citation8]. How much of a role promoter methylation has in establishing or maintaining gene repression during differentiation is still unclear. Recent findings about the prevalence of unstable antisense (AS) transcripts at active promoter regions [Citation9] and long non-coding RNA (lncRNA) genes near promoters [Citation10] demonstrate the need for more investigation of the roles that DNA methylation plays in modulating development-linked gene expression from the vicinity of promoters. Further confounding the analysis of the biological effects of differential DNA methylation on transcription is the finding that many changes in promoter methylation during development or oncogenesis do not correlate with changes in expression of the associated gene [Citation2,Citation7,Citation8].
The effects of DNA methylation on transcription are not always repressive. Gene-body methylation has been reported to be positively associated with gene expression in some genome-wide studies [Citation11,Citation12]. However, intragenic DNA methylation has also been negatively associated with transcription [Citation2]. Because of the presence of intragenic enhancers, cryptic promoters, alternative promoters, and highly cell type-specific effects [Citation13,Citation14], the effects of gene-body DNA methylation can be complicated [Citation5,Citation15]. The de novo DNA methyltransferase DNMT3B is specifically implicated in establishment of gene-body DNA methylation, and SETD2-mediated trimethylation of histone H3 at lysine 36 (H3K36me3; located in actively transcribed gene bodies downstream the 5’ end) can recruit DNMT3B for intragenic DNA methylation [Citation16,Citation17]. Intragenic DNA methylation may help regulate the choice of exon-intron boundaries during co-transcriptional splicing of pre-mRNAs [Citation18]. Importantly, DNA hypomethylation at intragenic and intergenic enhancers [Citation19], which are often bidirectionally transcribed to give short, transient enhancer RNAs (eRNAs) [Citation9], is critical to development-associated transcription control [Citation19].
Whole-genome studies have elucidated many important relationships between development-linked epigenetics and transcription [Citation2,Citation11,Citation12,Citation17,Citation20–Citation23]. However, such studies may miss some complicated, modest, or infrequent associations. Therefore, we investigated associations between myogenic differentially methylated regions (DMRs) at or near 94 genes and within their surrounding gene neighborhoods. In this study, untransformed human muscle progenitor cells, myoblasts (Mb) and myotubes (Mt), as well as skeletal muscle tissue (SkM) were compared with many dissimilar cell cultures or tissues. We focused on the SkM lineage because SkM normally contributes the most mass to the human body, plays a vital and dynamic role in many disparate bodily functions, is involved in many congenital and somatic diseases (including cancer), is subject to frequent postnatal repair, and has a major role in aging [Citation24–Citation26]. The genome-wide epigenetics specific to this dynamic tissue and to Mb and Mt are beginning to be studied in detail [Citation25,Citation27,Citation28]. The importance of DNA methylation in myogenesis was demonstrated in a study in which conditional knockout of one of the three DNA methyltransferase genes [Citation29], Dnmt3a, in the mouse SkM lineage resulted in decreased skeletal muscle mass and a loss of proliferation of muscle satellite cells in culture [Citation30]. Moreover, there is evidence that postnatal promoter methylation changes in SkM are involved in muscle physiology, as exemplified by a rat model of atrophy-disuse [Citation31]. Our study gives insights into how DNA methylation is associated with gene expression in normal human development, not only in the SkM lineage, but also in surprisingly diverse cell lineages that share DNA hypermethylation with myogenic cells in some gene regions or have opposite methylation patterns at other gene regions. Based upon our findings, we hypothesize that some of the ways that DNA methylation is implicated in fine-tuning gene expression do not fall within the conventional DNA methylation/repression or expression paradigms.
Results
Selection of a set of 94 genes for which myoblast-hypermethylation is associated with transcription
Instead of looking for overall trends of associations of DNA hypermethylation and gene expression in many different cell and tissue samples, we selected a moderately sized set of genes for detailed analysis of how myogenic DNA hypermethylation, cell type-specific chromatin marks, and cell type-specific transcription are correlated in ways that can explain functional relationships. We used available epigenomic and transcriptomic data for muscle progenitor cells (Mb and Mt) and 36 other cell cultures or tissue samples. Statistically significant DMRs and differentially methylated sites (DM sites) were determined from reduced representation bisulfite sequencing (RRBS) data for Mb plus Mt and 16 non-muscle cell cultures as described in Materials and Methods. For simplicity, we refer to Mb and Mt DMRs (which are very similar [Citation27]) as Mb DMRs. We found 1749 protein-coding RefSeq genes that are associated with 9592 hypermethylated DM sites and 552 genes that had at least four clustered Mb-hypermethylated sites. We then excluded 31 Mb-hypermethylated genes in the HOX clusters because they are multigenically regulated [Citation32]. We manually curated 280 of the remaining 521 genes to identify 94 that displayed a positive or negative relationship of Mb-hypermethylated DM sites to transcription and whose cluster of at least four statistically significant individual DM sites fit the definition of a statistically significant DMR [Citation33]. These genes and their DMRs are described in Supplementary Tables S1a-S4a. The biological relevance of these Mb cell culture-associated DMRs is evidenced by our finding that 73 of the 94 genes displayed both SkM and Mb hypermethylation and usually had a similar transcription status for the associated gene (Supplementary Tables S1b-S4b).
To validate that the choice of 94 genes was representative of the total set of 1749 Mb-hypermethylated genes, we demonstrated that the large and small gene sets exhibited similar overlap of Mb DM sites with ENCODE-derived chromatin states (Supplementary Figure 1). Using a hidden Markov Model and H3 lysine-4 tri- and mono-methylation (H3K4me3 and H3K4me1), H3K27 acetylation (H3K27ac), H3K36me3, H3K27me3, and H3K9me3 genome-wide profiles, these states had been determined as promoter chromatin (prom-chromatin), enhancer chromatin (enh-chromatin), actively transcribed chromatin downstream of the gene's 5’ end (txn-chromatin), polycomb-linked repressed chromatin (PcG-chromatin, H3K27me3 enriched), or heterochromatin (H3K9me3 enriched) [Citation21]. Chromatin segmentation state profiles also allowed us to verify that the relative steady-state RNA levels (RNA-seq) for the 94 genes in the different cell types were consistent with the presence of active prom-chromatin and txn-chromatin or with repressor-type chromatin. Therefore, we conclude that post-transcriptional control of RNA levels was not interfering with the analyses for this gene set. The chosen 94 genes were also shown to reflect the 1749-gene set in that both had strong overrepresentation of the gene ontology terms for sequence-specific DNA-binding proteins and developmental proteins. This was determined previously for all Mb hypermethylated sites [Citation27], and in this study, we showed that 48 of the 94 genes encode developmental TFs (Supplementary Tables S1a-S4a).
Eighteen genes displayed DNA hypermethylated DMRs only in the SkM lineage (Supplementary Tables S1a-S4a). Among the other 76 genes, we found considerable overrepresentation of several non-myogenic sample types sharing DNA hypermethylation with Mb, namely, osteoblasts, aorta, human mammary epithelial cells (HMEC), skin fibroblasts, and brain prefrontal cortex (29, 28, 21, 22, and 21 genes, respectively, see Supplementary Tables S1b-S4b). In comparison, skin, B-cell lymphoblastoid cell lines (LCLs), and small intestine samples exhibited hypermethylation at the Mb-hypermethylated DMRs at only 5, 4 and 2 genes, respectively. Surprisingly, 34 of the 94 Mb-hypermethylated genes are implicated in embryonic development of the neural system (Supplementary Tables S1a–S4a). Only 23 are linked to SkM development.
Most genes exhibiting hypermethylated DMRs and repression in myogenic cells were silenced in other cell types by DNA methylation-independent mechanisms
Like dense DNA methylation, H3K27me3, or H3K9me3 enrichment at core promoters is usually repressive [Citation21]. We determined whether or not promoter DNA hypermethylation is generally associated with gene repression among the 94 selected genes in Mb and the 37 other studied cell cultures or tissues. Thirty of the examined genes were repressed in Mb (Mb-hypermeth/repr genes; Supplementary Table S1 and Figures S2-S5). In 25 of these genes, the DMR was within 2 kb upstream or downstream of the transcription start site (TSS). The immediate TSS-downstream region was included because it often contained prom-chromatin and is implicated in repression by DNA hypermethylation [Citation1]. As expected, in a large percentage of these promoter-hypermethylated genes (∼70%), the DMR overlapped a CpG-dense region or CpG island (CGI) [Citation34]. However, only five of the 30 Mb-hypermeth/repr genes displayed DMR hypermethylation in most or all the cell cultures or tissues in which the DMR-associated gene was repressed (Supplementary Table S1a). LXN, which is one of the five genes, is of particular interest because the tight linkage of its repression to promoter hypermethylation is probably related to its unusual location. This small gene, which encodes an inflammation-associated carboxypeptidase inhibitor, is embedded in intron 13 of GFM1, a large constitutively expressed gene ( and Supplementary Table S1). LXN is silenced specifically in Mb and displays strong expression in the tested non-myogenic cell cultures. In Mb and Mt, the silenced and hypermethylated LXN promoter region is embedded in txn-chromatin rather than repressive chromatin ( and ), which would probably have interfered with expression of its host gene, GFM1.
Figure 1. LXN, a tissue-specific gene within a constitutively expressed gene, displays specific promoter repression and DNA hypermethylation but not repressive chromatin in Mb. (a) RefSeq gene structure [Citation34] for LXN and GFM1 (hg19, chr3:158,358,796-158,412,265) and statistically significant myogenic hypermethylated DMRs as determined by RRBS [Citation27]. (b) 18-State chromatin segmentation from RoadMap [Citation23,Citation34]. Prom, promoter; Enh, enhancer; Enh/Prom, both active promoter-type and enhancer-type histone modifications; Txn-chrom, actively transcribed type of chromatin; Repressed, enriched in H3K27me3 (weak, light gray; strong, dark gray) or H3K9me3 (violet). (c) CpG islands and examples of some of the RRBS DNA methylation data tracks with a key for the 11-state, semi-continuous color code [Citation27]. (d) Bisulfite-seq profiles with blue bars indicating regions with significantly lower methylation compared to the rest of the given genome [Citation23,Citation78]. (e) CTCF binding from ChIP-seq profiles. (f) Strand-specific RNA-seq profiles. Expr, expression; repr, repression; fib, fibroblasts; osteob, osteoblasts; PFC, prefrontal cortex; sm intes, small intestine. Blue highlighting, the region of myogenic or SkM DNA hypermethylation at the TSS.
![Figure 1. LXN, a tissue-specific gene within a constitutively expressed gene, displays specific promoter repression and DNA hypermethylation but not repressive chromatin in Mb. (a) RefSeq gene structure [Citation34] for LXN and GFM1 (hg19, chr3:158,358,796-158,412,265) and statistically significant myogenic hypermethylated DMRs as determined by RRBS [Citation27]. (b) 18-State chromatin segmentation from RoadMap [Citation23,Citation34]. Prom, promoter; Enh, enhancer; Enh/Prom, both active promoter-type and enhancer-type histone modifications; Txn-chrom, actively transcribed type of chromatin; Repressed, enriched in H3K27me3 (weak, light gray; strong, dark gray) or H3K9me3 (violet). (c) CpG islands and examples of some of the RRBS DNA methylation data tracks with a key for the 11-state, semi-continuous color code [Citation27]. (d) Bisulfite-seq profiles with blue bars indicating regions with significantly lower methylation compared to the rest of the given genome [Citation23,Citation78]. (e) CTCF binding from ChIP-seq profiles. (f) Strand-specific RNA-seq profiles. Expr, expression; repr, repression; fib, fibroblasts; osteob, osteoblasts; PFC, prefrontal cortex; sm intes, small intestine. Blue highlighting, the region of myogenic or SkM DNA hypermethylation at the TSS.](/cms/asset/3eda686d-ff7b-4648-b21b-81fe1aa31987/kepi_a_1445900_f0001_oc.jpg)
Repression without DNA methylation in non-myogenic samples was associated with PcG-chromatin for 23 of the 30 Mb-hypermeth/repr genes (Supplementary Table S1a). Some of these genes had gene neighbors that were preferentially expressed in myogenic cells, e.g., SIX3 and SIX2. SIX3 and SIX2 are 59 kb apart, although intergenic enh-chromatin in Mb that appears to be linked to SIX2 expression is only about 13 kb downstream of SIX3 (Supplementary Figure S2). SIX3 is silent in almost all studied myogenic and non-myogenic samples but is hypermethylated at DMRs upstream and downstream of the gene and within its single intron specifically in Mb, Mt, SkM, and aorta, all of which specifically express SIX2. Brain pre-frontal cortex DNA shares several of these hypermethylated SIX3 DMRs, although it does not express SIX2. Hypermethylation around SIX3 in pre-frontal cortex might be related to this gene's selective expression in basal ganglia of brain (Supplementary Figure S2a and c). Similar examples of neighboring pairs of a Mb-hypermeth/repr gene and a Mb preferentially expressed gene are SIX6 and SIX1; PNMA8B and PNMA8A; ZIC1 and ZIC4; HSD17B14 and PLEKHA4 (Supplementary Tables S1-S3; Supplementary Figure S3). Interestingly, SIX2 and ZIC1 genes themselves have a positive association of transcription with DNA methylation while their neighbors, SIX3 or ZIC4, have a negative association (Supplementary Figures S2 and S3).
Two of the Mb-hypermeth/repr genes NKX2-5 and IRX4 are expressed specifically in heart plus one or a few other tested cell or tissue types ( and Supplementary Table S1). In the case of NKX2-5, hypermethylated DMRs were seen in aorta and the HepG2 liver cancer cell line as well as in SkM and Mb. HepG2, like Mb, had barely detectable expression. The many other samples with little or no expression of this gene did not display these DMRs, but PcG-chromatin covered these regions. The DMRs in Mb, SkM, aorta, and HepG2 overlap a large region that in the highly expressing tissues, heart and spleen, displayed enh-chromatin interspersed with prom-chromatin (b). Such long regions rich in enh-chromatin are termed super-enhancers [Citation35] and had little DNA methylation in heart and spleen as well as in most non-expressing tissues (d). Eleven other Mb-hypermeth/repr genes also had hypermethylated DMRs in myogenic cells that overlapped enh-chromatin in some non-myogenic cell types in which these regions were not hypermethylated (, Repressed, light blue bar).
Figure 2. Cardiac TF-encoding NKX2-5 is repressed in many samples without DNA methylation but is repressed with DNA methylation in Mb, SkM, and aorta at a cryptic super-enhancer. (a) RefSeq structure for NKX2-5 and Mb-hypermethylated DMRs (chr5:172,654,786-172,675,423). (b) Chromatin state segmentation as in with the addition that aqua green segments denote enrichment in repressive H3K9me3 with low levels of H3K36me3 [Citation23]. (c) CpG islands, CpGs, and examples of RRBS tracks for normal cell cultures and the HepG2 liver cancer cell line. (d) Bisulfite-seq profiles as in with additional bisulfite-seq tracks for other samples (shown in the dense configuration) to indicate the consistency of the SkM- and aorta-specific hypermethylation among replicates. (e) Enrichment in H3K27ac from peak-calling using MACSv2 with a P value threshold of 0.01 [Citation34] to illustrate that several of the hypermethylated SkM DMRs overlap especially strong enhancer regions. (f) RNA-seq. Esoph, esophagus; CpG density, plot of CpGs. Blue highlighting, Mb or SkM hypermethylated regions.
![Figure 2. Cardiac TF-encoding NKX2-5 is repressed in many samples without DNA methylation but is repressed with DNA methylation in Mb, SkM, and aorta at a cryptic super-enhancer. (a) RefSeq structure for NKX2-5 and Mb-hypermethylated DMRs (chr5:172,654,786-172,675,423). (b) Chromatin state segmentation as in Figure 1 with the addition that aqua green segments denote enrichment in repressive H3K9me3 with low levels of H3K36me3 [Citation23]. (c) CpG islands, CpGs, and examples of RRBS tracks for normal cell cultures and the HepG2 liver cancer cell line. (d) Bisulfite-seq profiles as in Figure 1 with additional bisulfite-seq tracks for other samples (shown in the dense configuration) to indicate the consistency of the SkM- and aorta-specific hypermethylation among replicates. (e) Enrichment in H3K27ac from peak-calling using MACSv2 with a P value threshold of 0.01 [Citation34] to illustrate that several of the hypermethylated SkM DMRs overlap especially strong enhancer regions. (f) RNA-seq. Esoph, esophagus; CpG density, plot of CpGs. Blue highlighting, Mb or SkM hypermethylated regions.](/cms/asset/0d67a797-6aeb-4ec9-a01d-bbbbb11d659f/kepi_a_1445900_f0002_oc.jpg)
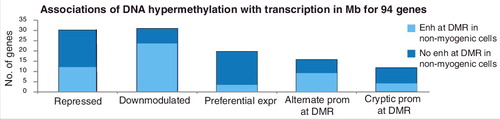
Figure 3. Summary of the associations with transcription for the 94 Mb-hypermethylated genes. Number of genes found to correspond to each of the given categories of hypermethylation-transcription correlations as described in the text and in Supplementary Tables S1–S4. Light blue, the gene was associated with a Mb-hypermethylated DMR that displayed enhancer chromatin and a lack of DNA methylation in at least one non-myogenic cell type or tissue. Note that genes with alternate or cryptic promoters sometimes also fell into one of the first three categories.
Myogenic DNA hypermethylation that is associated with down-modulated expression often overlaps cryptic enhancers
To clarify how DNA hypermethylation can be positively associated with gene expression, we used the 94-gene set to look for genes that displayed moderate expression in Mb and were linked to Mb-hypermethylated DMRs. Thirty-one of these genes were expressed in Mb but expressed at higher levels in cell types lacking a hypermethylated DMR. Paradoxically, these genes also did not have a hypermethylated DMR in non-myogenic cell types in which the gene was repressed (Supplementary Table S2 and Figures S6, S7b and S8). We refer to these 31 genes as Mb-hypermeth/downmod genes. We found that 21 (71%) Mb-hypermeth/downmod genes have DMRs that overlap unmethylated or weakly methylated strong enh-chromatin in highly expressing non-myogenic samples (, Downmodulated, light blue bar). Importantly, only one or a few diverse, non-myogenic samples (e.g., spleen, lung, brain, esophagus, adipose, ovary, skin fibroblasts, or osteoblasts) exhibited enh-chromatin at the Mb-hypermeth DMRs so that, without examining many sample types, these enhancer regions could be easily missed.
One of the Mb-hypermeth/downmod genes, NR2F2 (COUP-TFII), encodes a TF with key roles in many types of development, including myogenesis, cardiovascular development and neurogenesis, as well as in metabolic homeostasis and disease [Citation36]. Like eight other genes that we analyzed (Supplementary Tables S1a-3a), it regulates the epithelial-to-mesenchymal transition [Citation37]. Mb, SkM, skin, and HMEC display intermediate levels of expression of NR2F2 and had hypermethylated DMRs that are upstream and downstream of the gene (a, c and d). In highly expressing, non-myogenic samples (lung fibroblasts, ovary and spleen), NR2F2 and nine other Mb-hypermeth/downmod genes had a hypomethylated super-enhancer that overlaid Mb-hypermethylated DMRs (Supplementary Tables S2a; Supplementary Figure S6). Peripheral blood mononuclear cells (PBMC), an LCL, and embryonic stem cells (ESC) exhibited little or no expression of NR2F2 but, nonetheless, had low amounts of DNA methylation at the DMRs (c and d). The methylation profile in and around DMRs in repressed samples for Mb-hypermeth/downmod genes often had more scatter and less well defined borders than did DMRs in highly expressing samples (d and Supplementary Figure S8d). Two hypermethylated DMRs downstream of NR2F2 in many of the expressing samples (d, orange triangles) interrupt a region of prom-chromatin overlapping a neighboring lncRNA gene (a and b). In addition, immediately downstream of NR2F2, DNA hypermethylation was associated with a loss of H3K27ac in lung fibroblasts (d and e, pink horizontal bars). This DNA hypermethylation might help shape and thereby modulate the activity of the surrounding enhancer. A similar phenomenon was seen upstream of the TSS of EBF3 gene in Mb, SkM, and heart (Supplemental Figure S7a-c, pink highlighting).
Figure 4. NR2F2, which encodes a master TF regulator, is down-modulated in Mb, SkM, aorta, epidermis, and mammary epithelial cells, and displays hypermethylated DMRs in those samples. (a) RefSeq or ENSEMBL structures for NR2F2, the 5’ end of NR2F-AS1, other ncRNA genes; Mb-hypermethylated DMRs (chr15:96,808,300-96,911,119). (b) Chromatin state segmentation. Broken arrows, locations of two of the alternative TSS for NR2F2; orange triangles, gaps in promoter chromatin that correspond to the SkM-hypermethylated DMRs. (c), (d), (e), and (f), as described for . In (d), the locations of two of the alternative TSS for NR2F2, a constitutive CTCF binding site, and hypermethylated DMRs are indicated above the SkM track. Dotted boxes, two of the super-enhancer regions that show very low levels of DNA methylation. Pink horizontal line for lung fibroblasts in (d) and (e), the region of high DNA methylation and low H3K27ac at the super-enhancer in these cells.
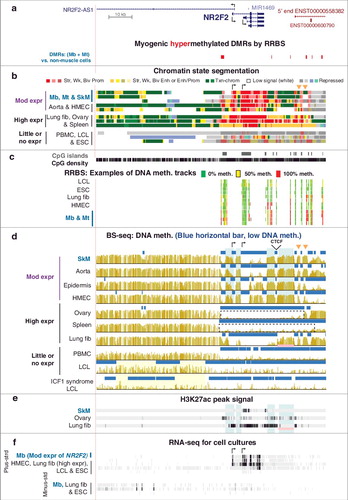
Upstream of NR2F2 was a hypomethylated DMR that correlated with the ICF1 syndrome (immunodeficiency, centromeric region instability, facial anomalies), a rare recessive disease that results from loss of most DNMT3B activity. In our previous transcriptome analysis of many ICF and control LCLs, one of the most significantly upregulated genes was NR2F2 [Citation38]. Upstream of NR2F2 and overlapping the adjacent NR2F2 AS1 (d, yellow highlighting), there was a long region of DNA hypomethylation in a DNMT3B-mutant ICF1 LCL relative to two controls [Citation23,Citation34,Citation39]. NR2F2-AS1 displays similar tissue-specific expression [Citation40] as for NR2F2 itself (a, d and f). This suggests that dysregulation of this antisense gene, which shares a promoter region with NR2F2, could dysregulate NR2F2 itself, and that altered DNA methylation might be a contributing factor.
Both intergenic and intragenic myogenic DNA hypermethylation were associated with genes preferentially expressed in myogenic cells
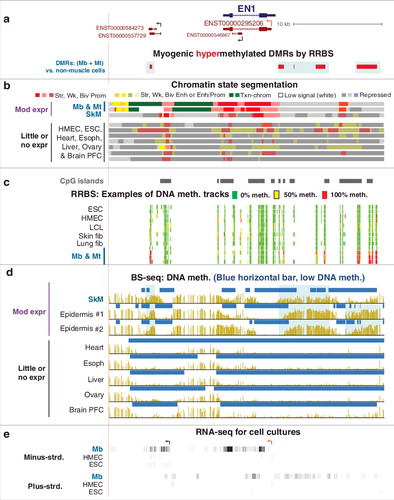
We next examined genes with only positive associations between Mb-hypermethylated DMRs and preferential expression in Mb to determine if transcription was correlated only with gene-body DMRs. Twenty genes from the 94-gene set were preferentially expressed in Mb in association with their myogenic hypermethylated DMRs (Mb-hypermeth/pref-expr genes; Supplementary Table S3 and Figures S7a, S9 and S10). Unlike the Mb-hypermeth/downmod genes, these genes did not have lower expression in Mb than in some other examined cell types. Gene-body DNA methylation has been positively associated with transcription elongation [Citation14] but the most frequent descriptions of DNA methylation elsewhere in the genome, especially upstream of the gene, involve negative correlations with transcription [Citation7,Citation41]. Mb-hypermethylated DMRs upstream or downstream of the gene were seen in 11 of these genes, including EN1 (), which encodes a homeobox TF found in the dermomyotome during embryogenesis. In Mb, SkM, and epidermis, EN1 contains hypermethylated DMRs 14 kb downstream and 0.4 kb upstream of the TSS that is defined by 5’ cap analysis of gene expression in Mb (CAGE; a, ENST00000295206, orange broken arrow). DNA hypermethylation observed specifically in Mb, SkM, and epidermis matches the preferential expression of EN1 in these samples (Supplementary Table S3b). The border-like hypermethylation adjacent to the prom-chromatin overlapped weak PcG-chromatin (a, b and d). In addition, both upstream and downstream of the gene (e), Mb hypermethylation was observed in regions where long-lived antisense or sense ncRNAs were seen preferentially in Mb (a and e).
Figure 5. The homeobox gene EN1 is expressed preferentially in Mb, SkM, and epidermis and has TSS-upstream and gene-downstream hypermethylation in those samples. (a) RefSeq or ENSEMBL structures for EN1 and ncRNA genes; Mb-hypermethylated DMRs (chr2:119,587,322-119,618,802). (b), (c), (d), and (e), as described for . The orange broken arrow indicates the CAGE-determined Mb TSS.
SIX2, another Mb-hypermeth/pref-expr gene that encodes a homeobox TF, is very highly expressed in Mb and moderately expressed specifically in SkM and aorta. A hypermethylated DMR in these samples starts at the 3’ end of the gene and overlays txn- and weak prom-chromatin in Mb and Mt (Supplementary Figure S2). This Mb/SkM/aorta DNA hypermethylation borders prom-chromatin, which overlaps the gene body, and may protect the prom-chromatin against spreading of gene-downstream repressive chromatin (H3K27me3- or H3K9me3-enriched chromatin). Similarly, SIM2 and TBX18, Mb-hypermeth/pref-expr genes which also encode developmental TFs, displayed Mb DNA hypermethylation immediately upstream of their promoters adjacent to repressive PcG-chromatin (Supplementary Table S3).
Intergenic or intragenic myogenic DNA hypermethylation was associated with repressed alternative or cryptic promoters
Because DNA hypermethylation has been correlated with changes in promoter usage for genes with multiple promoters [Citation4], we wanted to find and study genes where Mb-hypermethylation correlated with repressed use of alternative or cryptic promoters. We found 29 genes that fit this category out of the 94 examined genes (; Supplementary Table S4 and Figures S3, S5 and S11), e.g., ZIC1, which encodes a neurogenic and myogenic TF [Citation42,Citation43] and which, we found, has a particularly unusual alternative promoter. Upstream and downstream of ZIC1, hypermethylated DMRs in Mb, SkM, osteoblasts and skin fibroblasts were associated with the use of a previously undescribed alternative promoter for this gene within intron 3 of the adjacent and oppositely oriented ZIC4 gene (Supplementary Figure S3a and b, large purple arrow). LAD1, another Mb-hypermeth gene displaying alternative promoter usage, encodes an epithelial membrane protein and has a hypermethylated and repressed canonical promoter in Mb. Mb exhibit an intragenic cryptic promoter overlapping enh-chromatin that gives rise to a highly 5’-truncated RNA (Supplementary Figure S5d, blue box). Mb DNA hypermethylation at the canonical LAD1 promoter is probably related to LAD1's neighbors (TNNT2 and TNNI1) being preferentially expressed in Mb and Mt and to its gene body overlapping a myogenic super-enhancer [Citation44]. The intragenic LAD1 lncRNA might contribute to myogenic super-enhancer activity for TNNT2 and TNNI1. TBX1 is also predominantly expressed from a cryptic intragenic promoter. Its DNA methylation in the 1-kb upstream region could not be ascertained in our previous RRBS study because RRBS covers only a small (but usually informative) subset of CpG sites [Citation20]. From recently available bisulfite-seq profiles of SkM samples [Citation23], it can be seen that there is dense SkM-lineage-specific methylation at the canonical promoter (Supplementary Table S3a). Both Mb and SkM strongly and specifically express this gene but have active promoter chromatin only in the middle of the gene body (Supplementary Table S3a).
DBX1 is a Mb-hypermeth/repr gene with a 3’ DMR that overlaps a cryptic promoter for an ncRNA that is expressed specifically in ESC (Supplementary Figure S4e, blue box). The DNA hypermethylation is targeted to Mb, Mt, and SkM although this ncRNA promoter was silenced in other cell types without DNA methylation (Supplementary Figure S4c and e). In contrast, Mb hypermethylation and repression of intragenic cryptic promoters of JSRP1 (Supplementary Figure S10), STAC3, CDH15, PITX3, and RYR1 are positively associated with expression of these genes in myogenic cells. Their DMRs are embedded in weak or bivalent promoter chromatin at the cryptic promoter in non-myogenic samples. RNA-seq and CAGE profiles indicate that the unmethylated DMRs are capable of acting as promoters in vivo (Supplementary Figure S10c and d, dotted boxes, and Supplementary Table S2a-4a). The cryptic promoters when unmethylated are associated with bidirectional transcripts (CDH15 and PITX3 [Citation45]), antisense (RYR1), or sense transcripts (JSRP1 and STAC3). Therefore, for these five genes, Mb hypermethylation at the cryptic promoter was correlated with the cryptic promoter being silenced while the canonical gene promoter was active.
Some Mb-hypermethylated DMRs are associated with inhibition of binding to CTCF sites
CCCTC-binding factor (CTCF) can act as a DNA methylation-sensitive TF and mediate insulation, modulate alternative splicing, and cause changes in higher-order chromatin structure that affect transcription initiation and alter topologically associated domains (TADs) [Citation46]. While a function for CpG methylation inside CTCF binding sites in inhibiting CTCF binding is clearly established, it has been reported that there may be little relationship between nearby DNA methylation and CTCF binding at the majority of sites that do not have a CpG within the recognition sequence [Citation47]. We found that decreased binding of CTCF was associated with overlapping myogenic DMR hypermethylation for 15 of the 94 examined genes (Supplementary Tables S1a-S4a), as determined from CTCF chromatin-immunoprecipitation (ChIP-seq) profiles [Citation21,Citation34]. One such relationship involved the previously described LXN (e). Mb and Mt were uniquely lacking in binding of CTCF to the 5’ end of LXN and their highly specific hypermethylated DMR overlaps this site (c and e). However, the predicted binding sequence at this site does not contain any CpG sequences, unlike some CTCF sites [Citation46]. In contrast, decreased binding of CTCF to a SkM lineage-hypermethylated site at the 3’ end of the Mb-pref expr gene LBX1-AS1, involves a CTCF recognition site that contains two CpGs (Supplementary Figure S9f, blue box on right). These findings indicate that DNA methylation that is correlated positively or negatively with gene expression could be associated with direct blocking of CTCF binding at its recognition sequence (as for LBX1-AS1) or indirect blocking (as for LXN).
More 5-methylcytosine than 5-hydroxymethylcytosine was present at tested Mb-hypermethylated sites
DNA methylation profiled by RRBS or bisulfite-seq cannot distinguish between 5-methylcytosine (5mC) and the very much less prevalent 5-hydroxymethylcytosine (5hmC), which have many different biochemical and biological correlates [Citation48]. Therefore, we used an enzyme-based assay (Epimark) to quantify 5hmC and 5mC at specific sites [Citation45]. We assayed biological replicates of SkM, Mb, and ten other tissues or non-cancer cell cultures at three CCGG sites that were significantly hypermethylated. These sites are located 0.1 kb downstream of the TSS in LXN (TSS + 0.1 kb), 4.2 kb upstream of the TSS of EBF3 (TSS – 4.2 kb) and in SIM1 (TSS + 0.1 kb; a & Supplementary Figure S7a and e). LXN is repressed and EBF3 is preferentially expressed in Mb and SkM. SIM1 is moderately expressed in Mb and mostly repressed in SkM. SkM had appreciable 5hmC only at the EBF3 and SIM1 sites (26 and 11% of C as 5hmC, respectively), which had more than twice as much 5mC as 5hmC (Supplementary Table S5a). As we found at other Mb DM sites that we examined in Epimark assays in earlier studies [Citation45], there were generally only negligible levels of 5hmC in non-embryonic cell cultures, leukocytes, spleen, lung, placenta, and sperm.
A hydroxymethylome profile (TAB-seq) [Citation34,Citation49] for the examined tissues or postnatal cell cultures is currently available only for brain prefrontal cortex. While a comparison of bisulfite-seq (detecting 5mC and 5hmC) and Tab-seq (detecting just 5hmC) on the same DNA sample is not strictly quantitative, it can indicate whether there is much or little 5hmC relative to 5mC in a given region for a particular sample. Such a comparison for genes that were methylated in brain as well as in Mb at the Mb-hypermethylated DMRs revealed that 16 genes had much more 5mC than 5hmC over the DMR in brain prefrontal cortex (SIX3 and SIX2, Supplementary Figure S2e and Table S5b). Nine genes had considerable levels of both 5hmC and 5mC at the DMRs (ZIC4, Supplementary Figure S3e and f and Table S5b).
Discussion
By focusing on a limited number of genes in our study of DNA hypermethylation/transcription associations, we were able to discern relationships previously undescribed in global genomic analyses of DNA methylation and gene expression [Citation5,Citation23]. Our detailed bioinformatics analyses of 94 genes suggest that there are diverse types of associations of differentiation-linked DNA hypermethylation with gene expression and that cell type-specific DNA hypermethylation is not simply an obligatory default state that reflects the gene's transcription status. Five of the examined Mb-hypermethylated genes showed tight correlations of promoter DMR hypermethylation (immediately upstream or downstream of the TSS) with repression among diverse cell types (b). However, a key finding is that repression-associated DNA hypermethylation in Mb is not simply the inevitable consequence of gene silencing by other means. This was evident from the other 25 Mb-hypermeth/repr genes that were repressed in non-myogenic samples without DNA hypermethylation at the DMR but usually with PcG repressive chromatin (a and Supplementary Figure S12). Our analyses suggest that there are special rationales for the involvement of highly cell type-specific DNA hypermethylation in helping to establish or maintain gene repression. One such rationale for cell type-specific DNA hypermethylation for transcription regulation is the need for careful control of expression of developmentally linked genes that reside near each other on the genome but which direct very different developmental outcomes, e.g., LXN inside GFM1, SIX3 near SIX2, and LAD1 bordered by TNNT2 and TNNI1 (, Supplementary Figures S2 and S5).
Figure 6. Schematic showing featured relationships between hypermethylated DMRs, chromatin state, and transcription of the associated mRNA-encoding genes for the 94 examined Mb-hypermethylated genes. The association of alternative splicing with DNA methylation is not included although four of the 94 genes gave some evidence for a correlation between tissue- or cell type-specific DNA hypermethylation and alternative use of splice isoforms (Supplementary Table S4a). Hypermeth, hypermethylation; txn, transcription; enh, enhancer; prom, promoter; PcG-chrom, chromatin enriched in repressive H3K27me3; adj, adjacent; lincRNA, long intergenic noncoding RNA; downreg, downregulation; elongn, elongation; “at CTCF sites” includes sites near but not within the consensus CTCF binding sequence.
Certain Mb-hypermeth/repr genes involved in specifying non-myogenic cell lineages may require DNA methylation to prevent even very low levels of expression in the SkM lineage. For example, DNA hypermethylation throughout the NKX2-5 vicinity in Mb, SkM, and aorta is linked to the absence of a heart-and-spleen super-enhancer, although in most tissues and cell cultures this cardiogenic TF-encoding gene is silenced without DNA hypermethylation. DNA hypermethylation of NKX2-5 may have to be targeted to the SkM lineage because of the strong overlap of gene expression profiles from heart with those from SkM [Citation50] and the partial sharing of cardiogenic and facial muscle developmental TFs [Citation51]. Indeed, inappropriate expression of NKX2-5 in SkM of myotonic dystrophy type 1 patients or in transgenic mice SkM or stably transfected Mb is linked to interference with normal SkM development [Citation52]. Furthermore, we propose that the previously reported NKX2-5 intragenic, disease-linked gene-body DNA hypermethylation, which was coupled with low NKX2-5 mRNA levels in the hearts of some cardiac patients with tetralogy of Fallot [Citation53], involves decreased super-enhancer formation.
DNA methylation for most of the 31 genes with moderate expression associated with DNA hypermethylation appears to be linked to down-modulation of transcription by repressing cryptic enhancers or super-enhancers (e). For these Mb-hypermeth/downmod genes, DMR methylation was lacking in both non-myogenic samples in which the genes are more highly expressed as well as in samples in which they are not expressed. Most of these genes had DMRs that overlapped low-methylation enh-chromatin or super-enhancers specifically in one or a few non-myogenic lineages in which the genes were highly expressed. The low methylation at the DMRs in cell types having a silent promoter may be due to repressive chromatin sufficing for epigenetic silencing of enhancers in such cells for Mb-hypermeth/downmod genes. It is noteworthy that cryptic super-enhancers in repressed genes often had more scattered partial methylation throughout the DMR and at its borders than did active enhancers (e.g., d). Active enh-chromatin generally exhibits low DNA methylation for at least part of its length [Citation5,Citation35,Citation54,Citation55], and this hypomethylation is implicated in enhancer formation [Citation56]. Similarly, we previously demonstrated that in vitro methylation targeted to only the three CpGs within the powerful 258-bp core enhancer of the 40-kb SkM-lineage-specific MYOD1 super-enhancer gave a 90% decrease in enhancer activity in reporter gene assays in Mb [Citation55].
In addition to overall hypomethylation being associated with enhancers, recent reports indicate that DNA methylation in certain enhancer subregions may actually facilitate enhancer function [Citation54,Citation57,Citation58]. Hypermethylated regions within enhancers were found to be especially frequent in super-enhancers [Citation54]. Importantly, we discovered tissue-specific differences in how much of the super-enhancer chromatin overlays regions displaying much DNA methylation for several genes (NR2F2 and TBX3; and Supplementary Figure S8). This suggests a role for DNA hypermethylation in shaping the activity of super-enhancers in a tissue-specific manner. However, a caveat is that most DNA methylation studies of enhancers use methods of analysis that do not distinguish between and quantify 5hmC and 5mC, and 5hmC enrichment has been found to be more characteristic of enh-chromatin than 5mC enrichment [Citation49].
NR2F2, a Mb-hypermeth/downmod gene, illustrates complex cell type-specific epigenetics probably attuned to its diverse roles in regulating cell physiology and organogenesis. NR2F2 dysregulation is linked to exacerbating muscular dystrophy symptoms [Citation59] and to promoting carcinogenesis and metastasis [Citation37]. Moreover, a comparison of ICF1 syndrome (DNMT3B-deficiency) and control LCLs revealed disease-associated hypomethylation of NR2F2 in a far-upstream region that overlaps the gene body of the oppositely oriented NR2F2-AS1 (d). Previously, we found that NR2F2 was upregulated in ICF vs. control LCLs [Citation38]. Therefore, given the many roles of this transcription factor gene in regulating differentiation-associated transcription, ICF1-linked DNA hypomethylation at the NR2F2-upstream DMR might contribute to abnormalities in ICF1 gene expression.
Much evidence links 5mC (and 5hmC) enrichment in gene bodies to transcription-coupled formation of H3K36me3 by recruitment of DNA methyltransferases [Citation13,Citation14,Citation60,Citation61] (g; Supplementary Figure S3, dotted boxes). However, accumulation of DNA methylation in very actively transcribed gene bodies is not compulsory, as we observed for NR2F2 in ovary and NKX2-5 in heart ( and ). It has been proposed that the lack of intragenic DNA methylation seen in many highly transcribed genes is simply an inevitable default state due to dense packing of the transcription elongation machinery, thereby making the DNA in the gene body inaccessible to DNA methyltransferases [Citation62]. Our findings for CDH15 suggest that this explanation for the deposition of gene-body methylation is an overgeneralization and, instead, support the still controversial proposal [Citation15] that gene-body DNA methylation can silence canonical transcription-inhibitory cryptic promoters (d). We previously showed in reporter gene assays that the Mb-hypermethylated gene-body DMR in the Mb/SkM/cerebellum-specific CDH15 gene overlaps a strong Mb-associated cryptic promoter that can be silenced by in vitro DNA methylation [Citation45]. Such methylation silencing of a cryptic intragenic promoter when the gene is transcriptionally active is also likely for RYR1, PITX3, and JSRP1 (Supplementary Table S3a). Related to the association of DNA methylation with cryptic promoters was our finding of its frequent association with alternative promoter usage (h; Supplementary Table S4a), as also described by others [Citation63,Citation64].
Another way that DNA hypermethylation may help regulate transcription is by facilitating formation of borders at enhancers or promoters [Citation3,Citation48] to limit the inward spread of repressive PcG-chromatin and the outward spread of prom-chromatin or enh-chromatin (f and ). Genomic cytosine methylation can be antagonistic to local generation of H3K27me3 by inhibiting binding of the PcG complex and modulating binding of methylation-sensitive DNA binding-proteins directly to DNA [Citation6,Citation7]. DNA methylation may also play a role directly or through some of the MBD family proteins in recruiting histone deacetylases to oppose the spread of active prom- or enh-chromatin but how frequently this occurs in vivo is still unclear [Citation65]. Although 5hmC upstream of promoters can be positively associated with transcription [Citation48], we found negligible 5hmC in Mb at a tested hypermethylated DM site upstream of the TSS of the Mb-hypermeth/pref-expr EBF3 gene (Supplementary Table S5a). DNA hypermethylation can also impact chromatin structure by inhibiting binding of CTCF [Citation46]. For CTCF recognition sequences not containing CpGs (e.g., LXN, ), the observed inverse correlation between methylation and CTCF binding is probably due to DNA methylation indirectly making the chromatin structure less open for CTCF binding.
The genes in this study were chosen just from their Mb hypermethylation/transcription associations. Most of them turned out to be developmental genes and so are likely to use the cell type-specific DNA hypermethylation to help fine-tune transcription according to the cell type, stage of development, or physiological needs, such as roles in an inducible process like SkM repair. For example, TBX1 is a major TF for formation of many facial and neck skeletal muscles [Citation51] and for generation of the secondary heart field [Citation66] and can influence SkM type postnatally [Citation67]. TBX1 haploinsufficiency is linked to the heart and skeletal muscle defects of the DiGeorge and velocardialfacial syndromes [Citation68]. Other Mb-hypermethylated development-associated genes in this study (e.g., TBX3, TBX4, TBX18, SIM1, ZIC1, NR2F2, and PITX1) also need precise regulation of expression as seen in their linkage to haploinsufficiency-caused diseases in humans and to transgenic mouse models of human disease, or in their response to environmentally-associated disease [Citation69]. In accord with their multiple roles in development, PAX3, PAX7, TBX1, and NR2F2 have been shown to require different concentrations of their encoded TFs at different times and in different lineages in development [Citation68,Citation70,Citation71], a need that could be fulfilled in part by differential DNA methylation fine-tuning transcription. Possibly linked to their roles in development, some of the studied Mb-hypermeth differentiation-determining genes (e.g., PAX3, NR2F2, and TWIST) are also implicated in carcinogenesis [Citation37,Citation72].
There is remarkable diversity of the non-myogenic differentiation pathways associated with many of the examined Mb-hypermeth genes. This diversity likely contributes to the need for hypermethylated DMRs to fine-tune expression for different developmental fates. Twelve of the analyzed 94 genes are involved in both embryonic myogenesis and neurogenesis (PAX3, PAX7, SIM1, SIM2, ZIC1, TWIST1, EBF3, LBX1, NRXN2, EN1, LHX2, and KCNQ4; Supplementary Tables 2a-4a). Five Mb-hypermeth genes are implicated in directing both myogenesis and adipogenesis (TBX1, ZIC1, EN1, EBF3, and TCF21), or in Mb transdifferentiation to adipocytes (PRDM16 [Citation73]). Such genes may be more likely than most to require cell type-specific DMRs to differentially regulate their expression depending on temporal and spatial factors. Moreover, many of the studied developmental genes genetically interact with one another during embryogenesis (TBX1 with TCF21 and LHX2 [Citation51,Citation74]; PAX3 with PAX7, SIM1, ZIC1, TWIST1, DBX1, TBX3, DMRT2, MEIS1, and GBX2 [Citation70,Citation75]) suggesting developmental co-methylation [Citation76] for fine-tuning their expression.
Materials and methods
Bioinformatics
Databases from the ENCODE and RoadMap projects [Citation23,Citation77] with epigenetic and RNA-seq profiles used in the figures are available at the UCSC Genome Browser [Citation34]. The RRBS profiles for 18 types of cell culture samples used to determine myogenic differential methylation were previously described [Citation27]; the cell cultures were untransformed cell strains except for the LCLs. For tissue methylomes, we used bisulfite-seq profiles [Citation23,Citation78] from the Bisulfite Sequencing Data hub rather than RRBS profiles because the two available RRBS methylomes for SkM were from individuals of advanced age (71 and 83 y) unlike the main BS-seq SkM sample, which was a mixture of tissues from a 3 y male and a 34 y male [Citation23]. In addition, bisulfite-seq data (which is not available for Mb) gives much more coverage than RRBS. We noticed that the RRBS profiles of SkM often displayed lower DNA methylation at Mb DM sites compared to BS-seq profiles of SkM from the same sites, which is probably attributable to the effects of aging on DNA methylation [Citation79]. When more than one SkM bisulfite-seq track is shown, the extra tracks were psoas muscle from a 30 y female and separate analyses of the above two male samples. Coordinates given for genes are in hg19 from the UCSC browser. The chromatin state segmentation (chromHMM, AuxilliaryHMM) was from a hub for the Roadmap Epigenomics Project with the color code for the 18-state chromatin state segmentation slightly simplified from the original [Citation23]. The same sample mixture of 3 y and 34 y male psoas muscle was used for chromatin state segmentation as for bisulfite-seq. From the ENCODE project [Citation77] we used the following UCSC Genome Browser tracks: RNA-seq (for tissues; not strand-specific) and CTCF binding, Massachusetts Institute of Technology [Citation80]; and Transcription Levels by Long RNA-seq for poly(A)+ whole-cell RNA by strand-specific analysis on >200 nt poly(A)+ RNA (for various cell cultures), Cold Spring Harbor Laboratories and RNA Subcellular CAGE Localization, RIKEN Omics Science Center. For visualizing RNA-seq tracks in the UCSC Genome Browser in figures, the vertical viewing ranges were 0 to 30 for cultured cells and 0 to 2 for tissues, unless otherwise specified. For Supplementary Tables S1b-S4b, quantification of RNA-seq for tissues was from the GTex database RPKM median values from more than 100 samples for each tissue type [Citation40] and for cell cultures was FPKM values from >200 nt poly(A)+ RNA from ENCODE/Wold Lab at Caltech [Citation34], as previously described [Citation27].
Determination of Myogenic DMRs and DM sites
Significant hypermethylated DM sites were assessed by fitted binomial regression models of each monitored CpG such that each CpG had an estimated percent methylation difference (PMD) of >50 with P <0.01 [Citation27] relative to the other samples. Statistically significant hypermethylated DMRs were determined from ENCODE RRBS data [Citation27] using our UPQ algorithm, which first fits binomial regression models to estimate PMD and associated P values at each site. Subsequently, clusters of contiguous sites (with a minimum site density of 2 CpGs per 100 bp) whose P values are jointly far smaller than would be expected under a random distribution of differentially methylated and non-differentially methylated sites were identified as DMRs, with P values computed under the Uniform Product distribution [Citation33]. Identified candidate DMRs were further reduced to consider only the subset with average PMD >25 & P values <0.01.
Quantification of 5hmC and 5mC
The Epimark assay (New England Biolabs [Citation27]), which involves incubation of the DNA samples with T4 phage β-glucosyltransferase to glucosylate only 5hmC residues followed by cleavage at CCGG sites by restriction endonucleases (MspI, HpaII, or no digestion), and quantitative PCR (six reactions per sample) were done as previously described [Citation45]. The PCR primer-pairs for the analyzed CCGG sites in or upstream of LXN, EBF3, and SIM1 are given in Supplementary Table S5a.
Disclosure of Potential Conflicts of Interest
No potential conflicts of interest were disclosed.
Baribault_et_al._Hypermeth_in_HumanDNA_Suppl_Rev_1_30_18.pdf
Download PDF (2.6 MB)Acknowledgments
We would like to thank Drs. Donald Comb, Rich Roberts, William Jack and Clotilde Carlow at New England Biolabs Inc. for research support and encouragement. We also thank Melody Badoo and the Tulane Cancer Center for help with the Cufflinks analysis of the ENCODE RNA-seq data.
Additional information
Funding
Related Research Data
References
- Brenet F, Moh M, Funk P, et al. DNA methylation of the first exon is tightly linked to transcriptional silencing. PloS One. 2011;6:e14524. doi:10.1371/journal.pone.0014524. PMID:21267076
- Blattler A, Yao L, Witt H, et al. Global loss of DNA methylation uncovers intronic enhancers in genes showing expression changes. Genome Biol. 2014;15:469. doi:10.1186/s13059-014-0469-0. PMID:25239471
- Petell CJ, Alabdi L, He M, et al. An epigenetic switch regulates de novo DNA methylation at a subset of pluripotency gene enhancers during embryonic stem cell differentiation. Nucleic Acids Res. 2016;44:7605–7617. doi:10.1093/nar/gkw426. PMID:27179026
- Maunakea AK, Nagarajan RP, Bilenky M, et al. Conserved role of intragenic DNA methylation in regulating alternative promoters. Nature. 2010;466:253–257. doi:10.1038/nature09165. PMID:20613842
- Varley KE, Gertz J, Bowling KM, et al. Dynamic DNA methylation across diverse human cell lines and tissues. Genome Res. 2013;23:555–567. doi:10.1101/gr.147942.112. PMID:23325432
- King AD, Huang K, Rubbi L, et al. Reversible regulation of promoter and enhancer histone landscape by DNA methylation in mouse embryonic stem cells. Cell Rep. 2016;17:289–302. doi:10.1016/j.celrep.2016.08.083. PMID:27681438
- Ambrosi C, Manzo M, Baubec T. Dynamics and context-dependent roles of DNA methylation. J Mol Biol. 2017;429:1459–1475. doi:10.1016/j.jmb.2017.02.008. PMID:28214512
- Liang G, Weisenberger DJ. DNA methylation aberrancies as a guide for surveillance and treatment of human cancers. Epigenetics. 2017;12:416–432. doi:10.1080/15592294.2017.1311434. PMID:28358281
- Core LJ, Martins AL, Danko CG, et al. Analysis of nascent RNA identifies a unified architecture of initiation regions at mammalian promoters and enhancers. Nature Genetics. 2014;46:1311–1320. doi:10.1038/ng.3142. PMID:25383968
- Deniz E, Erman B. Long noncoding RNA (lincRNA), a new paradigm in gene expression control. Funct Integ Genomics. 2017;17:135–143. doi:10.1007/s10142-016-0524-x.
- Ball MP, Li JB, Gao Y, et al. Targeted and genome-scale strategies reveal gene-body methylation signatures in human cells. Nat Biotechnol. 2009;27:361–368. doi:10.1038/nbt.1533. PMID:19329998
- Hon GC, Hawkins RD, Caballero OL, et al. Global DNA hypomethylation coupled to repressive chromatin domain formation and gene silencing in breast cancer. Genome Res. 2012;22:246–258. doi:10.1101/gr.125872.111. PMID:22156296
- Mendizabal I, Zeng J, Keller TE, et al. Body-hypomethylated human genes harbor extensive intragenic transcriptional activity and are prone to cancer-associated dysregulation. Nucleic Acids Res. 2017;45:4390–400. PMID:28115635
- Neri F, Rapelli S, Krepelova A, et al. Intragenic DNA methylation prevents spurious transcription initiation. Nature. 2017;543:72–77. doi:10.1038/nature21373. PMID:28225755
- Teissandier A, Bourc'his D. Gene body DNA methylation conspires with H3K36me3 to preclude aberrant transcription. EMBO J. 2017;36:1471–1473. doi:10.15252/embj.201796812. PMID:28442531
- Baubec T, Colombo DF, Wirbelauer C, et al. Genomic profiling of DNA methyltransferases reveals a role for DNMT3B in genic methylation. Nature. 2015;520:243–247. doi:10.1038/nature14176. PMID:25607372
- Gatto S, Gagliardi M, Franzese M, et al. ICF-specific DNMT3B dysfunction interferes with intragenic regulation of mRNA transcription and alternative splicing. Nucleic Acids Res. 2017;45:5739–5756. doi:10.1093/nar/gkx163. PMID:28334849
- Li S, Zhang J, Huang S, et al. Genome-wide analysis reveals that exon methylation facilitates its selective usage in the human transcriptome. Brief Bioinform. 2017;
- Bell JSK, Vertino PM. Orphan CpG islands define a novel class of highly active enhancers. Epigenetics.2017:1–16.
- Meissner A, Mikkelsen TS, Gu H, et al. Genome-scale DNA methylation maps of pluripotent and differentiated cells. Nature. 2008;454:766–770. doi:10.1038/nature07107. PMID:18600261
- Ernst J, Kheradpour P, Mikkelsen TS, et al. Mapping and analysis of chromatin state dynamics in nine human cell types. Nature. 2011;473:43–49. doi:10.1038/nature09906. PMID:21441907
- Hon GC, Rajagopal N, Shen Y, et al. Epigenetic memory at embryonic enhancers identified in DNA methylation maps from adult mouse tissues. Nature genetics. 2013;45:1198–1206. doi:10.1038/ng.2746. PMID:23995138
- Kundaje A, Meuleman W, Ernst J, et al. Integrative analysis of 111 reference human epigenomes. Nature. 2015;518:317–330. doi:10.1038/nature14248. PMID:25693563
- Cohen S, Nathan JA, Goldberg AL. Muscle wasting in disease: molecular mechanisms and promising therapies. Nat Rev Drug Discov. 2015;14:58–74. doi:10.1038/nrd4467. PMID:25549588
- Jin J, Peng P, Jiang S. The epigenetic regulation of embryonic myogenesis and adult muscle regeneration by histone methylation modification. Biochem Biophys Reports. 2016;6:209–219. doi:10.1016/j.bbrep.2016.04.009.
- Chal J, Pourquie O. Making muscle: skeletal myogenesis in vivo and in vitro. Development (Cambridge, England). 2017;144:2104–2122. doi:10.1242/dev.151035. PMID:28634270
- Tsumagari K, Baribault C, Terragni J, et al. Early de novo DNA methylation and prolonged demethylation in the muscle lineage. Epigenetics. 2013;8:317–332. doi:10.4161/epi.23989. PMID:23417056
- Segales J, Perdiguero E, Munoz-Canoves P. Epigenetic control of adult skeletal muscle stem cell functions. FEBS J. 2015;282:1571–1588. doi:10.1111/febs.13065. PMID:25251895
- Jurkowska RZ, Jeltsch A. Enzymology of mammalian DNA methyltransferases. Advances in Experimental Medicine and Biology. 2016;945:87–122. doi:10.1007/978-3-319-43624-1_5. PMID:27826836
- Naito M, Mori M, Inagawa M, et al. Dnmt3a Regulates Proliferation of Muscle Satellite Cells via p57Kip2. PLoS Genet. 2016;12:e1006167. doi:10.1371/journal.pgen.1006167. PMID:27415617
- Fisher AG, Seaborne RA, Hughes TM, et al. Transcriptomic and epigenetic regulation of disuse atrophy and the return to activity in skeletal muscle. Faseb J. 2017.; doi:10.1096/fj.201700089RR.
- Tsumagari K, Baribault C, Terragni J, et al. DNA methylation and differentiation: HOX genes in muscle cells. Epigen Chromatin. 2013;6:25. doi:10.1186/1756-8935-6-25.
- Lacey MR, Baribault C, Ehrlich M. Modeling, simulation and analysis of methylation profiles from reduced representation bisulfite sequencing experiments. Stat Appl Genet Mol Biol. 2013;12:723–742. doi:10.1515/sagmb-2013-0027. PMID:24163200
- Kent WJ, Sugnet CW, Furey TS, et al. The human genome browser at UCSC. Genome Res. 2002;12:996–1006. doi:10.1101/gr.229102. PMID:12045153
- Hnisz D, Abraham BJ, Lee TI, et al. Super-enhancers in the control of cell identity and disease. Cell. 2013;155:934–947. doi:10.1016/j.cell.2013.09.053. PMID:24119843
- Qin J, Tsai SY, Tsai MJ. The critical roles of COUP-TFII in tumor progression and metastasis. Cell Biosci. 2014;4:58. doi:10.1186/2045-3701-4-58. PMID:25328664
- Bringuier PP, Schalken JA, Hervieu V, et al. Involvement of orphan nuclear receptor COUP-TFII in cadherin-6 and cadherin-11 regulation: implications in development and cancer. Mech Dev. 2015;136:64–72. doi:10.1016/j.mod.2015.02.001. PMID:25687954
- Ehrlich M, Sanchez C, Shao C, et al. ICF, an immunodeficiency syndrome: DNA methyltransferase 3B involvement, chromosome anomalies, and gene dysregulation. Autoimmunity. 2008;41:253–271. doi:10.1080/08916930802024202. PMID:18432406
- Heyn H, Vidal E, Sayols S, et al. Whole-genome bisulfite DNA sequencing of a DNMT3B mutant patient. Epigenetics. 2012;7:542–550. doi:10.4161/epi.20523. PMID:22595875
- The_GTEx_Consortium. Human genomics. The genotype-tissue expression (GTEx) pilot analysis: Multitissue gene regulation in humans. Science (New York, NY.). 2015;348:648–660. doi:10.1126/science.1262110.
- Mortada I, Mortada R. Epigenetic changes in mesenchymal stem cells differentiation. Eur J Med Genet. 2017; PMID:29079547
- Stelzer G, Rosen N, Plaschkes I, et al. The GeneCards Suite: From gene data mining to disease genome sequence analyses. Curr Protoc Bioinformatics. 2016;54:1.30.1–1..3. doi:10.1002/cpbi.5.
- Himeda CL, Barro MV, Emerson CP, Jr. Pax3 synergizes with Gli2 and Zic1 in transactivating the Myf5 epaxial somite enhancer. Devel Biol. 2013;383:7–14. doi:10.1016/j.ydbio.2013.09.006.
- Khan A, Zhang X. dbSUPER: a database of super-enhancers in mouse and human genome. Nucleic Acids Res. 2016;44:D164–71. doi:10.1093/nar/gkv1002. PMID:26438538
- Ponnaluri VK, Ehrlich KC, Zhang G, et al. Association of 5-hydroxymethylation and 5-methylation of DNA cytosine with tissue-specific gene expression. Epigenetics. 2016:1–16.
- Ghirlando R, Felsenfeld G. CTCF: making the right connections. Genes Dev. 2016;30:881–891. doi:10.1101/gad.277863.116. PMID:27083996
- Wang H, Maurano MT, Qu H, et al. Widespread plasticity in CTCF occupancy linked to DNA methylation. Genome Research. 2012;22:1680–1688. doi:10.1101/gr.136101.111. PMID:22955980
- Ehrlich M, Ehrlich KC. DNA cytosine methylation and hydroxymethylation at the borders. Epigenomics. 2014;6:563–566. doi:10.2217/epi.14.48. PMID:25531248
- Wen L, Li X, Yan L, et al. Whole-genome analysis of 5-hydroxymethylcytosine and 5-methylcytosine at base resolution in the human brain. Genome Biol. 2014;15:R49. doi:10.1186/gb-2014-15-3-r49. PMID:24594098
- Lindskog C, Linne J, Fagerberg L, et al. The human cardiac and skeletal muscle proteomes defined by transcriptomics and antibody-based profiling. BMC Genomics. 2015;16:475. doi:10.1186/s12864-015-1686-y. PMID:26109061
- Buckingham M. Gene regulatory networks and cell lineages that underlie the formation of skeletal muscle. Proc Natl Acad Sci U S A. 2017;114:5830–5837. doi:10.1073/pnas.1610605114. PMID:28584083
- Gladman JT, Yadava RS, Mandal M, et al. NKX2-5, a modifier of skeletal muscle pathology due to RNA toxicity. Hum Mol Genet. 2015;24:251–264. doi:10.1093/hmg/ddu443. PMID:25168381
- Sheng W, Qian Y, Wang H, et al. DNA methylation status of NKX2-5, GATA4 and HAND1 in patients with tetralogy of fallot. BMC Medical Genomics. 2013;6:46. doi:10.1186/1755-8794-6-46. PMID:24182332
- Charlet J, Duymich CE, Lay FD, et al. Bivalent regions of cytosine methylation and H3K27 acetylation suggest an active role for DNA methylation at enhancers. Molec Cell. 2016;62:422–431. doi:10.1016/j.molcel.2016.03.033. PMID:27153539
- Ehrlich KC, Paterson HL, Lacey M, et al. DNA hypomethylation in intragenic and intergenic enhancer chromatin of muscle-specific genes usually correlates with their expression. Yale J Biol Med. 2016;89:441–455. PMID:28018137
- Yu W, Briones V, Lister R, et al. CG hypomethylation in Lsh-/- mouse embryonic fibroblasts is associated with de novo H3K4me1 formation and altered cellular plasticity. Proc Natl Acad Sci U S A. 2014;111:5890–5895. doi:10.1073/pnas.1320945111. PMID:24711395
- Rinaldi L, Datta D, Serrat J, et al. Dnmt3a and Dnmt3b associate with enhancers to regulate human epidermal stem cell homeostasis. Cell Stem Cell. 2016;19:491–501. doi:10.1016/j.stem.2016.06.020. PMID:27476967
- Heyn H, Vidal E, Ferreira HJ, et al. Epigenomic analysis detects aberrant super-enhancer DNA methylation in human cancer. Genome Biol. 2016;17:11. doi:10.1186/s13059-016-0879-2. PMID:26813288
- Xie X, Tsai SY, Tsai MJ. COUP-TFII regulates satellite cell function and muscular dystrophy. J Clin Invest. 2016;126:3929–3941. doi:10.1172/JCI87414. PMID:27617862
- Lister R, Mukamel EA, Nery JR, et al. Global epigenomic reconfiguration during mammalian brain development. Science New York, NY. 2013;341:1237905. doi:10.1126/science.1237905.
- Jeziorska DM, Murray RJS, De Gobbi M, et al. DNA methylation of intragenic CpG islands depends on their transcriptional activity during differentiation and disease. Proc Natl Acad Sci U S A. 2017;114:E7526–E7535. doi:10.1073/pnas.1703087114. PMID:28827334
- Jjingo D, Conley AB, Yi SV, et al. On the presence and role of human gene-body DNA methylation. Oncotarget. 2012;3:462–474. doi:10.18632/oncotarget.497. PMID:22577155
- Maunakea AK, Chepelev I, Cui K, et al. Intragenic DNA methylation modulates alternative splicing by recruiting MeCP2 to promote exon recognition. Cell Res. 2013;23:1256–1269. doi:10.1038/cr.2013.110. PMID:23938295
- Sarda S, Das A, Vinson C, et al. Distal CpG islands can serve as alternative promoters to transcribe genes with silenced proximal promoters. Genome Research. 2017;27:553–566. doi:10.1101/gr.212050.116. PMID:28223400
- Wood KH, Zhou Z. Emerging Molecular and Biological Functions of MBD2, a Reader of DNA Methylation. Front Genet. 2016;7:93. doi:10.3389/fgene.2016.00093. PMID:27303433
- Xu H, Morishima M, Wylie JN, et al. Tbx1 has a dual role in the morphogenesis of the cardiac outflow tract. Development (Cambridge, England). 2004;131:3217–3227. doi:10.1242/dev.01174. PMID:15175244
- de Wilde J, Hulshof MF, Boekschoten MV, et al. The embryonic genes Dkk3, Hoxd8, Hoxd9 and Tbx1 identify muscle types in a diet-independent and fiber-type unrelated way. BMC Genomics. 2010;11:176. doi:10.1186/1471-2164-11-176. PMID:20230627
- Zhang Z, Baldini A. In vivo response to high-resolution variation of Tbx1 mRNA dosage. Hum Mol Genet. 2008;17:150–157. doi:10.1093/hmg/ddm291. PMID:17916582
- Shimbo T, Dunnick JK, Brix A, et al. DNA Methylation Changes in Tbx3 in a Mouse Model Exposed to Polybrominated Diphenyl Ethers. Int J Toxicol. 2017:1091581817706676.
- Lagha M, Sato T, Regnault B, et al. Transcriptome analyses based on genetic screens for Pax3 myogenic targets in the mouse embryo. BMC Genomics. 2010;11:696. doi:10.1186/1471-2164-11-696. PMID:21143873
- Lee HJ, Kao CY, Lin SC, et al. Dysregulation of nuclear receptor COUP-TFII impairs skeletal muscle development. Sci Rep. 2017;7:3136. doi:10.1038/s41598-017-03475-5. PMID:28600496
- Liu W, Sui F, Liu J, et al. PAX3 is a novel tumor suppressor by regulating the activities of major signaling pathways and transcription factor FOXO3a in thyroid cancer. Oncotarget. 2016;7:54744–54757. PMID:27458157
- Li X, Wang J, Jiang Z, et al. Role of PRDM16 and its PR domain in the epigenetic regulation of myogenic and adipogenic genes during transdifferentiation of C2C12 cells. Gene. 2015;570:191–198. doi:10.1016/j.gene.2015.06.017. PMID:26071185
- Harel I, Maezawa Y, Avraham R, et al. Pharyngeal mesoderm regulatory network controls cardiac and head muscle morphogenesis. Proc Natl Acad Sci U S A. 2012;109:18839–18844. doi:10.1073/pnas.1208690109. PMID:23112163
- Bae CJ, Park BY, Lee YH, et al. Identification of Pax3 and Zic1 targets in the developing neural crest. Devel Biol. 2014;386:473–483. doi:10.1016/j.ydbio.2013.12.011.
- van Eijk KR, de Jong S, Boks MP, et al. Genetic analysis of DNA methylation and gene expression levels in whole blood of healthy human subjects. BMC Genomics. 2012;13:636. doi:10.1186/1471-2164-13-636. PMID:23157493
- Myers RM, Stamatoyannopoulos J, Snyder M, et al. A user's guide to the encyclopedia of DNA elements (ENCODE). PLoS Biol. 2011;9:e1001046. doi:10.1371/journal.pbio.1001046. PMID:21526222
- Song Q, Decato B, Hong EE, et al. A reference methylome database and analysis pipeline to facilitate integrative and comparative epigenomics. PloS One. 2013;8:e81148. doi:10.1371/journal.pone.0081148. PMID:24324667
- Stubbs TM, Bonder MJ, Stark AK, et al. Multi-tissue DNA methylation age predictor in mouse. Genome Biol. 2017;18:68. doi:10.1186/s13059-017-1203-5. PMID:28399939
- Wang ET, Sandberg R, Luo S, et al. Alternative isoform regulation in human tissue transcriptomes. Nature. 2008;456:470–476. doi:10.1038/nature07509. PMID:18978772