
ABSTRACT
Histone deacetylases (HDACs) play vital roles in the pathophysiology of heart failure, which is associated with mitochondrial dysfunction. Tumor necrosis factor-α (TNF-α) contributes to the genesis of heart failure and impairs mitochondria. This study evaluated the role of HDACs in TNF-α-induced mitochondrial dysfunction and investigated their therapeutic potential and underlying mechanisms. We measured mitochondrial oxygen consumption rate (OCR) and ATP production using Seahorse XF24 extracellular flux analyzer and bioluminescent assay in control and TNF-α (10 ng/ml, 24 h)-treated HL-1 cells with or without HDAC inhibition. TNF-α increased Class I and II (but not Class IIa) HDAC activities (assessed by Luminescent) with enhanced expressions of Class I (HDAC1, HDAC2, HDAC3, and HDAC8) but not Class IIb HDAC (HDAC6 and HDAC10) proteins in HL-1 cells. TNF-α induced mitochondrial dysfunction with impaired basal, ATP-linked, and maximal respiration, decreased cellular ATP synthesis, and increased mitochondrial superoxide production (measured by MitoSOX red fluorescence), which were rescued by inhibiting HDACs with MPT0E014 (1 μM, a Class I and IIb inhibitor), or MS-275 (1 μM, a Class I inhibitor). MPT0E014 reduced TNF-α-decreased complex I and II enzyme (but not III or IV) activities (by enzyme activity microplate assays). Our results suggest that Class I HDAC actions contribute to TNF-α-induced mitochondrial dysfunction in cardiomyocytes with altered complex I and II enzyme regulation. HDAC inhibition improves dysfunctional mitochondrial bioenergetics with attenuation of TNF-α-induced oxidative stress, suggesting the therapeutic potential of HDAC inhibition in cardiac dysfunction.
Introduction
Mitochondrial dysfunction plays a vital role in heart failure (HF) since the heart is highly dependent on mitochondrial ATP production and the myocardium possesses the largest number of mitochondria of any tissue [Citation1]. A large variety of mitochondrial impairments, including structural, functional, and dynamic abnormalities, exist in both humans and experimental HF models [Citation2,Citation3]. Mitochondria produce the majority of the required ATP through oxidative phosphorylation in four enzyme complexes (I, II, III, and IV), and ATP synthase (complex V) in cardiomyocytes [Citation4]. HF is commonly associated with mitochondrial dysfunction with excessive reactive oxygen species (ROS) production, a decrease in the maximal rate of ATP synthesis, and bioenergetics changes [Citation5,Citation6]. Moreover, targeting mitochondria is considered a therapeutic strategy for HF [Citation7,Citation8].
Epigenetics critically regulate cardiac functions [Citation9–11]. Posttranslational modifications by protein acetylation, which occurs at lysine residues on histone and non-histone proteins, commonly modulates cardiac electrical and structural remodeling in HF [Citation12]. Gene deletion and overexpression studies demonstrated the important role of histone deacetylases (HDACs) in HF [Citation13]. In addition, HDAC inhibition may improve heart function through regulating cardiac hypertrophy, cardiac fibrosis, apoptosis, oxidative stress, and inflammation [Citation14,Citation15]. Previous studies showed that activated HDACs may contribute to mitochondrial dysfunction, and HDAC inhibition was shown to increase the mitochondrial basal and maximal respiratory capacities, which is accompanied by increased mitochondrial complex proteins in myoblasts [Citation16]. However, it is not clear whether actions by HDACs play a role in cardiac mitochondrial dysfunction. Moreover, HDAC inhibition may improve HF through modulating mitochondria. Tumor necrosis factor-α (TNF-α), the pro-inflammatory cytokine, critically regulates the genesis of HF. TNF-α impairs myocardial function by a variety of molecular mechanisms, including increased ROS production in HF patients, and it is correlated with HF severity and prognosis [Citation17,Citation18]. Moreover, mitochondria is the major source of ROS production in TNF-α-induced cell death mediated by impaired mitochondrial function [Citation19,Citation20]. The purposes of this study were to study the role of HDACs in TNF-α-induced mitochondrial impairment, and explore the mechanisms and potential of HDACs as therapeutic targets in mitochondrial dysfunction.
Results
HDAC enzyme activity in control and TNF-α-treated cells
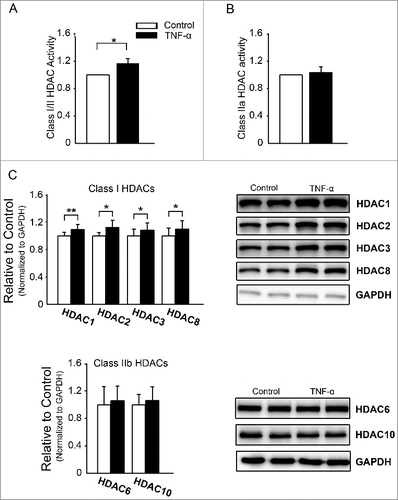
We measured Class I/II and Class IIa HDACs activity in control and TNF-α (10 ng/ml, 24 h)-treated cells to find whether and which specific class HDACs may underlie the effects of TNF-α on mitochondria. Compared to control cells, TNF-α-treated cells had significantly higher Class I and II HDAC enzyme activities ((A)). However, control and TNF-α-treated cells had similar Class IIa HDAC enzyme activities ((B)). We detected protein expressions (one of major factors regulating HDACs enzyme activities) of Class I and IIb HDAC isoforms in control and TNF-α-treated cells ((C)) and found that TNF-α-treated cells had greater expressions of Class I HDAC proteins (HDAC1, HDAC2, HDAC3, and HDAC8) than control cells. Nevertheless, there were similar protein expression of HDAC6 and HDAC10 (Class IIb) between the two groups.
Figure 1. Class I and II histone deacetylase (HDAC) activities and proteins in control and tumor necrosis factor (TNF)-α (10 ng/ml)-treated cells. (A) TNF-α-treated cells had higher total Class I and II HDAC activities than control cells (n = 5 experiments per group). (B) Control and TNF-α-treated cells had similar Class IIa HDAC activities (n = 5 experiments per group). (C) Class I HDAC protein HDAC-1, -2, -3, and -8 levels in TNF-α-treated cells were higher than those in control cells, but Class IIa HDAC proteins (HDAC-6 and -10) were similar between the two groups (n = 10 independent experiments per group). *P<0.05, **P<0.01.
Mitochondrial oxygen consumption rate (OCR) in TNF-α-treated cells with and without HDAC inhibition
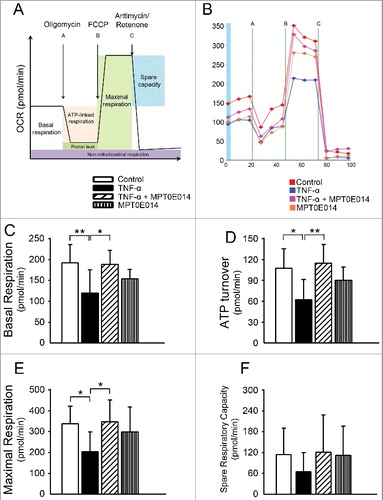
We studied the effects of TNF-α on mitochondria in cardiomyocytes by examining mitochondrial respiration through measurement of OCRs. We found that TNF-α-treated cells had significantly decreased basal, maximal, and ATP-linked OCRs than control cells (, Supplementary Table 1). Co-exposure to MPT0E014 (1 µM, 24 h) in TNF-α-treated cells produced improved mitochondrial respiration to a similar extent as control cells. However, the spare respiratory capacity was similar between control and TNF-α-treated cells with and without MPT0E014.
Figure 2. Oxygen consumption rates (OCRs) and bioenergetics parameters in control cells and cells treated with tumor necrosis factor (TNF)-α with and without MPT0E014. Schematic image (panel A) and representative tracing (panel B) of OCRs as determined by a Seahorse XF24 Extracellular Flux Analyzer. Co-exposure to MPT0E014 (1 µM) in TNF-α (10 ng/ml)-treated cells produced significantly higher levels of basal respiration (panel C), ATP turnover (panel D), and maximal respiration (panel E) than TNF-α-treated cells. (F) The spare respiratory capacity did not significantly differ in control cells, cells treated with TNF-α with and without MPT0E014, or MPT0E014-treated cells (n = 5 independent experiments per group). Data of each experiment represent five Seahorse microplate wells. *P<0.05, **P<0.01 analyzed by one-way repeated measures ANOVA with Fisher's LSD.
Effects of different HDAC inhibitors on ATP synthesis
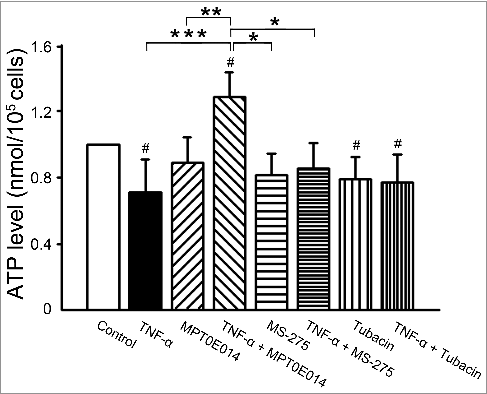
To investigate which class of HDACs inhibition may majorly contribute to MPT0E014-improved mitochondrial respiration, we measured cellular ATP production in TNF-α-treated cells combined with different class HDAC inhibitors. As shown in , compared to control HL-1 cells, ATP synthesis was lower in TNF-α-treated cells. Treatment with MPT0E014 significantly increased ATP synthesis in TNF-α-treated HL-1 cells. There were similar ATP synthesis levels in control and TNF-α-treated cells in the presence of MS-275 (1 µM). In contrast, TNF-α-treated cells with and without Tubacin (1 µM) had similar ATP synthesis levels, which were significantly lower than that of control cells. Moreover, TNF-α-treated cells with MPT0E014 had greater ATP synthesis than TNF-α-treated cells with MS-275.
Figure 3. Effects of different class HDAC inhibitions on ATP synthesis. ATP synthesis was lower in TNF-α-treated cells compared to control HL-1 cells. Treatment with MPT0E014 and MS-275 (Class I HDAC inhibition, 1 μM) attenuated impaired ATP synthesis in tumor necrosis factor (TNF)-α-treated cells, whereas HDAC6 inhibition by Tubacin (1 μM) had no effect on ATP synthesis compared to TNF-α-treated cells (n = 6 independent experiments per group). # P<0.05 versus control, *P<0.05, **P<0.01, ***P<0.005.
Effects of MPT0E014 on mitochondrial electron transfer chain (ETC) complex activities and protein amounts
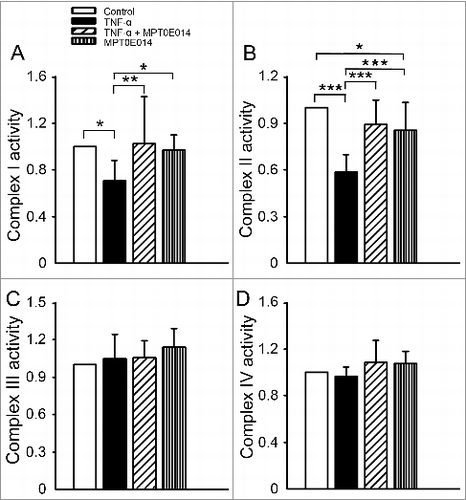
To further investigate whether MPT0E014-improved mitochondrial respiration and ATP production was associated with mitochondrial electron transfer complexes (the core unit of mitochondrial respiration ATP production), or increased mitochondrial biogenesis, we measured electron transfer complexes activity and mitochondrial (mt)DNA copy number. A real-time qPCR revealed no significant differences in mtDNA copy numbers in control, TNF-α, TNF-α combined with MPT0E014, and MPT0E014 alone groups (100%, 93±14%, 100±13%, 95±7%, P>0.05, n = 5 independent experiments). However, as shown in , TNF-α-treated cells had reduced complex I and II activities compared to control cells. However, the activities of complexes III and IV were similar between control and TNF-α-treated cells. Co-treatment with MPT0E014 (1 µM) significantly abolished the effects of TNF-α on complex I and II enzyme activities (, Supplementary Table 2). To clarify whether improved mitochondrial complex activity was associated with increased protein amount, we measured complex I-V protein in HL-1 cell groups and found similar protein levels of key subunits of mitochondrial complexes I-V in different groups (Supplementary ).
Figure 4. Effects of MPT0E014 on mitochondrial electron transport chain complex activities. Complex I (panel A) and II (panel B) enzyme activities were smaller in tumor necrosis factor (TNF)-α (10 ng/ml)-treated cells than in control and TNF-α-treated with MPT0E014 (1 µM) HL-1 cells (n = 7 experiments per group). Complex III (panel C) and IV (panel D) enzyme activities were similar in control, TNF-α with or without MPT0E014, and MPT0E014-treated HL-1 cells (n = 5 experiments per group). *P<0.05, **P<0.01, ***P<0.005 analyzed by one-way repeated measures ANOVA with Fisher's LSD.
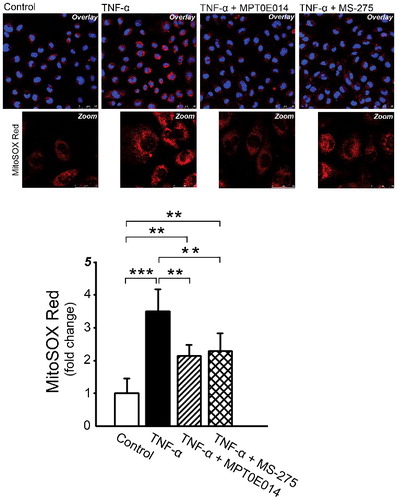
Effects of MPT0E014 and MS-275 on mitochondrial ROS production
Since ROS plays a critical role in mitochondria dysfunction, we investigated the role of ROS in the downregulation of Class I HDAC inhibition. We compared the effects of MPT0E014 and MS-275 (Class I HDAC-specific inhibitor) on mitochondrial superoxide production using confocal microscopy and quantitative image analysis. As presented in , TNF-α dramatically increased mitochondrial ROS production, but in the presence of MPT0E014 and MS-275 inhibitors, TNF-α-treated cells had significantly lower superoxide production in HL-1 cells.
Figure 5. Effects of MPT0E014 and Class 1 histone deacetylase (HDAC) inhibition (MS-275) on mitochondrial reactive oxygen species (ROS) production. MPT0E014 and MS-275 (1 µM) attenuated increased mitochondrial ROS production in tumor necrosis factor (TNF)-α-treated cells. (n = 3 independent experiments per group). **P<0.01, ***P<0.005 analyzed by one-way repeated measures ANOVA with Fisher's LSD.
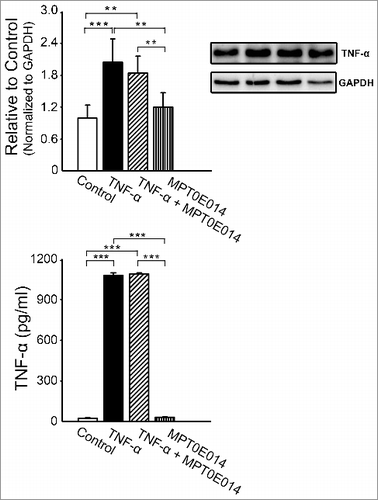
Effects of MPT0E014 on TNF-α in cell and cell supernatant
In order to exclude the possibility that MPT0E014 may modulate the effects of TNF-α through directly reducing TNF-α, we measured TNF-α protein in cell lysate and cell supernatants. We found that TNF-α with and without MPT0E104 groups had similar TNF-α protein expression and cytokine level, which were significantly higher than control and MPT0E014 alone groups ().
Figure 6. Effects of MPT0E014 on tumor necrosis factor (TNF)-α level. Compared to control and MPT0E014-treated groups, tumor necrosis factor (TNF)-α protein level was significantly higher in TNF-α with and without MPT0E014-treated cells (n = 5 independent experiments per group) and cell supernatants (n = 5 independent experiments per group). But TNF-α with and without MPT0E014-treated cells had similar level of TNF-α in cell lysate and cell supernatants. **P<0.01, ***P<0.01 analyzed by one-way repeated measures ANOVA with Fisher's LSD.
Discussion
In the present study, we showed that TNF-α induced mitochondrial dysfunction in cardiomyocytes through the action of Class I HDACs. We found that HDAC inhibition by MPT0E014 at 1 μM potentially normalized TNF-α-induced mitochondrial dysfunction in cardiomyocytes through rescuing mitochondrial bioenergetics by improving mitochondrial basal, maximal, and ATP-linked respiration levels, increasing energy availability, decreasing ROS production, and normalizing activities of both mitochondrial complexes I and II.
The pro-inflammatory cytokine TNF-α is well known to play a vital role in the pathogenesis of HF [Citation21]. Tissue and circulating levels of TNF-α were higher in both patients and animals with HF, and it was associated with worsened clinical outcomes of the disease [Citation18,Citation22,Citation23]. A TNF-α injection induced left ventricular dysfunction and was associated with depleted ATP synthesis and excessive mitochondrial ROS production with impaired complex I activity in rats [Citation24]. Moreover, TNF-α exposure induced cell death through dose-dependent decreases in mitochondrial basal, maximal, and ATP-linked respiration levels with collapsed membrane potential in neurons [Citation20,Citation25]. Previous studies showed positive correlations of TNF-α with HDAC activities and protein expressions. TNF-α significantly increased HDAC activity with elevated HDAC1 messenger RNA and protein expressions in synovial tissues and fibroblasts [Citation26]. In addition, isoproterenol-induced HF was associated with increased expressions of Class I HDACs (HDAC-1, -2, and -3), HDACIIa (HDAC4), and HDACIIb (HDAC6), which suggests that TNF-α may induce cardiac dysfunction through the actions of HDACs [Citation27]. Increased HDAC1 activity by TNF-α was hypothesized to result in nuclear factor (NF)-κB-dependent inflammatory gene expression [Citation28,Citation29]. However, TNF-α has been shown to decrease HDAC1 activity in neonatal rat cardiomyocytes or cancer cells [Citation30,Citation31]. These discrepancies may arise from different experimental setting and the measurement of HDAC activity, whereas we evaluated Class 1 HDAC activity, including that from HDAC1, HDAC2, HDAC3 and HDAC8. The rescue effects of HDAC inhibition by MPT0E014 at 1 µM also suggests that Class I HDACs play a role in TNF-α-induced mitochondrial dysfunction since MPT0E014 at 1 µM inhibits more Class I HDACs than Class II HDACs (with >90% inhibition of HDAC-1, -2, -3, and -10). Previous studies have shown that HDAC inhibition may have effects on inflammatory cytokines [Citation32]. We evaluated the effects of MPT0E014 on TNF-α amount and found that MPT0E014 did not significantly change TNF-α levels in both cells and cells supernatant. These findings are consistent with a previous study in which TSA (pan-HDAC inhibition) has no significant effect on reducing TNF-α production [Citation33].
We found that after co-exposure to HDAC inhibition, MPT0E014 significantly improved mitochondrial oxygen consumption rate (OCR) by increasing ATP-linked respiration, which was reflected in ATP production, and basal and maximal respiration rates in cardiomyocytes. However, the reserve capacity or spare respiratory capacity, which is an estimate of the potential bioenergetics capacity of a cell available to meet increased ATP demands, was similar among the control, TNF-α with and without MPT0E014, and MPT0E014-alone treatment groups. Similar total mtDNA copy numbers in TNF-α-treated HL-1 cells with and without MPT0E014 co-administration suggest that different rates of respiration in different groups of HL-1 cells might not be related to the total mitochondrial number. Interestingly, this study found that combination of MPT0E014 and TNF-α-treated HL-1 has higher ATP levels than other groups, which suggest that MPT0E014 may have distinctive effects in regulating TNF-α-mediated mitochondrial dysfunction.
We performed both mitochondrial complex activity assays and protein analyses to evaluate whether the effects of MTP0E014 on mitochondria could arise from regulation of different complexes of the mitochondrial ETC. We found that TNF-α-treated cells had lower complex I and II activities, which were normalized by co-treatment with MPT0E014. However, similar ETC complex proteins in control cells and TNF-α with and without MPT0E014-treated cells indicates that the observed improvement in enzyme activity was not due to increased protein expression or an increased mitochondrial mass. Moreover, ATP synthesis driven by complex I or II substrates decreased in TNF-α-treated HL-1 cells. These findings are consistent with previous studies in both humans and animals with heart pathology, in which a TNF-α infusion reduced overall ATP production by particularly impairing ETC complex I activity and increasing ROS levels in left ventricle mitochondria [Citation24,Citation34]. Complex I is the largest enzyme complex of mitochondrial ETC, and is thought to be more susceptible to various stresses because most of the subunits are controlled by mtDNA [Citation35]. Moreover, proteome-wide screening identified lysine residues on subunits of both complexes I and II as targets of deacetylases, which lead to modulation of their activities [Citation36]. The ability of MPT0E014 to increase ATP synthesis and ETC complex enzyme activities in the absence of changes in protein expressions of representative subunits of complexes I-V suggests that posttranslational modifications, possibly protein acetylation, are likely responsible for this change in complex activity. A previous study showed that inhibition of HDAC3 at a high concentration (5 µM) was responsible for the effects of MS-275 in myotubes, which blocked both HDAC1 and HDAC3 [Citation16]. Moreover, HDAC1 and HDAC3 repress the transcriptional activity of PGC-1α, which is a transcriptional coactivator essential for mitochondrial biogenesis, by binding to two different regions of its promoter [Citation37–39]. To evaluate which HDAC isoform contributes to the effects of MPT0E014 in TNF-α-treated HL-1 cells, we tested the effects of MS-275, a relatively specific HDAC1 inhibitor, at 1 µM and Tubacin, a relatively specific HDAC6 inhibitor, at 1 µM in studied cells. We found that treatment with MS-275 (but not with Tubacin) resulted in increased ATP synthesis. Mitochondria are the major source of ROS in cells and in dysfunctional mitochondria, decreased complex I and II activity predominantly produce superoxide production leading to decreased mitochondrial membrane potential and ATP synthesis [Citation40]. We investigated whether ROS may play a role in the downregulation of Class I HDAC inhibition. We found that TNF-α dramatically increased mitochondrial ROS production, which were attenuated by MPT0E014 or MS-275 (Class I HDAC specific inhibitor). In contrast, Tubacin (HDAC6 specific inhibitor) did not change TNF-α-induced mitochondrial ROS production (data not shown). These findings suggested that Class I HDACs inhibition may reduce oxidative stress to rescue TNFα-induced mitochondrial impairment, at least in part.
Previous studies also have found that HDAC inhibitors (the pan-inhibitor SAHA and the Class I HDAC-selective inhibitor MS-275) treatment resulted in greater oxygen consumption along with increases in mitochondrial biogenesis, complex I and II proteins, and mitochondrial activity in skeletal muscle and adipose tissues [Citation16]. As shown in , our results suggest that Class I HDACs actions contribute to TNF-α-induced mitochondrial dysfunction in cardiomyocytes with altered complex I and II enzyme activity. HDAC inhibition improves dysfunctional mitochondrial bioenergetics profile associated with attenuation of TNF-α-induced oxidative stress. Our results suggest that HDACs are the potential targets of cardiac dysfunction.
Figure 7. Hypothesized mechanisms of Class I HDACs and HDAC inhibitors in tumor necrosis factor (TNF)-induced mitochondrial dysfunction. HDAC inhibitors rescue impaired mitochondrial dysfunction by restoring mitochondrial respiration followed by increased ATP production and decreased oxidative stress. Class I histone deacetylase (HDAC) includes HDAC-1, -2, -3 and -8. ETC = electron transfer chain, mtROS = mitochondria reactive oxygen species.

There are some limitations of this study. Although we found that HDAC inhibition normalized mitochondrial dysfunction through rescuing complex activities and restoring the respiration capacity of TNF-α-treated cells, the underlying signaling kinases were not fully elucidated. Clarifying the detailed molecular mechanisms for HDAC inhibition-regulated mitochondrial function will advance our understanding of HDACs in HF. In addition, the long-term effects of HDAC inhibition on mitochondrial dysfunction in cardiomyocytes remain vague. Finally, we proved the effects of Class 1 HDAC inhibition in rescuing TNF-α-mediated mitochondrial dysfunction in HL-1 cells, which may not completely reflect adult cardiomyocyte phenotype. Thus, it is not clear whether our findings are applicable to other experimental settings or translatable to the clinic.
Conclusions
HDAC inhibition can improve dysfunctional mitochondrial bioenergetics by increasing the availability of energy and restoring complex I and II enzyme activities in cardiomyocytes in vitro.
Material and methods
Cell culture
HL-1 cells derived from mouse atrial cardiac muscle cells (kindly provided by Dr. Claycomb, Louisiana State University Medical Center, New Orleans, LA) were cultured in a 5% CO2 humidified atmosphere at 37°C in Claycomb medium (JRH Biosciences, Lenexa, KS), as described previously [Citation41]. Cells were treated with or without TNF-α (10 ng/ml, Sigma) or MPT0E014 (1 μM, with >90% inhibition of HDAC-1, -2, -3, and -10). We also studied MS-275 (a relative HDAC1 inhibitor at 1 μM) [Citation42] (Cayman Chemical, MI) and Tubacin (HDAC6 inhibitor with IC50 of 4 nM) [Citation43] (Sigma-Aldrich, St. Louis, MO) in HL-1 cells to clarify whether more specific HDAC inhibition may have effects on mitochondrial dysfunction.
Mitochondria were isolated from HL-1 cells using a Mitochondria Isolation Kit for Cultured Cells (Pierce) according to the manufacturer's protocol.
Mitochondrial oxygen consumption rate (OCR)
Cells were transferred at a density of 2 × 10⁵ cells/well in unbuffered Dulbecco's modified Eagle medium (DMEM) at pH 7.4 to wells of an XF24 Seahorse assay plate to measure the mitochondrial OCR by an XF analysis (XF24, Seahorse Bioscience, Billerica, MA). Cells were incubated at 37°C without CO2 for 1 h for equilibration before initiating the assay. For the bioenergetics profile measurement, the basal OCR was first measured in triplicate. Cells were consecutively treated with oligomycin (1 µmol/L) to inhibit ATP synthase, followed by the addition of carbonyl cyanide p-trifluoromethoxy phenylhydrazone (FCCP; 1 µmol/L) to produce maximal uncoupled respiration. Non-mitochondrial respiration was determined by the addition of rotenone (0.5 µM) and antimycin A (0.5 µM). The optimal concentration of each modulator was determined in concentration response experiments. Using these conditions, we examined the effects of an HDAC inhibitor on mitochondrial basal respiration (baseline respiration – antimycin A+rotenone post-injection respiration), ATP-linked respiration (baseline respiration – oligomycin post-injection respiration), maximal respiratory capacity (FCCP-stimulated respiration – antimycin A+rotenone post-injection respiration), and reserve respiratory capacity (FCCP-stimulated respiration – baseline respiration).
Cellular ATP content
Intracellular levels of ATP were measured using a bioluminescent ATP assay kit (FLAA, Sigma-Aldrich) based on the conversion of luciferin to light by firefly luciferase in an ATP-dependent manner. The light emitted is proportional to the ATP present; to determine the ATP concentration, all samples were referenced to an ATP standard curve with known concentrations ranging from 10−12 to 10−4 M and normalized to the cell number.
Activities of mitochondrial ETC complexes
Activities of mitochondrial ETC complexes I-IV were measured using microplate enzyme assay kits according to the manufacturer's protocols (ab109721, ab109908, ab109905, and ab109909, Abcam, Cambridge, MA). Fresh cell pellets were resuspended in phosphate-buffered saline (PBS) supplemented with 10% detergent provided in the kits. Protein concentrations of cell lysates and isolated mitochondria were determined and a total of 100 (for complexes I, II, and IV) and 10 µg (for complex III) of protein were used in each reaction. All tests were run in triplicate and results are expressed as changes in absorbance per minute per milligram of protein.
HDAC enzyme activity
HDAC enzyme activity was determined using an HDAC-GLO Class I/II and Class IIa luminescence assay kit (Promega, Madison, WI). Class-specific HDAC activities were assessed according to the manufacturer's instructions. Briefly, cells were transferred at a density of 50,000 cells/well into white 96-well plates in serum-free medium to achieve the best assay performance. Following the protocol, Class I/II and Class IIa final detection reagents were added to each well. After incubation for 20 min at room temperature, luminescence was measured using a Varioskan Flash reader (Thermo Fisher Scientific, Waltham, MA).
Western blot analysis
HL-1 cells were lysed in protein extraction reagent (Thermo Fisher Scientific) with protease inhibitor cocktails (Sigma, St. Louis, MO). Equal amounts of proteins were separated in gradient sodium polyacrylamide gel electrophoresis (SDS-PAGE) under reducing conditions and electrophoretically transferred onto an equilibrated polyvinylidene difluoride membrane (Amersham Biosciences, Buckinghamshire, UK). Blots were probed with primary antibodies against TNF-α (Calbiochem, San Diego, CA), HDAC1, HDAC3 (Santa Cruz Biotechnology, Santa Cruz, CA), HDAC2, HDAC6 (Cell Signaling, Danvers, MA), HDAC8 (Sigma-Aldrich), and HDAC10. The total OXPHOS antibody cocktail contained five antibodies: against complex I subunit NDUFB8, complex II subunit B (SDHB), complex III core protein 2 (UQCRC2), complex IV subunit I (MTCO1), and complex V alpha subunit (ATP5A) (Abcam, Cambridge, UK). Bound antibodies were detected using an enhanced chemiluminescence (ECL) detection system (Santa Cruz Biotechnology) and analyzed with AlphaEase FC software (Alpha Innotech, San Leandro, CA). Targeted bands were normalized to glyceraldehyde 3-phoshate dehydrogenase (GAPDH, MBL, Nagoya, Japan) to confirm equal protein loading.
Cytokine detection by ELISA
Cell supernatants were collected and freshly used for cytokine measurement using a Quantikine ELISA Kit (R&D Systems Europe) for TNF-α following manufacturer's protocol.
Mitochondrial ROS production
Mitochondrial superoxide production was measured using MitoSox red fluorescence dye (Invitrogen) in a confocal microscopy (Leica TCS SP5 II). Following treatments, cells were counterstained with 2.5 μM MitoSox red and 10 ng/ml Hoechst blue dye for 10 min at 37°C followed by washing. MitoSox fluorescence intensity was measured in 4 random fields in each experiment. Data were analyzed using TissueQuest 6.0 analysis software. Results are expressed as mean ± standard error of the mean (SEM) fluorescence intensity per cell.
Statistical analysis
All quantitative data are expressed as the mean ± SEM. A paired t-test or one-way analysis of variance (ANOVA, repeated or non-repeated measures) followed by Fisher's LSD post-hoc test were used to compare differences between groups when appropriate. A value of P<0.05 was considered statistically significant.
Disclosure of interest
The authors report no conflict of interest.
Suppl_Figure_1.tif
Download TIFF Image (6.3 MB)Suppl_Table_2-1.docx
Download MS Word (19.4 KB)Suppl_Table_1.docx
Download MS Word (20.5 KB)Acknowledgements
This work was supported by grants from the Ministry of Science and Technology (MOST105-2628-B-038-012-MY3, and MOST 105-2314-B-038-059-MY3), Taipei Medical University-Wan Fang Hospital (104swf02, 104-wf-eva-01, 105-wf-eva-08 and 105-wf-eva-14).
Additional information
Funding
Related Research Data
References
- Barth E, Stammler G, Speiser B, et al. Ultrastructural quantitation of mitochondria and myofilaments in cardiac muscle from 10 different animal species including man. J Mol Cell Cardiol. 1992;24:669–681. Available from: http://dx.doi.org/10.1016/0022-2828(92)93381-S doi:10.1016/0022-2828(92)93381-S. PMID:1404407
- Rosca MG, Hoppel CL. Mitochondrial dysfunction in heart failure. Heart Fail Rev. 2013;18:607–622. Available from: http://dx.doi.org/10.1007/s10741-012-9340-0 doi:10.1007/s10741-012-9340-0. PMID:22948484
- Marin-Garcia J, Akhmedov AT, Moe GW. Mitochondria in heart failure: the emerging role of mitochondrial dynamics. Heart Fail Rev. 2013;18:439–456. Available from: http://dx.doi.org/10.1007/s10741-012-9330-2 doi:10.1007/s10741-012-9330-2. PMID:22707247
- Chaban Y, Boekema EJ, Dudkina NV. Structures of mitochondrial oxidative phosphorylation supercomplexes and mechanisms for their stabilisation. Biochim Biophys Acta. 2014;1837:418–426. Available from: http://dx.doi.org/10.1016/j.bbabio.2013.10.004 doi:10.1016/j.bbabio.2013.10.004. PMID:24183696
- Sharov VG, Todor AV, Silverman N, et al. Abnormal mitochondrial respiration in failed human myocardium. J Mol Cell Cardiol. 2000;32:2361–2367. Available from: http://dx.doi.org/10.1006/jmcc.2000.1266 doi:10.1006/jmcc.2000.1266. PMID:11113011
- Sabbah HN. Targeting mitochondrial dysfunction in the treatment of heart failure. Expert Rev Cardiovasc Ther. 2016;14:1305–1313. Available from: http://dx.doi.org/10.1080/14779072.2016.1249466 doi:10.1080/14779072.2016.1249466. PMID:27758146
- Bayeva M, Gheorghiade M, Ardehali H. Mitochondria as a therapeutic target in heart failure. J Am Coll Cardiol. 2013;61:599–610. Available from: http://dx.doi.org/10.1016/j.jacc.2012.08.1021 doi:10.1016/j.jacc.2012.08.1021. PMID:23219298
- Brown DA, Perry JB, Allen ME, et al. Expert consensus document: mitochondrial function as a therapeutic target in heart failure. Nat Rev Cardiol. 2017;14:238–250. Available from: http://dx.doi.org/10.1038/nrcardio.2016.203 doi:10.1038/nrcardio.2016.203. PMID:28004807
- Abend A, Kehat I. Histone deacetylases as therapeutic targets–from cancer to cardiac disease. Pharmacol Ther. 2015;147:55–62. Available from: http://dx.doi.org/10.1016/j.pharmthera.2014.11.003 doi:10.1016/j.pharmthera.2014.11.003. PMID:25444758
- Hewitson R, Dargan J, Collis D, et al. Heart failure: the pivotal role of histone deacetylases. Int J Biochem Cell Biol. 2013;45:448–453. Available from: http://dx.doi.org/10.1016/j.biocel.2012.11.006 doi:10.1016/j.biocel.2012.11.006. PMID:23178536
- Aune SE, Herr DJ, Kutz CJ, et al. Histone deacetylases exert class-specific roles in conditioning the brain and heart against acute ischemic injury. Front Neurol. 2015;6:145. Available from: http://dx.doi.org/10.3389/fneur.2015.00145 doi:10.3389/fneur.2015.00145. PMID:26175715
- Yang XJ, Seto E. Lysine acetylation: codified crosstalk with other posttranslational modifications. Mol Cell. 2008;31:449–461. Available from: http://dx.doi.org/10.1016/j.molcel.2008.07.002 doi:10.1016/j.molcel.2008.07.002. PMID:18722172
- McKinsey TA. Therapeutic potential for HDAC inhibitors in the heart. Annu Rev Pharmacol Toxicol. 2012;52:303–319. Available from: http://dx.doi.org/10.1146/annurev-pharmtox-010611-134712 doi:10.1146/annurev-pharmtox-010611-134712. PMID:21942627
- McKinsey TA. Targeting inflammation in heart failure with histone deacetylase inhibitors. Mol Med. 2011;17:434–441. Available from: http://dx.doi.org/10.2119/molmed.2011.00022 doi:10.2119/molmed.2011.00022. PMID:21267510
- Kao YH, Liou JP, Chung CC, et al. Histone deacetylase inhibition improved cardiac functions with direct antifibrotic activity in heart failure. Int J Cardiol. 2013;168:4178–4183. Available from: http://dx.doi.org/10.1016/j.ijcard.2013.07.111 doi:10.1016/j.ijcard.2013.07.111. PMID:23931972
- Galmozzi A, Mitro N, Ferrari A, et al. Inhibition of class I histone deacetylases unveils a mitochondrial signature and enhances oxidative metabolism in skeletal muscle and adipose tissue. Diabetes. 2013;62:732–742. Available from: http://dx.doi.org/10.2337/db12-0548 doi:10.2337/db12-0548. PMID:23069623
- Ueland T, Gullestad L, Nymo SH, et al. Inflammatory cytokines as biomarkers in heart failure. Clin Chim Acta. 2015;443:71–77. Available from: http://dx.doi.org/10.1016/j.cca.2014.09.001 doi:10.1016/j.cca.2014.09.001. PMID:25199849
- Dunlay SM, Weston SA, Redfield MM, et al. Tumor necrosis factor-alpha and mortality in heart failure: a community study. Circulation. 2008;118:625–631. Available from: http://dx.doi.org/10.1161/circulationaha.107.759191 doi:10.1161/CIRCULATIONAHA.107.759191. PMID:18645056
- Babu D, Leclercq G, Goossens V, et al. Mitochondria and NADPH oxidases are the major sources of TNF-alpha/cycloheximide-induced oxidative stress in murine intestinal epithelial MODE-K cells. Cell Signal. 2015;27:1141–1158. Available from: http://dx.doi.org/10.1016/j.cellsig.2015.02.019 doi:10.1016/j.cellsig.2015.02.019. PMID:25725292
- Doll DN, Rellick SL, Barr TL, et al. Rapid mitochondrial dysfunction mediates TNF-alpha-induced neurotoxicity. J Neurochem. 2015;132:443–451. Available from: http://dx.doi.org/10.1111/jnc.13008 doi:10.1111/jnc.13008. PMID:25492727
- Feldman AM, Combes A, Wagner D, et al. The role of tumor necrosis factor in the pathophysiology of heart failure. J Am Coll Cardiol. 2000;35:537–544. Available from: http://dx.doi.org/10.1016/s0735-1097(99)00600-2 doi:10.1016/S0735-1097(99)00600-2. PMID:10716453
- Bozkurt B, Kribbs SB, Clubb FJ Jr, et al. Pathophysiologically relevant concentrations of tumor necrosis factor-alpha promote progressive left ventricular dysfunction and remodeling in rats. Circulation. 1998;97:1382–1391. Available from: http://dx.doi.org/10.1161/01.CIR.97.14.1382 doi:10.1161/01.CIR.97.14.1382. PMID:9577950
- Torre-Amione G, Kapadia S, Lee J, et al. Expression and functional significance of tumor necrosis factor receptors in human myocardium. Circulation. 1995;92:1487–1493. Available from: http://dx.doi.org/10.1161/01.CIR.92.6.1487 doi:10.1161/01.CIR.92.6.1487. PMID:7664431
- Mariappan N, Elks CM, Fink B, et al. TNF-induced mitochondrial damage: a link between mitochondrial complex I activity and left ventricular dysfunction. Free Radic Biol Med. 2009;46:462–470. Available from: http://dx.doi.org/10.1016/j.freeradbiomed.2008.10.049 doi:10.1016/j.freeradbiomed.2008.10.049. PMID:19041937
- Prajapati P, Sripada L, Singh K, et al. TNF-alpha regulates miRNA targeting mitochondrial complex-I and induces cell death in dopaminergic cells. Biochim Biophys Acta. 2015;1852:451–461. Available from: http://dx.doi.org/10.1016/j.bbadis.2014.11.019 doi:10.1016/j.bbadis.2014.11.019. PMID:25481834
- Kawabata T, Nishida K, Takasugi K, et al. Increased activity and expression of histone deacetylase 1 in relation to tumor necrosis factor-alpha in synovial tissue of rheumatoid arthritis. Arthritis Res Ther. 2010;12:R133. Available from: http://dx.doi.org/10.1186/ar3071 doi:10.1186/ar3071. PMID:20609223
- Lkhagva B, Lin YK, Kao YH, et al. Novel histone deacetylase inhibitor modulates cardiac peroxisome proliferator-activated receptors and inflammatory cytokines in heart failure. Pharmacology. 2015;96:184–191. Available from: http://dx.doi.org/10.1159/000438864 doi:10.1159/000438864. PMID:26304494
- Keslacy S, Tliba O, Baidouri H, et al. Inhibition of tumor necrosis factor-alpha-inducible inflammatory genes by interferon-gamma is associated with altered nuclear factor-kappaB transactivation and enhanced histone deacetylase activity. Mol Pharmacol. 2007;71:609–618. Available from: http://dx.doi.org/10.1124/mol.106.030171 doi:10.1124/mol.106.030171. PMID:17108260
- Nusinzon I, Horvath CM. Interferon-stimulated transcription and innate antiviral immunity require deacetylase activity and histone deacetylase 1. Proc Natl Acad Sci U S A. 2003;100:14742–14747. Available from: http://dx.doi.org/10.1073/pnas.2433987100 doi:10.1073/pnas.2433987100. PMID:14645718
- Gang H, Shaw J, Dhingra R, et al. Epigenetic regulation of canonical TNFalpha pathway by HDAC1 determines survival of cardiac myocytes. Am J Physiol Heart Circ Physiol. 2013;304:H1662–H1669. Available from: http://dx.doi.org/10.1152/ajpheart.00093.2013 doi:10.1152/ajpheart.00093.2013. PMID:23585133
- Vashisht Gopal YN, Arora TS, Van Dyke MW. Tumour necrosis factor-alpha depletes histone deacetylase 1 protein through IKK2. EMBO Rep. 2006;7:291–296. Available from: http://dx.doi.org/10.1038/sj.embor.7400613 doi:10.1038/sj.embor.7400613. PMID:16374504
- Grabiec AM, Tak PP, Reedquist KA. Function of histone deacetylase inhibitors in inflammation. Crit Rev Immunol. 2011;31:233–263. Available from: http://dx.doi.org/10.1615/CritRevImmunol.v31.i3.40 doi:10.1615/CritRevImmunol.v31.i3.40. PMID:21740352
- Toussirot E, Abbas W, Khan KA, et al. Imbalance between HAT and HDAC activities in the PBMCs of patients with ankylosing spondylitis or rheumatoid arthritis and influence of HDAC inhibitors on TNF alpha production. PLoS One. 2013;8:e70939. Available from: http://dx.doi.org/10.1371/journal.pone.0070939 doi:10.1371/journal.pone.0070939. PMID:24039666
- Rosca MG, Hoppel CL. New aspects of impaired mitochondrial function in heart failure. J Bioenerg Biomembr. 2009;41:107–112. Available from: http://dx.doi.org/10.1007/s10863-009-9215-9 doi:10.1007/s10863-009-9215-9. PMID:19347572
- Sharma LK, Lu J, Bai Y. Mitochondrial respiratory complex I: structure, function and implication in human diseases. Curr Med Chem. 2009;16:1266–1277. Available from: http://dx.doi.org/10.2174/092986709787846578 doi:10.2174/092986709787846578. PMID:19355884
- Finley LW, Haas W, Desquiret-Dumas V, et al. Succinate dehydrogenase is a direct target of sirtuin 3 deacetylase activity. PLoS One. 2011;6:e23295. Available from: http://dx.doi.org/10.1371/journal.pone.0023295 doi:10.1371/journal.pone.0023295. PMID:21858060
- Canettieri G, Morantte I, Guzman E, et al. Attenuation of a phosphorylation-dependent activator by an HDAC-PP1 complex. Nat Struct Biol. 2003;10:175–181. Available from: http://dx.doi.org/10.1038/nsb895 doi:10.1038/nsb895. PMID:12567184
- Gregoire S, Xiao L, Nie J, et al. Histone deacetylase 3 interacts with and deacetylates myocyte enhancer factor 2. Mol Cell Biol. 2007;27:1280–1295. Available from: http://dx.doi.org/10.1128/mcb.00882-06 doi:10.1128/MCB.00882-06. PMID:17158926
- Handschin C, Rhee J, Lin J, et al. An autoregulatory loop controls peroxisome proliferator-activated receptor gamma coactivator 1alpha expression in muscle. Proc Natl Acad Sci U S A. 2003;100:7111–7116. Available from: http://dx.doi.org/10.1073/pnas.1232352100 doi:10.1073/pnas.1232352100. PMID:12764228
- Zorov DB, Juhaszova M, Sollott SJ. Mitochondrial reactive oxygen species (ROS) and ROS-induced ROS release. Physiol Rev. 2014;94:909–950. Available from: http://dx.doi.org/10.1152/physrev.00026.2013 doi:10.1152/physrev.00026.2013. PMID:24987008
- Kao YH, Chen YC, Cheng CC, et al. Tumor necrosis factor-alpha decreases sarcoplasmic reticulum Ca2+-ATPase expressions via the promoter methylation in cardiomyocytes. Crit Care Med. 2010;38:217–222. Available from: http://dx.doi.org/10.1097/CCM.0b013e3181b4a854 doi:10.1097/CCM.0b013e3181b4a854. PMID:19730253
- Khan N, Jeffers M, Kumar S, et al. Determination of the class and isoform selectivity of small-molecule histone deacetylase inhibitors. Biochem J. 2008;409:581–589. Available from: http://dx.doi.org/10.1042/bj20070779 doi:10.1042/BJ20070779. PMID:17868033
- Wong JC, Hong R, Schreiber SL. Structural biasing elements for in-cell histone deacetylase paralog selectivity. J Am Chem Soc. 2003;125:5586–5587. Available from: http://dx.doi.org/10.1021/ja0341440 doi:10.1021/ja0341440. PMID:12733869