
ABSTRACT
DNA methylation is recognized as one of several epigenetic regulators of gene expression and as potential driver of carcinogenesis through gene-silencing of tumor suppressors and activation of oncogenes. However, abnormal methylation, even of promoter regions, does not necessarily alter gene expression levels, especially if the gene is already silenced, leaving the exact mechanisms of methylation unanswered. Using a large cohort of matching DNA methylation and gene expression samples of colorectal cancer (CRC; n = 77) and normal adjacent mucosa tissues (n = 108), we investigated the regulatory role of methylation on gene expression. We show that on a subset of genes enriched in common cancer pathways, methylation is significantly associated with gene regulation through gene-specific mechanisms. We built two classification models to infer gene regulation in CRC from methylation differences of tumor and normal tissues, taking into account both gene-silencing and gene-activation effects through hyper- and hypo-methylation of CpGs. The classification models result in high prediction performances in both training and independent CRC testing cohorts (0.92<AUC<0.97) as well as in individual patient data (average AUC = 0.82), suggesting a robust interplay between methylation and gene regulation. Validation analysis in other cancerous tissues resulted in lower prediction performances (0.69<AUC<0.90); however, it identified genes that share robust dependencies across cancerous tissues. In conclusion, we present a robust classification approach that predicts the gene-specific regulation through DNA methylation in CRC tissues with possible transition to different cancer entities. Furthermore, we present HMGA1 as consistently associated with methylation across cancers, suggesting a potential candidate for DNA methylation targeting cancer therapy.
Introduction
DNA methylation, along with histone modification and chromatin remodeling, are important regulators of gene expression. Here, we focus in particular on DNA methylation, which alters the activity of a DNA segment by adding a methyl group to the cytosine carbon 5 of a cytosine-phosphate-guanine (CpG) sequence. However, methylation at non-CpG sites has also been observed, but is comparatively rare [Citation1]. Genome-wide aberrant DNA methylation between colorectal cancer (CRC) and healthy or “normal” adjacent mucosa (normal) tissues [Citation2,Citation3] suggests epigenetic modifications as tumor associated consequences different from the common genetic alterations, such as somatic mutations in APC, KRAS, or TP53. Different CpG methylation patterns, such as the CpG island methylator phenotype (CIMP) [Citation4] have been used to identify CRC subtypes [Citation5], to distinguish CRC from normal tissues [Citation3], or to develop clinical biomarkers [Citation6]. Another scope of application is to infer gene expression from DNA methylation. The current understanding is that promoter methylation associates with gene-silencing and gene body methylation associates with increased transcriptional expression [Citation7–9] across different tissues. Thereby, methylation possibly plays an important role in carcinogenesis by promoting oncogenes and silencing tumor suppressors [Citation2,Citation10]. However, this view has been challenged. It has been suggested that aberrant hypermethylation in cancer is attributed primarily to genes that are already repressed in the tissue of origin and therefore not linked to silencing of tumor suppressor genes and cancer development [Citation5,Citation11]. However, they might maintain low gene expression levels at late disease stages and therefore contribute to a growth advantage of the tumor. Furthermore, methylation changes are predominantly thought to come second after gene regulation, which is rather mediated by other means [Citation12]. Nevertheless, there might be a small fraction of genes in which methylation changes in cancer have an impact on cancer gene expression and, therefore, on carcinogenesis. Indeed, aberrant methylation is not necessarily correlated with gene expression changes in cancer, indicating a gene-specific dependency and a regulatory effect on only a subset of genes [Citation13]. This impedes a generalized interpretation of the influence of CpG methylation on gene expression and an exact model on how DNA methylation regulates gene expression remains elusive [Citation14,Citation15].
Many integrative studies of methylation and gene expression exist [Citation9,Citation14,Citation16,Citation17] but, to our knowledge, only Li et al. [Citation18] proposed a complex model to predict gene regulation (up- or down-regulation) in lung cancer from 67 features that are comprised of CpG methylation, histone H3 methylation, nucleotide composition, and conservation. Most of the times, however, only one or two components of the complex epigenetic data are available, reducing the general applicability of this model.
We utilized DNA methylation and matching gene expression data from the ColoCare cohort [Citation19], including samples taken from CRC tissues and normal tissues of adjacent mucosa, to investigate the regulatory role of DNA methylation on CRC gene expression. We show that gene regulation between CRC and normal tissues can be robustly predicted from DNA methylation differences for a subset of genes, which is enriched in common cancer pathways. To account for gene-specific dependencies between DNA methylation and gene expression, we constructed two prediction models for genes being either negatively or positively correlated between DNA methylation and gene expression. This approach significantly increased our prediction performance compared to a single model. We validated our classification models in independent CRC cohorts and individual patient data with high prediction performance. Validation in other cancer entities resulted in lower prediction performances, suggesting a particularly strong role of DNA methylation in CRC. In addition, we identified a robust regulatory role of DNA methylation on the cancer hallmark gene High Mobility Group AT-Hook 1 (HMGA1) in different cancer entities, suggesting a potential candidate gene for DNA methylation targeting cancer therapy [Citation20–22].
Results
The ColoCare study: DNA methylation and gene expression data
To study the methylation-gene expression relationships, we obtained matching DNA methylation and gene expression data from 77 colorectal cancer (CRC) and 108 adjacent mucosa tissues (Supplementary Table 1) from the ColoCare Study [Citation19]. Adjacent mucosa samples are referred to “normal”; however, they may be affected by molecular crosstalk from cancer cells through activation of pro-tumorigenic functions [Citation23]. After preprocessing and normalization, we annotated CpGs with their associated genes through their location on either the promoter (-1500 bp of the transcription start site – 1st Exon) or the gene body region and furthermore noted their CpG island relation (islands, shores, shelves, open sea; see Materials and Methods for specification) [Citation24].
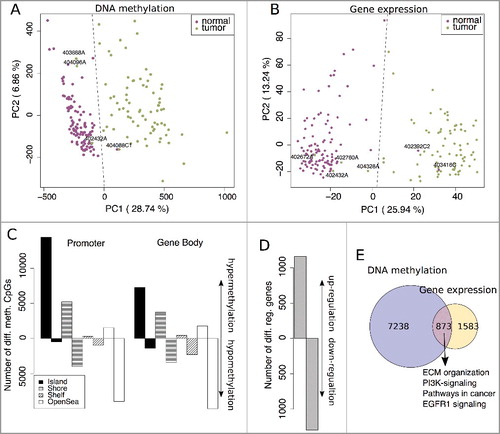
A principal component analysis (PCA) revealed a clear separation between CRC (green) and normal (purple) for most samples in both the DNA methylation (first principal component; PC1 = 29%; A) and gene expression data (PC1 = 26%; B). In the DNA methylation and gene expression data, there were, respectively, one and two normal samples that clustered within the CRC group and vice versa three and four tumor samples that clustered within the normal group (A and B). The first can be explained by the aforementioned crosstalk between tumor and adjacent mucosa tissues. The latter is likely due to the larger heterogeneity of tumor samples and the resulting data variability or tumor quality, but the CRC outliers were inconspicuous in their clinical parameters compared to the other CRC samples. More than 84,000 differentially methylated positions (DMPs; FDR <0.001 and |Δβ = βTumor – βNormal| >0.1) between CRC and normal tissues were identified, with mostly CpG island hypermethylation and open sea CpG hypomethylation in CRC for both the promoter and the gene body regions (C). While this is in agreement with various cancers, the opposite was observed in healthy tissues, namely hypo- and hyper-methylation of CpG islands and open sea CpGs, respectively [Citation9,Citation25]. In the transcriptome data, we found 2456 differentially regulated genes (FDR <0.01 and |log2FC|>0.5; D), 1160 of them up- and 1296 down-regulated. We considered methylation to have a putative impact on the expression of a gene if at least two differentially methylated CpGs are nearby (8161, see E). Then, about one third of the differentially regulated genes (873 out of 2456) may be impacted by differentially methylated CpGs (E). Interestingly, these genes were particularly enriched in gene sets from ConsensusPathDB [Citation26], including in extracellular matrix (ECM) organization, pathways in cancer, and EGFR1 signaling (Supplementary Table 1 for a full list), but a more detailed view is needed to study the influence of methylation in carcinogenesis gene regulation.
Figure 1. Principal component analysis (PCA) from (A) normalized DNA methylation (M-values) and (B) log2 transformed gene expression data. Normal samples are shown in purple and tumor samples in green. Samples clustering within the other group (separated by the dashed line) were labeled with their sample ID. C: The number of significantly differentially methylated CpG sites (Δβ >0.1 and FDR <0.001) ordered according to location and their island relation (hyper- and hypo-methylation in CRC compared to normal tissues). D: The number of significantly differentially regulated genes (log2FC >0.5 and FDR <0.01) between CRC and normal tissues (up- and down-regulation in CRC). E: Overlap between differential methylation (≥2 CpGs significantly methylated per gene) and significant gene regulation.
Gene-wise correlation between DNA methylation and gene expression in colorectal cancer and normal samples
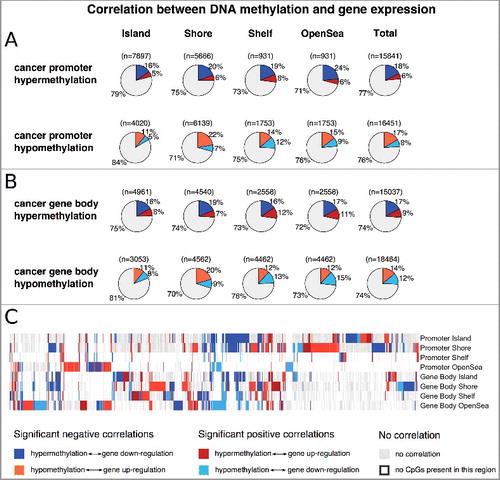
To study the gene-specific impact of DNA methylation, we calculated average methylation levels of CpGs in the promoter and gene body region, but discriminated between island, shore, shelf, and open sea CpGs. Thus, we obtained eight averaged methylation regions (4x promoter + 4x gene body) per gene. Then Spearman correlation coefficients were calculated between gene expression values and the averaged methylation levels. For hypermethylated (CRCMethylation > NormalMethylation) promoter regions in cancer, 24% displayed significant correlations (FDR corrected P value <0.05 and |ϱ| >0.2) to gene expression, with 18% of these being related to gene downregulation and 6% to gene upregulation (A, total, upper panel). In contrast, 25% of hypomethylated (CRCMethylation < NormalMethylation) promoter regions were correlated to gene expression values with 17% corresponding to gene up- and 8% to gene down-regulation (A, total, lower panel). In the gene body, we observed a similar picture. Here, 17% of hypermethylated regions were associated to gene downregulation, while 9% corresponded to gene upregulation (B, total, upper panel). For hypomethylated gene body regions, 14% related to gene upregulation and 12% to gene downregulation in cancer (B, total, lower panel). In total, we found 16,370 (25%) methylation regions that correlated significantly with gene expression values, with 10,662 (16%) significant negative correlations (hyperM ↔ downregulation and hypoM ↔ upregulation) and 5,708 (9%) significant positive correlations (hyperM ↔ upregulation and hypoM ↔ downregulation). A closer look at the methylation regions with significant correlations to gene expression values did not show any preferred location relative to the gene that is indicative for gene expression (C). It should be noted that the unequal distribution of CpGs across genes from the Illumina HumanMethylation450 BeadChip (450K) prevents a statement about other regions with a potential association to gene expression. In conclusion, we found, for both the promoter and gene body, around 25% of methylation regions that were associated with their gene expression values. However, whether the methylation changes have triggered gene expression in cancer or whether these are secondary events following other gene regulating mechanisms cannot be derived in this context.
Figure 2. Proportions of hyper- and hypo-methylated regions that display a significant relationship (FDR corrected P value <0.05 and |ϱ| >0.2) to gene expression for the promoter (A) and the gene body (B). C: Methylation pattern of all genes (8491) that contain at least one methylation region that is significantly correlated to its gene expression values.
Prediction of gene regulation from DNA methylation in colorectal cancer requires two distinct models
Using a machine learning approach with Random Forest, we sought to build a model that predicts gene regulation (up = log2FC >0 and down = log2FC <0) from DNA methylation differences in CRC and normal tissues. Therefore, we averaged the Δβ values (Δβ = βTumor– βNormal) at the promoter and gene body regions for the different island relations (island, shore, shelf, open sea), resulting in eight predictor regions for each gene. If no CpGs were present in a specific gene location, zeros were inserted for the Δβ values.
Furthermore, we hypothesized that gene regulation cannot be robustly predicted for all genes, for which reason we defined subsets of genes based on varying thresholds of absolute log2FC (tumor vs. normal; |log2FC| >0.1, …, 0.5) and absolute Spearman correlation coefficients [|ϱ| >0, …, 0.5 between methylation and gene expression for at least one gene region (promoter and gene body island, shore, shelf, open sea)]. Random Forest classification models were trained on the defined subsets of genes and prediction performance was evaluated in three-times repeated 10-fold cross-validation by comparing the predicted outcome (up- or down-regulation) with the observed (true) expression changes (A).
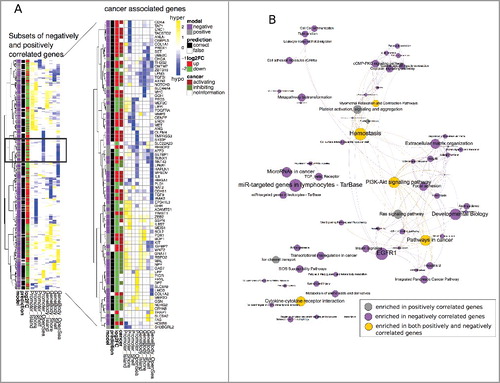
Figure 3. A: Workflow of training Random Forest classification models on different subsets of genes. Prediction performances (AUCs) obtained from three times repeated 10-fold cross-validation for different subsets of genes according to log2FC and Spearman correlation coefficients thresholds. Below, the importance of predictors across all prediction models are shown (scaled between [0, 1]). B: Subsets of negatively and positively correlated genes C: subsets of negatively correlated genes and D: Subsets of positively correlated genes.
![Figure 3. A: Workflow of training Random Forest classification models on different subsets of genes. Prediction performances (AUCs) obtained from three times repeated 10-fold cross-validation for different subsets of genes according to log2FC and Spearman correlation coefficients thresholds. Below, the importance of predictors across all prediction models are shown (scaled between [0, 1]). B: Subsets of negatively and positively correlated genes C: subsets of negatively correlated genes and D: Subsets of positively correlated genes.](/cms/asset/5e9f50db-b187-4805-9563-11a18afd3195/kepi_a_1460034_f0003_oc.jpg)
The prediction performance increased from AUC = 0.64 for the gene subset with (|log2FC| >0.1 and |ϱ| >0) to AUC = 0.81 for the gene subset with (|log2FC| >0.5 and |ϱ| >0.5) with the most important predictors being the promoter shores followed by the promoter islands, whereas the promoter shelves were the least important. Nevertheless, for the subset with thresholds |log2FC| >0.5 and |ϱ| >0.5 (B; black box), recursive feature elimination resulted in the best prediction performance for all eight methylation regions (Supplementary A). Thus, even methylation on promoter shelves contributes marginally to a better prediction of gene regulation. Hence, features were not reduced, because of the already small feature space (n = 8). Furthermore, thorough scanning of the prediction results revealed that genes with positive correlation coefficients in promoter and gene body islands and shores were mainly falsely predicted (Supplementary B, green box). Therefore, we set out to train two separate prediction models: one for genes being negatively and one for genes being positively correlated between DNA methylation and gene expression.
Comparing our initial prediction model (B) to the approach of separate models (C and D), we found an average increase in the AUC over the different thresholds (Spearman's ϱ and log2FC) from 0.72 to 0.86 (0.90) for the negatively (positively) correlated genes and maximum performances of AUC = 0.96 (AUC = 0.93). The most important predictors were promoter and gene body shores for the subsets of negatively correlated genes and gene body open sea for the subsets of positively correlated genes (C and D). A closer look at the subset of genes passing the most stringent thresholds for negative correlation (|log2FC| >0.5 and ϱ <-0.5; n = 327; AUC = 0.96; C black box) and the subset of genes for positive correlation (|logFC| >0.5 and ϱ >0.5; n = 129; AUC = 0.93; D black box) shows that genes with similar methylation patterns are sometimes differently regulated (A, left panel, see as example black box). This corroborates again the gene-specific dependencies and the need for two separate classification models to predict gene regulation from CpG methylation differences.
Figure 4. A: Left panel: Heatmap of methylation profiles (Δβ values) for all genes from the subsets of negatively (327) and positively (129) correlated genes (see C and D; black boxes) with regard to their regulation, prediction outcome and prediction model association. The black box represents an example of gene-specific regulation (up and down) from similar methylation patterns. Right panel: detailed view of 84 cancer associated genes (cancer genes from Bushman's Lab, Suppl. Table 2) and their associated function in cancer. B: Significantly enriched consensus pathways (P value <0.05) in negatively correlated (purple nodes), positively correlated (grey nodes), and both (yellow nodes) genes. Edges are drawn if pathways share 30% of their genes. Node and font size are proportional to the size of the gene sets.
Biological function of methylation regulated genes in CRC
In the following experiments, we focused on the subset of negatively correlated genes (327) and the subset of positively correlated genes (129) whose gene regulation could be robustly predicted in the ColoCare cohort (C and D, black boxes). A Fisher's exact test using Consensus pathways [Citation26] resulted in an enrichment of typical cancer associated pathways (P value <0.05), such as pathways in cancer, PI3K-Akt signaling or cytokine-cytokine receptor interaction for both the negatively and positively correlated genes (B, shown as yellow nodes). There were also unique pathways for the negatively or positively correlated genes, e.g., EGFR1 and extracellular matrix organization for the former and Ras signaling pathway for the latter correlation (B). Still the pathway overlap was significant (hypergeometric test P value <10−5), indicating no specific function to the different subsets of genes.
To get further insight into the role of methylation on cancer genes, we obtained cancer associated genes that were curated from multiple cancer lists (http://www.bushmanlab.org/links/genelists) and matched them to our subsets of negatively and positively correlated genes. A total of 84 cancer associated genes were found in the subset of negatively (62) or positively correlated genes (22), of which we further manually annotated 52 and 12 genes to either a cancer supporting or suppressing function according to literature review (Supplementary Table 2).
As expected, cancer supporting genes (oncogenes) were significantly associated to upregulated genes, while cancer suppressing genes (tumor suppressors) were associated to downregulated genes (χ2 P value <10−6), suggesting a support of tumor functionality through specific hyper- and hypo-methylation in CRC. The fact that the regulation from 78 of 84 cancer genes were correctly predicted by the Random Forest classification models proposes a robust dependence between CpG methylation and gene expression and emphasizes the important role of methylation changes in cancer associated genes in the colon.
Model validation in independent CRC cohorts
To validate our classification models, we obtained independent publicly available cohorts of CRC and normal samples with CpG methylation as input and gene expression data for performance evaluation (Supplementary Table 1). We validated the models trained on the negatively and positively correlated genes (C and D; black boxes) from the ColoCare data. First, independent DNA methylation data (GSE42752) was taken as input for the classification models to predict gene regulation. The ColoCare and one further, independent CRC gene expression cohort (GSE8671) were used as underlying truth to evaluate the prediction performance. The classification resulted in prediction performances of AUC = 0.94 and AUC = 0.98 for the subsets of negatively and positively correlated genes compared to the ColoCare gene regulation. Comparing to the GSE8671 cohort data we obtained AUCs of 0.93 and 0.92, respectively (A). In a next step, matching DNA methylation (as input) and gene expression data (as underlying truth) of 272 CRC and 19 normal samples were downloaded from TCGA (The Cancer Genome Atlas). Again, high prediction performances were obtained for the negatively (AUC = 0.96) and positively correlated genes (AUC = 0.97; A).
Figure 5. A: ROC curves of validation analysis of the prediction models for negative correlated (solid line) and positive correlated (dashed line) genes in independent CRC methylation (meth) and gene expression (exp) data. B: Average of gene regulation prediction performances (AUC) and their standard deviation for 16 individual CRC patients from TCGA repository.
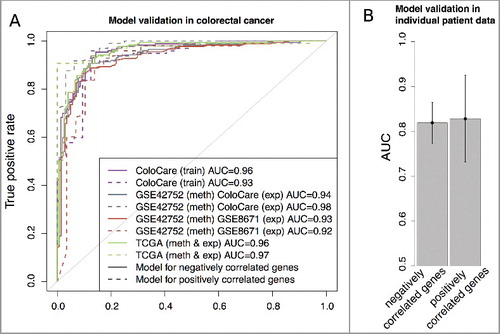
Furthermore, the classification models were tested on individual patient data, i.e., gene regulation was predicted from patient-specific DNA methylation differences between CRC and normal tissues. In total, 16 CRC patients within TCGA had both input DNA methylation (tumor and normal) data as well as gene expression data (tumor and normal) to check the prediction results. The gene regulation prediction of these 16 patients resulted in an average prediction performance of AUC = 0.82 ± 0.05 and AUC = 0.83 ± 0.10 for the negatively and positively correlated genes, respectively (B). This shows that for a subset of genes, we can consistently predict gene regulation in CRC cohort as well as in individual patient data, highlighting the wide applicability of our prediction models and the robust dependence between CpG methylation and gene expression in CRC data.
Model validation in other cancerous tissues
For a general understanding of the interdependence between CpG methylation and gene expression in carcinogenesis, we acquired matching cohort data for methylome and transcriptome from TCGA for breast invasive carcinoma (BRCA), lung adenocarcinoma (LUAD), and thyroid carcinoma (THCA) cancer (Supplementary Table 1). Among the hyper- and hypo-methylated regions in promoter and gene body for BRCA, LUAD, and THCA, we found 30% (22% negatively and 8% positively), 26% (18% negatively and 8% positively), and 17% (13% negatively and 4% positively) correlated (FDR adjusted P value <0.05 and |ϱ| >0.2) between DNA methylation and gene expression values (Supplementary –).
For model training, we obtained new subsets of negatively (positively) correlated genes with thresholds |log2FC| >0.5 and ϱ <-0.5 (>0.5) as described previously. Using the classification models trained on the ColoCare CRC data, prediction performances were achieved as AUC = (0.87, 0.77, and 0.90) for the negatively and AUC = (0.76, 0.74, and 0.69) for the positively correlated genes for (BRCA, LUAD, and THCA), respectively (A). In comparison to the prediction performances for colon cancer, performances of BRCA, LUAD, and THCA were consistently lower and significant for the positively, but not for the negatively correlated genes (t-test P = 0.0011 and P = 0.13, respectively). To rule out overfitting towards colon cancer, we trained new prediction models separately for BRCA, LUAD, and THCA. Interestingly, prediction performances were insignificantly different for both the negatively [AUC = (0.88, 0.79, and 0.90)] and the positively [AUC = (0.88, 0.75, and 0.73)] correlated genes, respectively, abrogating any overfitting towards colon cancer. Thus, gene regulation prediction with the presented prediction models is particularly useful for CRC.
Figure 6. A: ROC curves of validation analysis of the prediction models for negative correlated (solid line) and positive correlated (dashed line) genes in BRCA, LUAD, and THCA data. B: Overlap between the subsets of genes of negatively and positively correlated genes used in the prediction models of CRC, BRCA, LUAD and THCA (see ROC curves A). C: Illumina 450K methylation profile on the HMGA1 gene. Hypermethylated CpGs in cancer tissues are shown in yellow and hypomethylated CpGs in blue. The size of the methylation sites corresponds to the significance of the Spearman correlation coefficient between HMGA1 gene expression and methylation levels at the respective loci. D: Mutational frequencies of HMGA1, MT1E, AGR2, FAS, and NFE2L3 across more than 9000 cancer patients from TCGA.
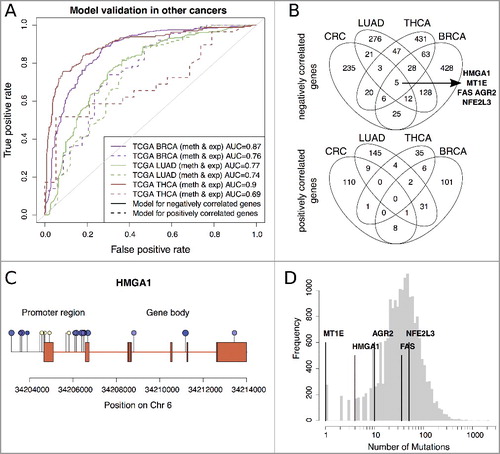
Interestingly, only five genes from the specified subsets showed a consistent negative correlation between expression and methylation across the four cancers (B): High mobility group AT-Hook 1 (HMGA1), Metallothionein 1E (MT1E), Fas cell surface death receptor (FAS), Anterior gradient 2 (AGR2), and Nuclear Factor Erythroid 2 like 3 (NFE2L3), while no genes were found to overlap within the positively correlated genes (B).
Epigenetic alteration of HMGA1 in cancerous tissues
HMGA1 is an oncogene involved in many cancerous mechanisms [Citation27]. We observed a highly robust dependence between gene regulation and DNA methylation differences in the different cancer types. Its expression was correctly predicted in 16/16 TCGA CRC patients (15 upregulated and 1 downregulated) and in all our investigated cancer cohorts (CRC, BRCA, LUAD, THCA, all upregulated). In-depth analysis on HMGA1 associated CpGs, showed hypomethylation as an indicator of increased gene expression for 9/21 CpGs in all tested cancer types (Supplementary Table 2), suggesting hypermethylation as potential treatment to regulate HMGA1 overexpression in cancer. Overall correlation from all tested samples, associates the promoter region (C) with gene expression. We further investigated the survival prognosis of gene expression levels but could not identify a significant association (log-rank test P >0.05) in CRC, BRCA, THCA, and LUAD from TCGA.
To exclude mutation driven changes in HMGA1 expression, we compared the mutation frequency of HMGA1 to 19,147 other genes in >9000 cancerous samples from TCGA. HMGA1 was among the top 5% of genes with the lowest mutation frequency (D). This further strengthens the hypothesis that epigenetic alteration through CpG methylation of HMGA1 may regulate its gene expression in various cancers.
Discussion
In this study we investigated the interplay between CpG methylation and gene expression in CRC and normal adjacent mucosa tissues from participants in the ColoCare cohort [Citation19]. Our findings support previously identified differentially methylated positions, with mainly island hypermethylation and open sea hypomethylation in CRC tissues and differentially regulated genes [Citation3,Citation5]. As previously stated, many differentially methylated CpG sites displayed no effect on gene regulation, suggesting no contribution to cancer through modification of the transcriptome [Citation5,Citation11]. Yet, we identified roughly 25% of methylation regions in the promoter and gene body with significant correlations (FDR corrected P value <0.05 and |ϱ| >0.2) to gene expression levels, suggesting an interplay between DNA methylation and gene expression in cancer. For example, Naumov et al. [Citation3] identified 14 hypermethylated CpG sites on 8 genes (SND1, ADHFE1, NR5A2, COL4A, OPLAH, TLX2, C1orf70, ZFP64) with high diagnostic potential for CRC. While all of these CpGs showed significant hypermethylation in our data set, thus confirming their diagnostic role, only 4 out of 8 genes seem to be regulated through CpG methylation: ADHFE1 (down), NR5A2 (down), COL4A1/2 (up), and SND1 (up).
Among the methylated regions with a significant relationship to gene expression, the majority (16%) of hyper(hypo)methylated regions in both the promoter and gene body were related to gene down(up)regulation, corroborating the predominant view of CpG island promoter hyper(hypo)methylation being a silencing (activating) epigenetic change. Nevertheless, there was a substantial amount (9%) that displayed a link between hyper(hypo)methylated regions and gene up(down)regulation in cancer. In particular, hyper(hypo)methylation of the gene body open sea and shelf regions were linked to up(down)regulation in cancer, which is in agreement with the association between global hypomethylation and gene repression in breast cancer [Citation28] and with the primarily positive correlation between DNA methylation and gene expression across human tissues and cell lines for non-CpG islands residing in the gene body [Citation9]. Nevertheless, whether the methylation changes are a cause or consequence of transcriptional regulations in cancer cannot be answered with the underlying data. The many-sided correlation patterns indicated a gene-specific role of associations between methylation and gene expression changes. To test the possibility to infer gene regulation from DNA methylation, we constructed a Random Forest classification model. The gene-specific behavior towards CpG methylation complicated prediction analysis for a single model, which was solved by a novel approach that trained two prediction models separately—one for the genes with negative correlation between methylation and gene expression and one for the positively correlated genes. The prediction models were particularly accurate for a subset of negatively correlated genes (|logFC| >0.5 and ϱ <-0.5; AUC = 0.96) and positively correlated genes (|logFC| >0.5 and ϱ >0.5; AUC = 0.93), indicating a strong link between DNA methylation and gene expression for these genes. In addition, both subsets of genes were associated to common cancer pathways, with cancer suppressing and supporting genes being primarily silenced and activated, respectively.
The classification models achieved high prediction performances in independent CRC cohorts and single patient data as well, demonstrating their general usage to infer gene regulation from methylation data, whenever gene expression data is missing.
However, gene regulation prediction analysis did not work equally well in other cancer types such as BRCA, LUAD, and THCA (0.69≤AUC≤0.90). For the hyper- and hypo-methylated regions that were associated with gene expression, we found varying proportions for BRCA (30%), LUAD (26%), and THCA (17%), suggesting a cancer specific linkage of methylation and gene expression. Interestingly, prediction models trained on the respective cancers did not produce better performances than the models trained on CRC. This suggests that the dependencies between methylation changes and gene expression are less robust in BRCA, LUAD, and THCA than in CRC, but it also indicates that methylation changes of negatively and positively regulated genes have similar responses across cancer types. Furthermore, the subsets of genes according to log2FC and correlation coefficient thresholds varied across cancers, indicating tissue-specific dependencies as proposed elsewhere [Citation13]. Matching our prediction results, methylation occurs at higher frequencies in CRC compared to other cancer types [Citation29,Citation30], which might suggest a stronger role of DNA methylation in CRC and could explain the prediction discrepancies.
The prediction of gene regulation from DNA methylation comes with three limitations. First, high prediction performances can only be obtained for a subset of genes that is based on differential expression (log2FC) and correlation structures with DNA methylation (Spearman's ϱ). However, it is easy to infer such underlying dependencies from publicly available data repositories that include DNA methylation and matching gene expression data, e.g., from TCGA. Second, we related CpGs to only the promoter and gene body region based on Illumina annotation of the 450K methylation BeadChip. Therefore, genes that were not regulated by those may have regulatory regions at distant enhancer sites or isolated intergenic CpGs, which were not included in the model. Third, we cannot predict the strength of the regulation, i.e., the effect size of expression differences (log2FC). It highly depends on the dynamic range of the genes, which would have to be incorporated in the prediction model and requires further work.
Recently, Li et al. [Citation18] published a prediction model to infer gene regulation of differentially expressed genes (DEGs; n = 2874) from methylation levels in lung cancer data from TCGA. In addition to CpG methylation, they considered histone methylation, nucleotide composition and conservation, comprising to a total of 1412 features. Eighty percent of the DEGs were used for feature selection analysis and machine learning, resulting in 67 features with a prediction performance of AUC = 0.83 in the remaining 20%. For a different subset of genes and therefore not exactly comparable to their results, our models trained on the CRC (LUAD) cohort data, obtained prediction performances of AUC = 0.77 (0.79) and AUC = 0.74 (0.75) for the negatively (520) and positively (192) correlated genes, respectively. The discrepancies might be due to (i) the incorporation of histone methylation and nucleotide composition data; (ii) the subsets of genes the models were trained and tested on; (iii) the evaluation of prediction performance (single split vs. 3x repeated CV); but also (iv) the choice of the models. To what extent the Li et al.'s approach is specific to lung cancer has not been examined yet. Thus, we recommend to use our model particularly for CRC data and due to its simplicity in feature space (8 features per gene), as well as when only 450K methylation data is accessible.
Among the genes regulated by DNA methylation in all investigated cancers, we found a strong indication for HMGA1 upregulation whenever CpG islands and shores were hypomethylated at the TSS1500 and 5’UTR promoter region. Also, one site within the gene body was consistently hypomethylated, pointing to a combined regulatory role of different methylation sites. To our knowledge, we are the first to report such a consistent dependence between HMGA1 methylation and expression in multiple tumors. HMGA1 is one of the cancer hallmark genes [Citation27], playing an important role in regulation of gene transcription, e.g., p53, inhibition of apoptosis, and progression of metastasis [Citation31–33]. While high expression levels of HMGA proteins correlate with advanced tumor grade and poor survival in PDAC patients [Citation27,Citation31,Citation34], we could not confirm a survival association in CRC, BRCA, LUAD, or THCA TCGA data. Nevertheless, HMGA1 has been suggested as a biomarker in PDAC and as a promising target for cancer therapy [Citation27,Citation31,Citation34,Citation35]. Global DNA methylation modifications have already been used in cancer therapy, by the use of epigenetic inhibitors [Citation36]. Recently, also target specific DNA methylation alterations have become available using a CRISPR-Cas9-based tool [Citation22]. This enables the possibility to increase CpG methylation on the HMGA1 promoter region and therefore reduce its gene expression in cancer. However, the clinical implementation will require further research.
In conclusion, we present two prediction models with Random Forest classification to robustly infer gene regulation on a subset of genes from CpG methylation differences in CRC and normal adjacent mucosa tissues but also other cancer entities. This suggests the existence of cancer contributing genes that are strongly associated with and presumably regulated through DNA methylation changes in CRC. Finally, we identify HMGA1 as robustly hypomethylated and upregulated in all cancer types. As a result of the role of HMGA1 in cancer development, we suggest regulation of gene expression through DNA methylation targeting cancer therapy. However, further work is required to experimentally validate the regulatory impact of methylation on HMGA1 expression.
Materials and methods
Illumina 450K preprocessing
Illumina 450K microarrays were preprocessed using the R minfi package [Citation37]. First, probes with detection P value >0.01 or beadcounts ≤3 in 10% of the samples were removed followed by quantile normalization of methylation intensity values. Second, β values were determined from methylation intensities and normalized with BMIQ [Citation38]. CpGs on the X- and Y-chromosome as well as with SNP association (dbSNP minor allele frequency >0.01) were excluded from further analysis. The remaining CpGs (424,555) were used for subsequent analysis. Differentially methylated positions were calculated using moderated t-tests between CRC and normal tissues as proposed elsewhere [Citation37]. Significance was defined as a FDR corrected P value <0.001 and |Δβ| >0.1. For prediction analyses, we assigned CpG sites to genes and calculated average β values for the promoter region (1500TSS-1st Exon) and the gene body for different island relations (island, shore, shelf, open sea) according to the Illumina manifest, which is based on the UCSC annotation [Citation39]. Therefore, islands are defined by a CG content of >50% and an observed/expected ratio of more than 0.6 in windows 200<x<500 bases. The regions 0–2 kb and 2–4 kb up- and down-stream of islands are defined shores and shelves, respectively. CpG sites falling in neither of these categories were defined as open sea [Citation40]. We discriminated between the four island relations and the promoter or gene body, resulting in eight methylation values per gene. Then, gene-wise methylation differences (Δβ = βTumor – βNormal) were obtained per value. If CpG levels were missing on a gene region, differences of Δβ = 0 were inserted. Methylation data sets (450K) from the cancer genome atlas (TCGA) were downloaded with normalized β values and clinical information.
Gene expression preprocessing
Illumina HumanHT12v4 microarrays were quantile normalized, log2 transformed and manufacture IDs were matched to unique gene EntrezIDs. If multiple manufacture IDs were associated to the same EntrezID, the one with the higher inter-quartile-range across the data was kept. Differentially expressed genes were obtained applying the limma pipeline [Citation41] and using a Benjamini-Hochberg adjusted P value cutoff <0.01 and an absolute log2-fold change cutoff (logFC) >1. For prediction analysis, we defined upregulation as logFC >0 and downregulation as logFC <0.
Correlation analysis
CpG methylation levels were averaged according to their respective gene location (promoter and gene body) and island relation (island, shore, shelf, open sea). Then, Spearman correlation coefficients ϱ were calculated between averaged methylation sites and gene expression values for samples with matching methylation and transcriptome data. P values of correlation coefficients were adjusted for multiple testing (Benjamini-Hochberg).
Gene regulation prediction
Random Forest classification models were used to classify gene regulation (up or down) from 8 methylation differences (Δβ = βTumor – βNormal) for different subsets of genes according to log2FC and correlation coefficient thresholds. The best model was chosen in three-times repeated 10-fold cross-validation, and performance was evaluated by the area under the curve (AUC) of the receiver operated characteristic (ROC) using the R caret package [Citation42]. For validation analysis, models trained on the ColoCare data were used to predict gene regulation from methylation data of independent CRC and other cancer cohorts (breast, lung and thyroid).
All data are fully available from Gene Expression Omnibus with the accession numbers GSE101764 (DNA methylation) and GSE106582 (gene expression). All analyses were coded in R and are available upon request.
Ethics: ColoCare Study
The ColoCare Consortium combines research on colorectal cancer, with sites at the Fred Hutchison Cancer Research Center (Seattle, USA), the Moffit Cancer Center (Tampa, USA), and, from 2010, the German Cancer Research Center (DKFZ, Heidelberg, Germany). This study exclusively focused on patients recruited in Heidelberg and has been approved by the ethics committee of the University of Heidelberg medical faculty.
Author contributions statement
CU conceived the cohort study. HK, HB, MB conceived the analysis and wrote the manuscript. YB, RT, JB, BG, NH, DS, PSK, AU, PS, EH, HBr, CU, and KBM organized, produced and provided the ColoCare methylation and expression data. All authors critically reviewed and revised the manuscript.
Disclosure of potential conflicts of interest
The authors report no conflict of interest.
SupplementaryTable4_HMGA1correlations.xls
Download MS Excel (27.5 KB)SupplementaryTable2_ConsensusPathways_VennDiagram.xls
Download MS Excel (34.5 KB)Supplementary_information_rev032018_final.docx
Download MS Word (889.6 KB)Acknowledgments
The authors would like to thank all ColoCare Study participants and the entire ColoCare Study team in Heidelberg, especially Dr. Werner Diehl for data acquisition and documentation, and Judith Kammer, Susanne Jakob and Torsten Koelsch for patient recruitment and tissue collection. Tissue samples were archived and processed by the tissue bank of the National Center for Tumor Diseases (NCT, Heidelberg, Germany).
We are grateful to Dr. Melanie Bewerunge-Hudler and the Genomics and Proteomics Core Facility at the German Cancer Research Center (Heidelberg, Germany) for running the Illumina Infinium HumanMethylation450 BeadChip microarrays, the Illumina Human HT-12 Whole-Genome Expression Bead Chips and related services. The ColoCare Study and Consortium has been designed and first implemented at the Fred Hutchinson Cancer Research Center, Seattle, USA (PIs: Ulrich/Grady) and protocols have been used with permission in Heidelberg, Germany (PI: Ulrich). The ColoCare Study site in Heidelberg has been funded by the Matthias Lackas Foundation, the German Cancer Consortium (DKTK) and the Division of Preventive Oncology at the German Cancer Research Center (DKFZ). Hagen Klett and Melanie Boerries were additionally funded by the German Ministry of Education and Research (BMBF) within the e:Med consortium “DeCaRe-Delineating Cardiac Regeneration”. Hauke Busch acknowledges support through the Excellence cluster EXC 306 “Inflammation at Interfaces” of the German Science Foundation (DFG) and Melanie Boerries the collaborative research center (CRC) 850, project Z1 and C9. Finally, we would like to thank Andreas Hecht for critically reviewing the manuscript and providing feedback.
Related Research Data
References
- Lister R, Pelizzola M, Dowen RH, et al. Human DNA methylomes at base resolution show widespread epigenomic differences. Nature. 2009;462(7271):315–322. doi:10.1038/nature08514. PMID:19829295
- Kim MS, Lee J, Sidransky D. DNA methylation markers in colorectal cancer. Cancer Metastasis Rev. 2010;29(1):181–206. doi:10.1007/s10555-010-9207-6. PMID:20135198
- Naumov VA, Generozov EV, Zaharjevskaya NB, et al. Genome-scale analysis of DNA methylation in colorectal cancer using Infinium HumanMethylation450 BeadChips. Epigenetics. 2013;8(9):921–934. doi:10.4161/epi.25577. PMID:23867710
- Toyota M, Ahuja N, Ohe-Toyota M, et al. .CpG island methylator phenotype in colorectal cancer. Med Sci. 1999;96:8681–8686.
- Hinoue T, Weisenberger DJ, Lange CPE, et al. Genome-scale analysis of aberrant DNA methylation in colorectal cancer. Cancer Res. 2011 Apr 15;71:LB–173. doi:10.1158/1538-7445.AM2011-LB-173.
- Lam K, Pan K, Linnekamp JF, et al. DNA methylation based biomarkers in colorectal cancer: a systematic review. Biochim Biophys Acta – Rev Cancer. 2016;1866(1):106–120. doi:10.1016/j.bbcan.2016.07.001.
- Jones PA, Baylin SB. The fundamental role of epigenetic events in cancer. Nat Rev Genet. 2002;3(6):415–428. doi:10.1038/nrg816. PMID:12042769
- Ball MP, Li JB, Gao Y, et al. Targeted and genome-scale methylomics reveals gene body signatures in human cell lines. Nat Biotechnol. 2009;27(4):361–368. doi:10.1038/nbt.1533. PMID:19329998
- Varley KE, Gertz J, Bowling KM, et al. Dynamic DNA methylation across diverse human cell lines and tissues. Genome Res. 2013 Mar 1;23(3):555–567. doi:10.1101/gr.147942.112.
- Merlo a, Herman JG, Mao L, et al. 5’ CpG island methylation is associated with transcriptional silencing of the tumour suppressor p16/CDKN2/MTS1 in human cancers. Nat Med. 1995;1(7):686–692. doi:10.1038/nm0795-686. PMID:7585152
- Sproul D, Kitchen RR, Nestor CE, et al. Tissue of origin determines cancer-associated CpG island promoter hypermethylation patterns. Genome Biol. 2012;13(10):R84. doi:10.1186/gb-2012-13-10-r84. PMID:23034185
- Sproul D, Meehan RR. Genomic insights into cancer-associated aberrant CpG island hypermethylation. Brief Funct Genomics. 2013;12(3):174–90. doi:10.1093/bfgp/els063. PMID:23341493
- Moarii M, Boeva V, Vert J, et al. Changes in correlation between promoter methylation and gene expression in cancer. BMC Genomics. 2015 Dec 28;16(1):873. doi:10.1186/s12864-015-1994-2.
- Ma X, Liu Z, Zhang Z, et al. Multiple network algorithm for epigenetic modules via the integration of genome-wide DNA methylation and gene expression data. BMC Bioinformatics. 2017;18(1):72. doi:10.1186/s12859-017-1490-6. PMID:28137264
- Ma X, Wang Y-W, Zhang MQ, et al. DNA methylation data analysis and its application to cancer research. Epigenomics. 2013;5(3):301–316. doi:10.2217/epi.13.26. PMID:23750645
- Jiao Y, Widschwendter M, Teschendorff AE. A systems-level integrative framework for genome-wide DNA methylation and gene expression data identifies differential gene expression modules under epigenetic control. Bioinformatics. 2014;30(16):2360–2366. doi:10.1093/bioinformatics/btu316. PMID:24794928
- West J, Beck S, Wang X, et al. An integrative network algorithm identifies age-associated differential methylation interactome hotspots targeting stem-cell differentiation pathways. Sci Rep. 2013;3:1630. doi:10.1038/srep01630. PMID:23568264
- Li J, Ching T, Huang S, et al. Using epigenomics data to predict gene expression in lung cancer. BMC Bioinformatics. 2015;16:S10. doi:10.1186/1471-2105-16-S5-S10.
- Barrow TM, Klett H, Toth R, et al. Smoking is associated with hypermethylation of the APC 1A promoter in colorectal cancer: the ColoCare Study. J Pathol. 2017;243(3):366–375. doi:10.1002/path.4955. PMID:28791728
- Issa J-PJ. DNA Methylation as a Therapeutic target in cancer. Clin Cancer Res. 2007 Mar 15;13(6):1634–1637. doi:10.1158/1078-0432.CCR-06-2076.
- Yang X, Han H, DeCarvalho DD, et al. Gene body methylation can alter gene expression and is a therapeutic target in cancer. Cancer Cell. 2014;26(4):577–590. doi:10.1016/j.ccr.2014.07.028. PMID:25263941
- Vojta A, Dobrinic P, Tadic V, et al. Repurposing the CRISPR-Cas9 system for targeted DNA methylation. Nucleic Acids Res. 2016;44(12):5615–5628. doi:10.1093/nar/gkw159. PMID:26969735
- Sanz-Pamplona R, Berenguer A, Cordero D, et al. Aberrant gene expression in mucosa adjacent to tumor reveals a molecular crosstalk in colon cancer. Mol Cancer. 2014;13(1):1–19. doi:10.1186/1476-4598-13-46. PMID:24387052
- Sandoval J, Heyn HA, Moran S, et al. Validation of a DNA methylation microarray for 450,000 CpG sites in the human genome. Epigenetics. 2011;6(6):692–702. doi:10.4161/epi.6.6.16196. PMID:21593595
- Qu Y, Lennartsson A, Gaidzik VI, et al. Differential methylation in CN-AML preferentially targets non-CGI regions and is dictated by DNMT3A mutational status and associated with predominant hypomethylation of HOX genes. Epigenetics. 2014 Aug 6;9(8):1108–1119. doi:10.4161/epi.29315.
- Kamburov A, Wierling C, Lehrach H, et al. ConsensusPathDB – A database for integrating human functional interaction networks. Nucleic Acids Res. 2009;37:623–628. doi:10.1093/nar/gkn698.
- Fusco A, Fedele M. Roles of HMGA proteins in cancer. Nat Rev Cancer. 2007;7(12):899–910. doi:10.1038/nrc2271. PMID:18004397
- Hon GC, Hawkins RD, Caballero OL, et al. Global DNA hypomethylation coupled to repressive chromatin domain formation and gene silencing in breast cancer. Genome Research. 2012;22(2):246–58.
- Costello JF, Frühwald MC, Smiraglia DJ, et al. Aberrant CpG-island methylation has non-random and tumour-type–specific patterns. Nat Genet. 2000;24(2):132–138. doi:10.1038/72785. PMID:10655057
- Ehrlich M. DNA methylation in cancer: too much, but also too little. Oncogene. 2002;21(35):5400–5413. doi:10.1038/sj.onc.1205651. PMID:12154403
- Shah SN, Cope L, Poh W, et al. HMGA1: a master regulator of tumor progression in triple-negative breast cancer cells. PLoS One. 2013;8(5):e63419. doi:10.1371/journal.pone.0063419.
- Resar LMS. The high mobility group A1 Gene: transforming inflammatory signals into cancer? Cancer Res. 2010;70(2):436–439. doi:10.1158/0008-5472.CAN-09-1212. PMID:20068164
- Puca F, Colamaio M, Federico A, et al. HMGA1 silencing restores normal stem cell characteristics in colon cancer stem cells by increasing p53 levels. Oncotarget. 2014;5(10):3234–3245. doi:10.18632/oncotarget.1914. PMID:24833610
- Yanagisawa BL, Resar LMS. Hitting the bull's eye: targeting HMGA1 in cancer stem cells. Expert Rev Anticancer Ther. 2011;4(164):23–30.
- Liau SS, Whang E. High mobility group A: a novel biomarker and therapeutic target in pancreatic adenocarcinoma. Surgeon. 2009;7(5):297–306. doi:10.1016/S1479-666X(09)80008-5. PMID:19848064
- Heerboth S, Lapinska K, Snyder N, et al. Use of epigenetic drugs in disease: an overview. Genet Epigenetics. 2014;1(6):9–19.
- Aryee MJ, Jaffe AE, Corrada-Bravo H, et al. Minfi: A flexible and comprehensive Bioconductor package for the analysis of Infinium DNA methylation microarrays. Bioinformatics. 2014;30(10):1363–1369. doi:10.1093/bioinformatics/btu049. PMID:24478339
- Teschendorff AE, Marabita F, Lechner M, et al. A beta-mixture quantile normalization method for correcting probe design bias in Illumina Infinium 450 k DNA methylation data. Bioinformatics. 2013;29(2):189–196. doi:10.1093/bioinformatics/bts680. PMID:23175756
- Hansen KD. IlluminaHumanMethylation450kanno.ilmn12.hg19: Annotation for Illumina's 450k methylation arrays. R package version 0.6.0. 2016.
- Bibikova M, Barnes B, Tsan C, et al. High density DNA methylation array with single CpG site resolution. Genomics. 2011;98(4):288–295. doi:10.1016/j.ygeno.2011.07.007. PMID:21839163
- Ritchie ME, Phipson B, Wu D, et al. Limma powers differential expression analyses for RNA-sequencing and microarray studies. Nucleic Acids Res. 2015;43(7):e47. doi:10.1093/nar/gkv007. PMID:25605792
- Kuhn M. Building predictive models in R Using the caret package. J Stat Softw. 2008;28(5):1–26. doi:10.18637/jss.v028.i05. PMID:27774042