
ABSTRACT
The bromodomain and extra-terminal domain (BET) proteins are promising drug targets for cancer and immune diseases. However, BET inhibition effects have been studied more in the context of bromodomain-containing protein 4 (BRD4) than BRD2, and the BET protein association to histone H4-hyperacetylated chromatin is not understood at the genome-wide level. Here, we report transcription start site (TSS)-resolution integrative analyses of ChIP-seq and transcriptome profiles in human non-small cell lung cancer (NSCLC) cell line H23. We show that di-acetylation at K5 and K8 of histone H4 (H4K5acK8ac) co-localizes with H3K27ac and BRD2 in the majority of active enhancers and promoters, where BRD2 has a stronger association with H4K5acK8ac than H3K27ac. Although BET inhibition by JQ1 led to complete reduction of BRD2 binding to chromatin, only local changes of H4K5acK8ac levels were observed, suggesting that recruitment of BRD2 does not influence global histone H4 hyperacetylation levels. This finding supports a model in which recruitment of BET proteins via histone H4 hyperacetylation is predominant over hyperacetylation of histone H4 by BET protein-associated acetyltransferases. In addition, we found that a remarkable number of BRD2-bound genes, including MYC and its downstream target genes, were transcriptionally upregulated upon JQ1 treatment. Using BRD2-enriched sites and transcriptional activity analysis, we identified candidate transcription factors potentially involved in the JQ1 response in BRD2-dependent and -independent manner.
KEYWORDS:
Introduction
Lysine acetylation of core histones is one of the major posttranslational modifications involved in the control of eukaryotic gene expression [Citation1]. Acetylated status of lysine residue is mainly recognized by bromodomains that are found in many chromatin-associated proteins [Citation2,Citation3]. The mammalian bromodomain and extra-terminal domain (BET) family, comprising BRD2, BRD3, BRD4, and BRDT, is involved in transcriptional regulation of cancer-related genes and has been recognized as a therapeutic target in many cancer types, such as NUT midline carcinoma (NMC) [Citation4] and acute myeloid leukemia (AML) [Citation5]. JQ1, an inhibitor of BET proteins that binds the acetyllysine (Kac)-binding pocket of bromodomain [Citation4], has been shown to selectively suppress the expression of tumor-promoting genes in cancer cells and emerges as a promising anti-cancer therapeutic drug [Citation3,Citation4,Citation6–Citation10]. Since studies on BET inhibition mechanisms have mostly focused on the correlation between BRD4 genomic occupancy and JQ1-induced transcriptional changes [Citation6,Citation11], little is known on how BRD2 and hyperacetylated histone H4, as the direct chromatin target of BET proteins, engage in the cancer-related pathways.
The BET family shares a C-terminal extra-terminal domain and two tandem bromodomains, BD1 and BD2, that primarily bind to multi-acetylated histone H4 tail at K5, K8, K12, and K16 in vitro, but not to the monoacetylated histone H3/H4 peptides, including that of acetylated H3 K27 (H3K27ac) [Citation9,Citation10,Citation12,Citation13]. Since acetylation of histone H4 in the nucleus is proposed to occur at K16 first, then at K12, K8, and K5 [Citation14], the simultaneous acetylation of K5 and K8 indicates a typical state of histone H4 hyperacetylation [Citation14]. Indeed, BET proteins preferentially bind to the K5/K8-diacetylated H4 tail peptides mimicking hyperacetylated H4 in vitro [Citation12,Citation13]. Additionally, H4 K5 acetylation (H4K5ac) facilitated by histone acetyltransferase p300 (EP300) and disruptor of telomere silencing 1-like (DOT1L) might facilitate the binding of BRD4 to the chromatin [Citation15]. At a genome-wide level, BRD2, BRD3, and BRD4 co-occupy H3K27ac sites at most of the active promoters together with RNA polymerase II and Mediator complex [Citation16–Citation18]. However, it is unclear whether BET proteins have a preferred binding to hyperacetylated histone H4 or H3K27ac in vivo. Furthermore, while genome-wide H3K27ac-enriched sites that overlap highly with BRD2, BRD3, and BRD4 binding sites are not sensitive to a certain concentration of JQ1 [Citation6,Citation16], effects of JQ1 to hyperacetylated histone H4 are not studied at the genome-wide level. The lack of antibody specifically recognizing the hyperacetylated states of histone H4 tail potentially hampers efforts to address this question.
In this study, we generated a monoclonal antibody that specifically recognizes simultaneous acetylations at K5 and K8 of histone H4 (referred to as H4K5acK8ac), and employed it for ChIP-seq analyses. We used non-small cell lung cancer (NSCLC) cell line H23, which carries KRAS and TP53 mutations and has a mild sensitivity to BET inhibitors JQ1 and iBET [Citation11,Citation19,Citation20], to assess the co-occupancy of BRD2 with hyperacetylated H4 and H3K27ac at a genome-wide level. Furthermore, we performed transcriptomics by cap-analysis of gene expression (CAGE) method [Citation21]. CAGE captures 5' starts of transcribed RNAs, making it possible to determine precise positions of TSSs and transcribed enhancers genome-wide [Citation21]. Through the integrative analyses of ChIP-seq and CAGE data, we elucidate the involvement of BRD2 in gene regulation upon BET inhibition by JQ1 in H23 cells.
Results
Generation of a specific monoclonal antibody against H4K5acK8ac
In order to explore the association of BRD2 with histone H4 hyperacetylation at a genome-wide level and to elucidate the effect of JQ1 on hyperacetylated H4, we first developed a mouse monoclonal antibody that specifically recognizes hyperacetylated histone H4. We synthesized the full-length histone H4 protein with site-specific acetylations at K5 and K8 on a milligram scale [Citation22], and used it as the antigen. Through screening with ELISA and Western blot, we successfully obtained two hits of hybridoma (1A9D7 and 2A7D9) that recognize the histone H4 proteins containing di-acetylation of K5acK8ac (i.e. H4K5acK8ac and tetraacetylated H4) but not monoacetylated H4 proteins (), Figure S1A–B). These were further confirmed by the peptide array analysis showing that 2A7D9 binds to H4 peptide only if K5acK8ac is present (), Table S1), whereas 1A9D7 also weakly bound to H2BK12acK15ac (Table S1). For comparison, we also examined specificity of the two commercially available antibodies for hyperacetylated H4 (Upstate 06–946 and Abcam ab177790), which we found not to be specific (Table S1). In addition to tetra-acetylated histone H4 or H4K5acK8ac, these antibodies also detected H4 mono-acetylation (K5 and K12) (Table S1).
Figure 1. Development of monoclonal antibodies that specifically recognize H4K5acK8ac. (A) ELISA assay for 2A7D9 antibody. Histone H4 protein containing indicated site-specific acetyllysine(s) are used as antigens. (B) Specificity analysis of 2A7D9 antibody using modified histone peptide array. Histone H4 peptides containing both K5ac and K8ac are indicated in the bottom panel. (C) Crystal structure of the 2A7D9 Fab fragment in complex with K5/K8-diacetylated histone H4 (1–12) peptide. Heavy and light chains are depicted in cyan and green, respectively. The K5/K8-diacetylated H4 peptide is shown in a yellow stick. (D) Close-up view of the 2A7D9 Fab fragment in complex with the H4 peptide. Carbon atoms of VH and VL chains are shown in cyan and green, respectively. Carbon atoms of acetyllysines positioned at 5 and 8 in the K5/K8-diacetylated H4 peptide are shown in yellow. All the nitrogen and oxygen atoms are shown in blue and red, respectively. Hydrogen bonds are indicated as dotted lines with linear distances (Å). (E and F) Close-up view of the complex around the 54th residue of VH chain. (E) 1A9D7 antibody, (F) 2A7D9 antibody. In (E) and (F), N- and C-terminus of the K5/K8-diacetylated H4 peptide is shown as red label of N and C, respectively. Glutamic acid at 54th position (E) and alanine at 54th position (F) is shown in magenta. In (F), asparagine 52 and threonine 53 are shown in orange, and hydrogen bonds formed between the VH chain (i.e. N52–A54) and the H4 peptide (i.e. S1) are shown as dotted lines.
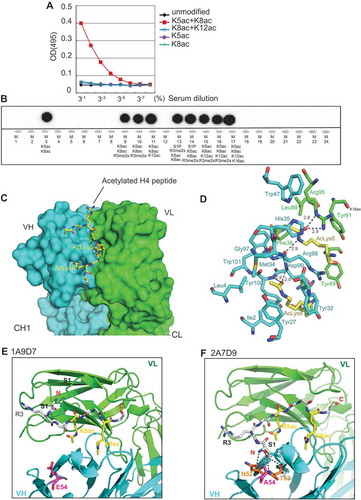
We next determined crystal structures of the antigen-binding (Fab) fragments of the two monoclonal antibodies, 2A7D9 and 1A9D7, in a complex with the H4K5acK8ac tail peptide at 1.7–1.8 Å. With both antibodies, the H4K5acK8ac peptide is recognized by a cleft formed by VH and VL, and the K5ac and K8ac side chains are respectively recognized by a different cavity (), Table S2). The carbonyl group, which is generated by acetylation of the ε-amino group of K5ac, is specifically recognized by the side-chain guanidium group of R95 in VL. On the other hand, the carbonyl group of the ε-amino group of K8ac is specifically recognized by the main-chain amino groups of D99 and Y100 in VH ()). The side chain of R 98 in VH spatially separates the two Kac-recognizing cavities, and only VH residues form the K8ac-recognizing cavity ()). Hence, we found that the individual H4K5ac- and H4K8ac-binding modes of the antibodies are completely different from the cooperative H4K5acK8ac-binding mode of the BRDT BD1 bromodomain reported by Moriniere et al. [Citation23].
By comparing the primary and tertiary structures of the two antibodies (–), Fig. S1C), we reasoned that A54 of VH in 2A7D9 is responsible for the strict discrimination of H4K5acK8ac. In 1A9D7 composing E54 at the same position, the Fab fragment does not bind to the N-terminal S1 residue of H4 ()). In contrast, A54 of 2A7D9 has a smaller side chain than that of the glutamic acid (i.e. E54), thus allowing binding of N52 and T53 to S1 of the H4 N-terminal tail ()). Thus, 2A7D9 preferentially binds to the N-terminal H4 sequence that contains S1 at the −4 position relative to H4K5ac than to any other histone tail peptide sequences ()). Since 1A9D7 cannot bind to H4S1, it cannot exclude binding to the N-terminal H2B sequence carrying K12ac and K15ac that contains P8 at the −4 position relative to H2B K12ac. Hence, our crystallographic analysis provides the structural basis for the selective recognition of H4K5acK8ac by the 2A7D9 antibody.
There are a series of monoclonal antibodies that detect monoacetylation of histone H4 at K5, K8, K12, and K16 [Citation24]. By comparing ChIP-seq profiles of the commercially available monoclonal antibodies against monoacetylations [H4K5ac (MABI0405) and H4K8ac (MABI0408)] to H4K5acK8ac antibody (2A7D9), we found that our H4K5acK8ac antibody generates higher ChIP-seq signals than either of the monoclonal antibodies against monoacetylations in H4 (Fig. S2A). Thus, to our knowledge, 2A7D9 is the first structurally validated monoclonal ChIP-seq grade antibody that exclusively recognizes the combinatorial acetylations of H4K5acK8ac and specifically detects chromatic hyperacetylated histone H4.
H4K5acK8ac co-localizes with H3K27ac at active promoters and enhancers
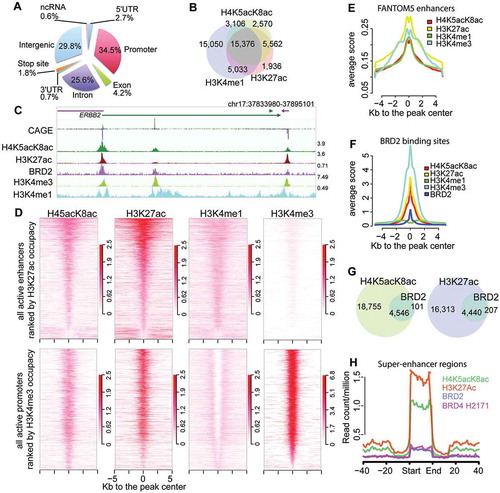
To perform a genome-wide profiling of H4 hyperacetylation and to compare it with other active chromatin marks, we performed ChIP-seq with the 2A7D9 antibody against H4K5acK8ac, along with antibodies against H3K27ac, H3K4me1, and H3K4me3. We identified 22,882 robust H4K5acK8ac peaks [irreproducible discovery rate (IDR) <0.01], of which 34.5% are at RefSeq promoters, 25.6% at introns and 29.8% at intergenic regions (), Table S3). Consistent with the notion of acetylated histone H4 as an open chromatin mark, H4K5acK8ac is found at transcriptionally active or open chromatin regions, including: i) enhancers (overlap with H3K27ac and H3K4me1; –)); ii) active enhancers (H3K27ac: >5 kb outside TSS; ), top); iii) active promoters (H3K4me3: ±5 kb from TSS; ), bottom); and iv) FANTOM5 transcribed enhancers ()). The co-localization of H4K5acK8ac with active promoter and enhancer marks was further confirmed by immunostaining (Fig. S2B). Consistently, H4K5acK8ac is associated with actively transcribed promoters and enhancers, as determined by co-localization with CAGE signals [~77% of TSS with expression level ≥0.25 CAGE tags per million (TPM)] (Table S3). Overall, our data show that the H4K5acK8ac mostly occupies active enhancer and promoter regions.
Figure 2. Genome-wide characterization of H4K5acK8ac sites and BRD2 binding sites. (A) A chart of genomic localization of H4K5acK8ac peaks. (B) Venn diagram showing a high overlap of H4K5acK8ac with two enhancer marks H3K27ac and H3K4me1. Using a simple intersection with at least 1 bp overlap, 78% of H4K5acK8ac sites overlap with 87% of H3K27ac sites and 80% of H4K5acK8ac with 50% of H3K4me1. (C) An example of a genome browser view of ChIP-seq signal of H4K5acK8ac, BRD2, other histone modification marks and gene expression signals by CAGE. (D) Heatmap of normalized H4K5acK8ac ChIP-seq intensities (read per million, RPM) within ±5 kb from the summit of active enhancers defined by H3K27ac located outside promoter (top) and active promoter defined by H3K4me3 at the TSS (bottom). H3K4me1 and H3K27ac mark active enhancer (top), while active promoters are highly enriched for H3K4me3 and H3K27ac but devoid of H3K4me1 (bottom). Color density indicates the enrichments of histone modification marks. (E) Enrichment of H4K5acK8ac and other histone modification marks within FANTOM5-defined enhancer regions. Average profiles (average RPM) of histone modification marks were plotted within ±5kb from the center of the enhancers (plotted by ngs.plot package 41). (F) Enrichment of active histone modifications within BRD2 binding sites, as shown by average ChIP-seq profiles of the histone modification marks. (G) Venn diagram showing a high overlap of BRD2–H4K5acK8ac (97.8%, left) and BRD2–H3K27ac (95.5%, right). (H) Enrichment of BRD2 and BRD4 ChIP-seq intensities (average RPM) in the super-enhancer regions identified by H4K5acK8ac ChIP-seq. BRD4 ChIP-seq from SCLC H2171 cell line was obtained from GSE4235513.
To further understand the general profile of H4K5acK8ac, we next examined H4K5acK8ac features in two ENCODE Tier 1 cell lines, lymphoblastoid cell line GM12878 and immortalized chronic myelogenous leukemia (CML) cell line K562. Genomic localization of the H4K5acK8ac peaks in both GM12878 and K562 cell lines show a similar pattern as observed in the H23 cell line, with the majority of H4K5acK8ac peaks localized at promoters, introns, and intergenic regions (Fig. S3A). Comparison of H4K5acK8ac peaks in three different cell lines shows around 20% (8,487) of H4K5acK8ac peaks in H23 are common among the three cell types, suggesting that the majority of H4K5acK8ac sites is cell type-specific (Fig. S3B). Furthermore, enrichment of histone modification marks (ENCODE datasets) around H4K5acK8ac peaks at TSS and outside TSS in GM12878 and K562 were also similar to those observed in H23 (Fig. S3C-D). These results were further confirmed by genome-wide correlation analysis showing high association of H3K27ac and H3K4me2 with H4K5acK8ac (Fig. S4). In general, H4K5acK8ac shows similar genomic profile among different cell types.
Stronger association between BRD2 and H4K5acK8ac than BRD2 and H3K27ac
Although BET proteins preferentially bind to multi-acetylated histone H4 in vitro (mimicking hyperacetylation), it is not known whether BRD2 preferentially binds to hyperacetylated H4 in vivo, compared to other acetylated forms such as H3K27ac. Since the BRD2 binding pattern in H23 cells has not been characterized yet, we performed BRD2 ChIP-seq and identified 4,647 robust BRD2 binding sites, which are found at promoters (47.5%), introns (21.7%), and intergenic regions (15.8%) (Fig. S5A). Moreover, when overlaid with the CAGE data, 87% of BRD2 binding sites are localized at actively transcribed promoters of coding and noncoding genes (CAGE ≥0.25 TPM; Table S3). Consistently, BRD2 binding sites are highly enriched with active marks (e.g. H3K4me3, H3K27ac, and H4K5acK8ac) ()), where at least 95% of the BRD2 peaks overlap with H4K5acK8ac and H3K27ac ()).
In a complementary analysis, we examined the enrichment of bromodomain proteins BRD2, BRD4, and EP300 at the H4K5acK8ac sites using the publicly available ChIP-seq datasets from the closely related cell types: BRD4 ChIP-seq from SCLC cell line H2171 (GSM1038270) [Citation16] and ENCODE P300 ChIP-seq from NSCLC A549 [Citation25]. We found that promoter- and enhancer-associated H4K5acK8ac regions were enriched for BRD2, BRD4, and EP300 (Fig. S5B), suggesting the co-localization of H4K5acK8ac with these bromodomain-containing proteins. We also identified 432 super-enhancers based on H4K5acK8ac peaks, which are also enriched with H3K27ac and BRD2 (), Table S4). Taken together, our ChIP-seq analysis shows that BRD2 mostly localizes to active promoters and enhancers, including super-enhancers in H23 cells.
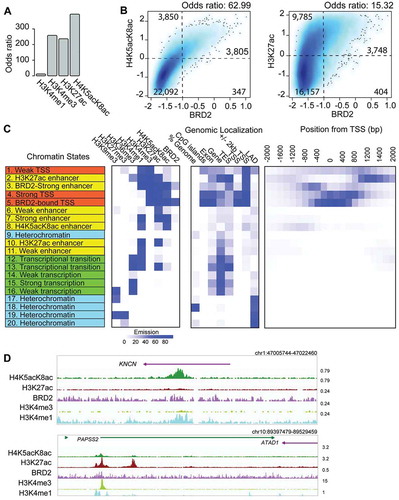
To determine how strongly BRD2 co-occurs with H4K5acK8ac or H3K27ac, we calculated the odds ratio (OR) between BRD2 and each histone modification mark. BRD2 is associated at the strongest level with H4K5acK8ac, followed by H3K27ac and H3K4me3, and at the lowest level with H3K4me1 ()). This finding was further verified using an independent analysis where we determined the correlation between BRD2 and H4K5acK8ac or H3K27ac ChIP-seq read intensities within a defined set of active genomic regions. First, we created a reference of 30,243 active genomic regions based on CAGE transcription start sites (unidirectional TSS and bidirectional enhancers), H4K5acK8ac peaks, and H3K27ac peaks. Based on this reference, normalized ChIP-seq read intensities of BRD2 were plotted against those of H4K5acK8ac or H3K27ac ()). The levels of H4K5acK8ac correlate well with that of BRD2: weak H4K5acK8ac with weak BRD2 and strong H4K5acK8ac with strong BRD2 (), left), whereas a small number of the active regions is enriched for strong H3K27ac, but contains much weaker BRD2 signals (), right, the top right corner). Thus, BRD2–H4K5acK8ac co-localization shows higher enrichment (OR: 62.99) than the BRD2–H3K27ac association (OR: 15.32) ()). Collectively, our findings uncovered for the first time strong evidence for the preferential binding of BRD2 to K5/K8-diacetylated histone H4 sites (representing H4-hyperacetylated states) genome-wide.
Figure 3. Association of BRD2 with histone H3 and H4 acetylation and different chromatin states defined by ChromHMM. (A) Bar plot showing the genome-wide association of BRD2-binding sites and histone modification marks (H3K4me1, H3K4me3, H3K27ac, and H4K5acK8ac) measured by odds ratio. The higher odds ratio means higher association. (B) Association between BRD2 binding and H4K5acK8ac (left), or H3K27ac (right), shown by a density plot. X-axis: the normalized ChIP-seq signal (log10 RPM + 0.25) of BRD2, y-axis: H4K5acK8ac (left) or H3K27ac (right). The regions were divided into weak and strong signal categories (thresholds: −1 for BRD2; 0 for H4K5acK8ac and H3K27ac) and the numbers represent contingency table between weak and strong categories of the compared marks. The odds ratios were calculated by Fisher Exact Test using the contingency table as input and represent the co-occurrence/enrichment between strong BRD2 signals and H4K5acK8ac (left) or H3K27ac signals (right). (C) Twenty ChromHMM chromatin states defined based on the histone modification marks and BRD2. The left panel represents the predicted chromatin states of indicated histone modifications, shown by different colors (orange for promoter/TSS, yellow for enhancer, green for transcription/elongation, and cyan for heterochromatin); the middle panel (genomic localization) indicates the genomic distribution of each state; the right panel shows the enrichment of each state within ±2 kb of TSS (RefSeq). (D) Genome browser views showing examples of H4K5acK8ac-preferential enhancer (upper) and H3K27ac-preferential enhancers (lower).
Identification of a chromatin state with high H4K5acK8ac, low H3K27ac, and low BRD2
We next asked whether there are any regions in the genome that are more highly enriched for H4K5acK8ac than H3K27ac (and vice versa), and whether there is any correlation with BRD2 level. We performed ChromHMM [Citation26] with five active histone marks (H4K5acK8ac, H3K4me1, H3K27ac, H3K4me3, and H3K36me3), two inactive histone marks (H3K27me3 and H3K9me3), and BRD2. Based on twenty emission states, we successfully recapitulated the known chromatin state patterns (), Fig. S6A-B): strong and weak promoters (orange states: 1, 4, 5), enhancer (yellow states 2–3, 6–8, 10–12), transcription (green states: 12–16), as well as heterochromatin (blue states 9, 17–20). The strong promoter states were differentiated into states 4 and 5 by BRD2 presence (state 5 is BRD2-bound and state 4 is BRD2-unbound promoters). Of the five strong enhancer states, state 8 ‘H4K5acK8ac enhancer’ is significantly enriched for H4K5acK8ac compared to H3K27ac (), upper), whereas state 10 ‘H3K27ac enhancer’ is more significantly enriched for H3K27ac than H4K5acK8ac (), lower), both of which are not enriched for BRD2 (), Fig. S6C). Additionally, enhancer state 3 contains both H4K5acK8ac and H3K27ac and is moderately enriched with BRD2 ()).
Since the H4K5acK8ac or H3K27ac enhancer states have low BRD2 enrichment, we next investigated the presence of other bromodomain proteins, EP300 (From A459) and BRD4 (from SCLC H2171) at these states ()). Although they are enriched in both enhancer states (Fig. S6C), BRD4 enrichment is higher in H4K5acK8ac enhancer state (Fig. S6C, right) than in H3K27ac enhancer state (Fig. S6C, left), again suggesting preferential binding of BRD4 to H4K5acK8ac. Overall, our analyses suggest that different bromodomain-containing proteins might recognize H4K5acK8ac- or H3K27ac-specific enhancers. Furthermore, although BRD2 has a preferred association to H4K5acK8ac over H3K27ac, it tends to be found at promoters/enhancers that have both H4K5acK8ac and H3K27ac.
BET inhibition by JQ1 does not affect global K5acK8ac level of histone H4
Since BRD2 exhibits a preference to H4K5acK8ac, we sought to elucidate whether inhibition of BET protein binding by JQ1 affects hyperacetylated histone H4 level. To examine this, H23 cells were treated with 500 nM JQ1 for 24 hours followed by ‘spike-in’ ChIP-seq with either BRD2 or H4K5acK8ac antibody (see Supplemental Methods). Under this condition, BRD2 binding was almost completely depleted at a global level ()). Consistent with previous studies[Citation6,Citation16], we did not observe any global changes in H3K27ac level (Fig. S7A). Interestingly, we observed that global H4K5acK8ac levels (including at promoters, enhancers, and super-enhancers) were also not affected by JQ1 (), middle and right; –)). Thus, inhibition of BET protein binding to chromatin does not significantly change the global hyperacetylation level of histone H4, implying that BET proteins are not required for maintaining or protecting the H4K5acK8ac histone modifications.
Figure 4. Effects of BET inhibition by JQ1 on BRD2 and H4K5acK8ac sites. (A) Treatment with 500 nM JQ1 for 24 hours led to global reduction of BRD2 binding sites (left) but not H4K5acK8ac at promoter (middle) or enhancer (right) regions. Average normalized read intensities of BRD2 and H4K5acK8ac ChIP-seq from JQ1 (red) or DMSO (blue)-treated cells were plotted on the BRD2 or H4K5acK8ac peaks derived from untreated cells, respectively. (B) Enrichment of H4K5acK8ac and BRD2 signal in the super-enhancer upon JQ1 treatment. (C) Genome browser view of BRD2 binding (top) and H4K5acK8ac signal (bottom) around the MYC-PVT1 loci in the JQ1- and DMSO treated cells. (D) MA scatter plot showing the log2 fold changes (log2FC >1 or >-1, FDR <0.05) of 535 increased and 1,256 reduced H4K5acK8ac peaks upon JQ1 treatment (y-axis) vs mean intensity (x-axis). (E) Relationship between changes in the H4K5acK8ac ChIP-seq peak signal (log2FC, x-axis) and the expression changes of their associated genes (log2FC, y-axis) upon JQ1 treatment. (F) Enrichment of H3K4me3, H3K27ac, H3K4me1 and BRD2 within ±5 kb from the summit of peaks with increased H4K5acK8ac signal (n = 553) upon JQ1 treatment, shown by normalized average profile. Example of the affected regions is shown on the right. (G) Enrichment of promoter and enhancer marks within ±5 kb from the summit of peaks with H4K5acK8ac decreased signal (n = 1,256). Example of the affected regions is shown on the right.
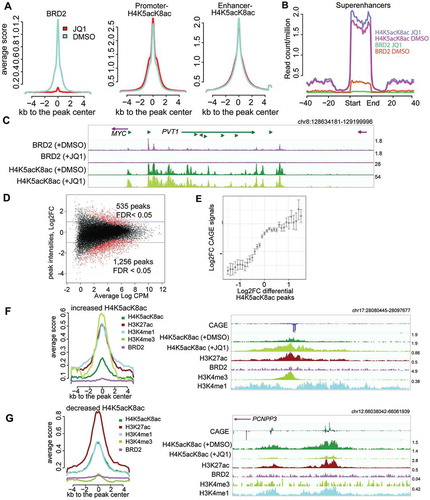
Despite the lack of global H4K5acK8ac change, we observed a small subpopulation of H4K5acK8ac peaks [~2%; false discovery rate (FDR) ≤0.05, 2-fold change] that was sensitive to JQ1 treatment ()). Similar changes in H3K27ac levels were also observed at these regions (Fig. S7B) and the changes in the H4K5acK8ac levels correlate significantly with the transcriptional activities of the associated promoters ()). The increased H4K5acK8ac peaks are associated with promoters, as they are highly enriched for H3K4me3 and to a lesser degree for H3K4me1 ()), while the decreased peaks are associated with transcribed enhancers, indicated by CAGE peaks and the high H3K4me1/H3K4me3 ratio ()). Interestingly, the H4K5acK8ac-specific regions that are affected by JQ1 are not bound by BRD2, although we cannot exclude BRD4/BRD3 enrichment in these regions (–)).
JQ1 treatment induces apoptosis in a MYC-independent manner in H23 cells
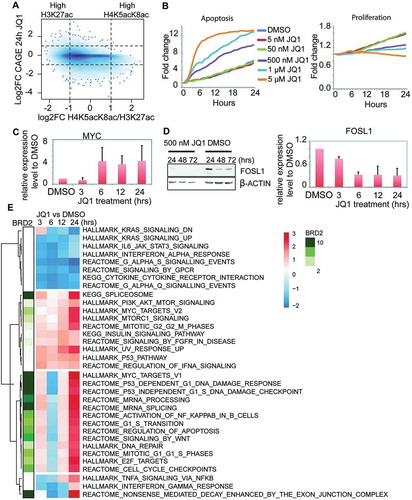
We next asked how the H4K5acK8ac/H3K27ac ratios are associated with transcriptional response to JQ1. We observed that active promoters with higher H4K5acK8ac level tend to be more downregulated upon JQ1 treatment (), bottom right corner), whereas active promoters with similar levels of H4K5acK8ac/H3K27ac or high H3K27ac show both directions (i.e. upregulated and downregulated), suggesting different regulatory mechanism are acting on these regions. Differential expression analysis between JQ1-treated cells and DMSO-treated (vehicle control) cells at 3, 6, 12, and 24 hours showed that more genes were downregulated than upregulated (FDR <0.05 and fold change ≥2; Fig. S8A, Table S5). We successfully validated 20 differentially expressed genes by qPCR (Fig. S8B, Table S6). Consistent with other studies [Citation6,Citation16], BRD2 and BRD4 expression levels were not reduced by JQ1 treatment (confirmed by qPCR), and similar to other NSCLC cell lines [Citation19], anti-apoptotic oncogenes CFLAR (FLIP) and BCL2 were markedly downregulated after 3 and 24 hours of JQ1 treatment, respectively (Fig. S8B-C). HOXC genes (important for anti-apoptotic pathway [Citation27, Citation28]) were downregulated at the early time point (Fig. S8D) in line with H23 cells undergoing apoptosis and slower cell proliferation rate ()). The main components of canonical Wnt/β-catenin signaling are reported to be modulated by JQ1 [Citation6,Citation29,Citation30] and in H23 cells, WNT2, WNT5A, and the mediator of Wnt signaling (LEF1 and TCF genes) were downregulated, while β-catenin encoded by CTNNB1 was only slightly affected (Fig. S8B). MYC is a Wnt signaling target and a key transcription factor (TF) that is downregulated by JQ1 in MM.1S, leukemia, and breast cancer cells [Citation6,Citation16,Citation31] and is believed to mediate JQ1 anti-oncogenic effect. Here we observed upregulation of MYC expression after JQ1 treatment in H23 cells (), Table S7). This is in agreement with results from another JQ1-sensitive NSCLC cell line [Citation11], where the effect of JQ1 on the cell growth is thought to be mediated by FOSL1, and not MYC [Citation11]. Notably, we also observed downregulation of FOSL1 upon JQ1, as confirmed by Western blot and qPCR ()).
Figure 5. Effects of BET inhibition by JQ1 in the transcriptional regulation in H23 cells. (A) Density plot of H4K5acK8ac/H3K27ac ratio (x-axis) versus the transcriptional response (log2 fold change) to JQ1 treatment (24 hours) measured by CAGE (y-axis). The values were calculated within 1 kb window of 30,243 active centers. Noteworthy, a fraction of H4K5acK8ac-enriched sites is downregulated after JQ1 treatment, but virtually no H4K5acK8ac-enriched sites are upregulated. (B) Effects of different concentrations of JQ1 (5 nM, 50 nM, 500 nM, 1 μM, and 5 μM) on the cell apoptosis (left) and proliferation (right) during 24 hours (x-axis). The y-axis reflects the fold change of the number of the apoptotic (left) or proliferating (right) cells at the indicated hours (1–24 hours) compared to 0 hour. (C) MYC expression upon JQ1 treatment at different time points. The gene expression level was determined by quantitative PCR from the JQ1- and DMSO-treated cells and normalized against GAPDH. (D) FOSL1 expression upon JQ1 treatment at 24–72 hours. Left: FOSL1 expression upon 500 nM JQ1 (left) and DMSO (right) treatment, as examined by Western blot. Right: FOSL1 gene expression level upon JQ1 treatment at 3, 6, 12, and 24 hours, as validated by qPCR. The expression level was normalized against DMSO and GAPDH. (E) Heatmap of the pathways after JQ1 treatment and association of BRD2 with the upregulated pathways. The clustering was performed based on the normalized enrichment score (NES) of the enriched pathways (P value ≤0.01, FDR <0.25) and visualized as a color-coded matrix. Color density indicates the enrichment; the left panel shows association of BRD2 binding sites with each pathway.
Potential BRD2-coupled transcription regulatory pathways
To elucidate the regulatory pathways affected by BET inhibition, we carried out pathway analysis of differentially expressed genes upon JQ1 treatment at each time point by gene set enrichment analysis (GSEA) (examples shown in Fig. S8E-G), and subsequently determined enrichment of BRD2 in these pathways ()). Specifically, we performed clustering on the normalized enrichment score (NES) of the enriched pathways (P value ≤0.01, FDR <0.25) ()). The complete list of the enriched pathways is available in Table S5. Upregulated pathways, such as apoptosis pathway, cell cycle regulation, Wnt/β-catenin signaling target genes, E2F-target genes, RNA processing-related genes, and MYC target genes (Fig. S8E), are highly enriched for BRD2 binding ()). On the other hand, downregulated pathways, such as cytokine–cytokine receptor pathway, KRAS target genes, and G protein signaling (Fig. S8F), were much less enriched for BRD2 binding ()). Differential expression analysis of the BRD2-bound genes also shows similar sets of genes are enriched (FDR <0.05, log2 fold change ≤−1; Table S8), including upregulation of MYC. Furthermore, pathway analysis using multiple functionally validated gene sets confirmed the enrichment of MYC and E2F target gene sets in the upregulated genes (NES ≥1.5, FDR ≤0.01) (Fig. S8G).
Identifying transcription factor candidates of BRD2-dependent and independent regulatory pathways
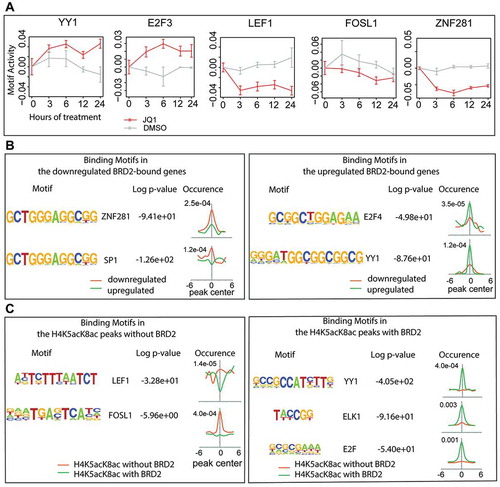
Since JQ1 treatment shows diverse effects (both upregulation and downregulation) on BRD2-bound genes, we hypothesized that different TFs might be involved in the transcriptional regulation in response to JQ1. We first performed motif activity response analysis (MARA) [Citation32] using CAGE data and identified several candidate TFs that are responsible for up- or down-regulation of genes upon JQ1 treatment (Z-value ≥2.0) (), Table S9). Among them are YY1 and E2F3, which show increased motif activity upon JQ1 treatment, and LEF1, FOSL1, and ZNF281, which show decreased motif activity ()). To further refine TF candidates into BRD2-dependent or independent pathways, we performed motif search analysis by HOMER [Citation33] using BRD2 binding sites of JQ1-upregulated and downregulated promoters. The downregulated promoters were enriched in ZNF281-binding motifs (), left), while E2F4- and YY1-binding motifs were enriched in the upregulated promoters (), right). Since LEF1- and FOSL1-binding motifs were not identified in the downregulated genes, they may be involved in the non-BRD2 regulatory pathway. Indeed, our HOMER [Citation33] motif enrichment analysis identified that LEF1- and FOSL1-binding motifs were enriched within H4K5acK8ac peaks without BRD2 binding (), left). Examples of promoters without BRD2 are shown in Fig. S9. On the other hand, YY1-, ELK1- and E2F-binding motifs were enriched in H4K5acK8ac peaks with BRD2 binding (), right). Consistent with previous reports that BRD2 colocalizes with CTCF [Citation34,Citation35], our HOMER motif enrichment analysis shows higher enrichment of CTCF motif with BRD2 peaks (Fig. S10A). Interestingly, the CTCF-binding sites from A549 cells are more enriched in the BRD2 peaks associated with the JQ1-downregulated genes than upregulated genes (Fig. S10B). Taken together, our findings provide a possible model where BRD2 recruits TFs such as YY1, ELK1, E2F, and ZNF281, along with CTCF, for the control of JQ1-responsive genes, and non-BRD2 BET proteins recruit other TFs such as LEF1 and FOSL1.
Figure 6. Association of BRD2 with different transcription factors. (A) The changes of motif activity of YY1, E2F3, LEF1, FOSL1, and ZNF281 transcription factors estimated by Motif Activity Response Analysis (MARA). Red and gray lines indicate the motif activities in the JQ1- and DMSO-treated cells, respectively. The motif activities reflect the expression of genes regulated by the transcription factors. (B) Transcription factor-binding motifs within the BRD2 peaks that overlap the downregulated (left) or the upregulated genes (right). The motifs were found de novo by HOMER and then linked to the best matching known motifs. The occurrence panels represent the enrichment of the motif within ±6 kb from the peak summit in BRD2 peaks at the downregulated (orange) and upregulated (green) genes. (C) LEF1 and FOSL1-binding motifs enriched in the H4K5acK8ac peaks without BRD2 (left) and YY1, ELK1, and E2F-binding motifs enriched in the H4K5acK8ac peaks with BRD2 (right).
Discussion
Antibody quality in terms of target specificity and reproducibility is one of the emerging issues in the biological sciences [Citation36,Citation37]. In this study, we generated a monoclonal antibody that specifically detects diacetylation at K5 and K8 of histone H4, a hallmark of H4-hyperacetylated chromatin states in vivo. Peptide array and crystal structure analyses confirmed its exclusive binding to H4K5acK8ac. By applying the structurally validated antibody to ChIP-seq, we first provided a comprehensive landscape of the histone H4-hyperacetylation in relation to other histone modifications and BRD2 binding. We showed that BRD2 preferentially associates with H4K5acK8ac genome-wide in human NSCLC cell line H23, and that the global H4 hyperacetylation level (i.e. H4K5acK8ac) on the chromatin is mostly not affected by JQ1-induced dissociation of BRD2. Finally, we identified active enhancer states containing significantly different enrichment between H4K5acK8ac and H3K27ac. By separately analyzing the differentially expressed regions that are bound or not bound by BRD2 prior to the JQ1 treatment, we identified several potential transcription factors that may be involved in the regulation of BRD2-dependent and independent gene expression in response to JQ1.
The finding that H4K5acK8ac levels at BRD2 binding sites were not affected despite complete reduction of BRD2 after JQ1 was surprising. In LPS-activated macrophages, BET inhibition reduced the levels of H3ac, H4K5ac, H4K8ac, H4K12ac, and total H4ac on promoters of the induced genes [Citation38]. This reduction is presumably due to increased accessibility of HDAC to the exposed BET protein binding sites by preventing the formation of multi-molecular complexes containing histone acetyltransferases (HATs) and other transcription machineries [Citation38], as shown by the reduced level of positive transcription elongation factor b (P-TEFb/CDK9) and RNA polymerase II on the affected regions [Citation38]. In H23 cells, however, a subset of BRD2-bound genes involved in RNA processing, such as POL2RA and CDK9, was in fact upregulated, and the transcription levels of HATs, such as KAT2A and EP300, were not affected by JQ1. This indicates that HAT-containing transcription complexes can still be recruited upon JQ1 treatment, and H4-hyperacetylated states could be maintained through the HAT activities of these complexes even if BET proteins are off the chromatin.
Interestingly, BRD2-containing nuclear multiprotein complexes are considered to contain histone H4-directed acetylase activity [Citation39], and it has been still elusive whether histone H4 (hyper)acetylation primarily recruits BET proteins or the BET proteins regulate histone (hyper)acetylation through their recruited HATs. The present results confirm that the recruitment of BRD2, presumably including BRD2-associated HATs, does not influence H4K5acK8ac modifications. Hence, it is plausible to consider a model, at least in H23, in which recruitment of BET proteins via histone H4 hyperacetylation is predominant over hyperacetylation of histone H4 by BET protein-associated HATs.
Several JQ1 studies have been conducted in NSCLC cell lines [Citation11,Citation20]; however, our study delivers more comprehensive transcriptome data by using CAGE, with which we identified downregulation of cytokine–cytokine receptor interaction pathways and several regulators of tumor-associated inflammation, such as IL6, which were not reported before. These findings are consistent with the previous reports that show that JQ1 inhibits inflammation in pancreatic ductal adenocarcinoma [Citation40] and a murine periodontitis model [Citation41]. Thus, our study implicates that JQ1 might also reduce inflammation in NSCLC cells.
In many cell types, MYC is downregulated upon JQ1 treatment [Citation3,Citation42–Citation44] and thought to be one of the key mediators of JQ1 effects. By contrast, MYC expression was found to be upregulated upon JQ1 treatment in H23 cells, suggesting that the effect of JQ1 treatment can vary depending on cancer or cell type, and, possibly, on genetic background. Our study, together with the previous study [Citation11], suggests that human NSCLC cell line H23 exhibits MYC-independent response to JQ1. Supporting the previous study that proposed a FOSL1-dependent mechanism [Citation11] in response to JQ1, our study suggests that FOSL1 and LEF1 might regulate transcription of non-BRD2 target genes presumably through BRD3 or BRD4. This result is consistent with the previous report that LEF1 acts as a coactivator in the presence of EP300 [Citation45] and induces lung adenocarcinoma metastasis [Citation46], while FOSL1 controls gene expression program mediating metastasis [Citation47]. Since FOSL1 and LEF1 expression levels were reduced by JQ1 treatment, downregulation of their downstream target genes, such as IL6, FOS, and JUN, may lead to reduction of metastasis. Further studies using NSCLC cell lines in comparison with other MYC-dependent cell models are needed for the validation of the MYC-independent regulatory mechanisms for JQ1-dependent growth inhibition.
By integrating the BRD2 ChIP-seq and CAGE data upon JQ1 treatment, we showed that YY1/E2F4 transcription factors might be responsible for upregulating and that ZNF281 might be responsible for downregulating genes upon JQ1 treatment. YY1 and E2F4 are associated with apoptosis and proliferation in tumor cells, and can act as transcriptional regulators, either directly or indirectly, via cofactor recruitment [Citation48–Citation51]. In our study, the expression of YY1 and E2F4 was not affected by JQ1. Thus, they may bind to their target genes and recruit other coactivators that lead to upregulation of their target genes. Since ZNF281 is involved in inducing epithelial–mesenchymal transition (EMT) and promotes metastatis [Citation52], anti-oncogenic effects of JQ1 on H23 cells may partly be due to downregulation of ZNF281, presumably through dissociation of BRD2, which may lead to disrupted EMT in lung cancer. Interestingly, a recent study showed that BRD2 activates expression of genes involved in EMT induction, whereas BRD3 and BRD4 exert opposite functions [Citation53], supporting distinct roles of BRD2 among the somatic BET proteins [Citation34,Citation35,Citation54,Citation55]. Other TFs identified by MARA but not discussed here may be involved in the BRD2-associated transcriptional regulation. Although the lack of BRD3/BRD4 data as well as of molecular validation of the abovementioned TFs are limitations, our work on BRD2 ChIP-seq and TSS-resolution transcriptome profiles in H23 will possibly help future studies of genome-wide patterns of transcriptional regulation by respective BET proteins in cancer cell models.
Collectively, we shed lights on the mechanism of BET inhibition effects on BRD2 at the H4-hyperacetylated chromatin and transcriptome levels in H23 cells. The complexity of BET inhibition effects becomes increasingly evident (e.g. opposite transcriptional effects of YY1/E2F4 and ZNF281/LEF1/FOSL1 target genes), and it can be explained by comparative analyses among BET family members, cell types, and epigenetics-regulating agents. In particular, our study reveals that BET inhibitors such as JQ1 may only be effective temporarily in anti-cancer progression, since they may not have the potency to change the epigenomic state of H4 hyperacetylation by monotherapy. It would, therefore, be interesting to investigate the synergistic effects of BET and HAT inhibitors on chromatic histone acetylations, especially on H4 hyperacetylation. Lastly, unanticipated effects of JQ1 treatment in H23 cells, such as increased expression of MYC, may deter the use of JQ1 as a clinical trial candidate for NSCLC, which contains the same gene mutations as those found in H23 cells. These observations reinforce the importance of understanding the transcriptional consequence of JQ1 treatment in each cancer and cell type; such studies should therefore be carefully taken into consideration, especially in the context of clinical trials.
Materials and methods
Generation and selection of mouse monoclonal antibodies
The full-length human H4 protein containing acetyl residue at K5 and K8 (H4K5acK8ac) was synthesized in a cell-free system essentially as previously described [Citation22,Citation56] and used to immunize mice. Generation, selection, and purification of antibodies were performed as previously described [Citation24], with the following modifications. After generating hybridomas, clones were screened by ELISA using plates immobilized with histidine-tagged H4 proteins containing site-specific lysine acetylation. In this screening, one positive control of H4 protein, H4K5acK8ac, and four negative controls of H4 protein (unmodified H4, H4K5ac, H4K8ac, and H4K8acK12ac) were used. cDNA were prepared from total RNA isolated from the hit hybridoma clones 1A9D7 and 2A7D9 and sequenced essentially as previously described [Citation57].
Antibody validation by peptide array
Peptide array was purchased from Active Motif (Cat. no. 13005). Blotting of the peptide arrays with the following antibodies were carried out following the manufacturer’s protocol: anti-H4K5acK8ac antibody clone 1A9D7, dilution 1:2,000; anti-H4K5acK8ac antibody clone 2A7D9, dilution 1:2,000; anti-hyperacetylated Histone H4 (Penta) antibody (Upstate 06–946, Lot no. 2631278), dilution 1:1,500; anti-Histone H4 (acetyl K5+K8+K12+K16) antibody (Abcam ab177790, Lot no. GR217018-4), dilution 1:15,000.
Crystallization, data collection, and refinement
Anti-H4K5acK8ac IgGs were purified from hybridoma cell culture supernatants using serial chromatography with HiTrap Protein G and the HiTrap Q column. The Fab fragments were prepared by papain digestion of the IgGs, followed by protein-A affinity chromatography to remove Fc fragments and undigested IgGs. The Fab fragments were further purified with size exclusion chromatography using a HiLoad 16/60 Superdex 200 column equilibrated with a 20 mM Tris-HCl (pH 8.0) buffer containing 150 mM NaCl. The concentrations of the Fab fragments were determined by UV absorbance at 280 nm. Chemically synthesized H4K5acK8ac peptide, corresponding to residues 1–12 of human histone H4 containing acetyllysines at positions 5 and 8 [S-G-R-G-Kac-G-G-Kac-G-L-G-K] (Toray Research Center, Japan) was dissolved in a 20 mM Tris-HCl buffer (pH 8.0) containing 150 mM NaCl. To prepare complexes of 1A9D7 Fab•H4K5acK8ac peptide and 2A7D9 Fab•H4K5acK8ac peptide, 340 µM Fab fragments were mixed with 680 µM of H4K5acK8ac peptide. Crystals of the 1A9D7 Fab•H4K5acK8ac peptide were obtained by the sitting drop vapor diffusion method from a drop containing equal volumes of the 1A9D7 Fab•H4K5acK8ac peptide solution and the reservoir solution containing 100 mM imidazole (pH 6.5), 150 mM zinc acetate, and 17.5% (w/v) PEG3000. The crystals of the 2A7D9 Fab•H4K5acK8ac peptide were similarly prepared with the reservoir solution containing 100 mM Bis-Tris buffer (pH 8.0), 200 mM ammonium acetate, and 25% (w/v) PEG3350. The crystals were immersed stepwisely in the reservoir solutions that contain increasing concentrations of glycerol [5%, 10%, 15%, and 20% (v/v)]. The crystals were flash-cooled with liquid nitrogen. X-ray diffraction datasets were collected using the beamline BL26B2 at SPring-8 (Harima, Japan). The datasets were integrated and scaled using the HKL-2000 software [Citation58]. The initial phases were calculated by the molecular replacement method using the software Phaser [Citation59]. The coordinate of the anti-OspA Fab fragment (PDB ID: 1FJ1) was used as a search model. The models were refined using the programs Coot [Citation60] and Phenix [Citation61].
Cell culture and JQ1 treatment
Non-small cell lung cancer, H23 cell line (NCI-H23) was purchased from ATCC (ATCC® CRL-5800™). Cells were cultured as recommended by ATCC in RPMI-1640 Medium containing 10% FBS and Penicillin/Streptomycin and sub-cultured every two days at the ratio of 1:3. For JQ1 treatment, cells were prepared 48 hours prior to the treatment, as followed: H23 cells were grown in a 15 cm plate at the density of 170,000 cells/ml (4 × 10⁶ cells/plate). On the day of treatment, the medium was replaced with the fresh medium containing 500 nM JQ1 or an equivalent volume/percentage of DMSO. The cells were collected at 3, 6, 12, and 24 hours after the addition of JQ1 and subjected to formaldehyde crosslinking for ChIP-seq experiment, RNA isolation for CAGE experiments or nuclear extraction for Western blot. JQ1 and DMSO treatment was done in three independent biological replicates.
Immunostaining
Immunostaining was performed as previously described [Citation62]. Anti-H4K5acK8ac antibody was labeled with Cy3 (GE Healthcare) to yield 1:4 dye/protein ratio. H23 cells were fixed for 5 min at room temperature and permeabilized with 1% Triton X-100 in PBS for 20 min at room temperature. After blocking with Blocking One P (Nacalai tesque) for 20 min at room temperature, cells were incubated with 2 μg/ml Cy3-conjugated anti H4K5acK8ac antibody with 2–10 μg/ml Alexa Fluor 488-conjugated histone modification-specific antibody (H3K27ac/CMA309, H3K4me1/CMA302, or H3K4me3/CMA304) [Citation63] and 1 μg/ml Hoechst33342 for 2.5 hours at room temperature. Fluorescence images were acquired using a confocal microscope (FV1000; Olympus) with a 60× UPlanApoN oil immersion lens (NA 1.40). Co-localization analysis was performed using NIS-elements analysis software ver. 4.30 (Nikon).
Chromatin extract preparation
Cells were crosslinked with 1% formaldehyde for 10 min at room temperature. The crosslink reaction was stopped by addition of glycine at the final concentration of 200 mM. H23 chromatin extract was prepared as follows: the cell pellets were dissolved and incubated in the ice-cold 0.1% SDS lysis buffer (50 mM Hepes KOH pH 7.5, 150 mM NaCl, 1 mM EDTA, 1% Triton X-100, 0.1% sodium deoxycholate, 0.1% SDS, and protease inhibitors) for 10 min on a rotation at 4°C. Following centrifugation, the cells were incubated in the ice-cold second lysis buffer (10 mM Tris-HCl pH 8.0, 200 mM NaCl, 1 mM EDTA, 500 µM EGTA, and protease inhibitors) as described above. The cells were then dissolved in 0.5% SDS sonication buffer (3 × 10⁶ cells per 135 μg sonication buffer), directed to chromatin fragmentation by Covaris for 10 min and the fragmented DNAs were then examined by an Agilent Bioanalyzer. The chromatin was diluted using 5× dilution buffer (10 mM Tris-HCl pH 8.0, 210 mM NaCl, 1.4% Triton X-100, and protease inhibitors) and stored at −80°C.
ChIP-seq
Chromatin immunoprecipitation was performed using the following antibodies: H3K27ac (mouse monoclonal, Diagenode, Cat. no. MAb-184–050, Lot no. 001–11), H4K5acK8ac (mouse monoclonal), H3K4me3 (mouse monoclonal, Cat. no. MAB307-34813, Lot no. 13005), H3K4me1 (Rabbit polyclonal, Diagenode Cat. no. C15410194, Lot no. A1862D), H3K27me3 [Rabbit polyclonal, Diagenode, Cat. no. C15410195 (pAb-195–050), Lot no. 00606C], H3K9me3 [Rabbit polyclonal, Diagenode, C15410193 9pAb-193–050), Lot no. A1862D], BRD2 (Rabbit monoclonal, Cell Signaling Technology, Cat. no. D89B4, Lot no. 002), H3K36me3 (Abcam ab9050, Lot no. GR249065-1), H4K5ac (mouse monoclonal, Cat. no. MABI 0405), and H4K8ac (mouse monoclonal, Cat. no. MABI 0408). The antibody (3 μg antibody/50 μl Dynabeads™ goat anti-mouse IgG (Cat. no. 11033) or sheep anti-rabbit IgG (Cat. no. 11203D) was incubated with the chromatin extract (4 × 10⁶ cells/ChIP) overnight at 4°C. The beads were then washed using the following conditions: 2 times with wash buffer 1 (10 mM Tris-HCl pH 8.0, 0.1% SDS, 0.1% sodium deoxycholate, 1% Triton X-100, 150 mM NaCl, 1 mM EDTA, and 500 µM EGTA); 2 times with wash buffer 2 (10 mM Tris-HCl pH 8.0, 0.1% SDS, 0.1% sodium deoxycholate, 1% Triton X-100, 500 mM NaCl, and 1 mM EDTA); and 2 times with LiCl wash buffer (10 mM Tris-HCl pH 8.0, 250 mM LiCl, 0.5% sodium deoxycholate, 0.5% NP-40, 1 mM EDTA, and 500 µM EGTA). For BRD2 ChIP-seq, 10 µg antibody was used and the washing condition was: 4 times with wash buffer 1, 4 times with wash buffer 2, and 4 times with LiCl wash buffer. The chromatin was eluted from the bead using TE buffer containing 1% SDS and then de-crosslinked by incubating with 1 μl of Proteinase K (20 mg/ml, EC 3.4.21.14, Tritirachium album limber, CAS 39,450–01-6) at 65°C for 3–4 hours. The DNA fragments were subsequently isolated using Qiagen MinElute column purification. ChIP quality was tested by qPCR using specific primers and negative control region. 1 μg of ChIP DNA was used for ChIP-seq library preparation using Mondrian and directed to 50 bp sequencing using HiSeq 2500. ChIP-seq was performed in two biological replicates for each factor.
Spike-in ChIP-seq and data processing
To detect global changes of H4K5acK8ac and BRD2 upon BET inhibition by JQ1, we performed ChIP with anti-H4K5acK8ac or anti-BRD2 antibody by adding a minor fraction of D. melanogaster chromatin extract (Active Motif Cat. no. 53083, Lot no. 11316004) and anti-Drosophila-specific histone variant, H2Av antibody (Rabbit polyclonal, Active Motif, Cat. no. 61686, Lot no. 17316003) in the H4K5acK8ac or BRD2 ChIP reaction. This Drosophila ChIP serves as an internal control and is used for ChIP-seq read count normalization after sequencing. Spike-in ChIP experiments with either H4K5acK8ac or BRD2 were performed in two biological replicates according to the above described ChIP-seq protocol with some modifications as follows: Anti-H4K5acK8ac or BRD2 antibody and anti-Drosophila H2Av antibody were mixed at the following ratio: H4K5acK8ac:H2Av = 4:2; BRD2:H2Av = 10:4; and then incubated with the Dynabeads for overnight. H23 chromatin extract and Drosophila chromatin extract were mixed at the ratio of 400 to 1 (μg) for H4K5acK8ac ChIP and 600 to 1 (μg) for BRD2 ChIP. Following overnight incubation of the mixed chromatin extract and the mix antibodies, the beads were subsequently washed using the above-mentioned conditions. The ChIP quality control was done as the manufacturer’s protocol and ChIP-seq library preparation was done as above described.
Analysis of spike-in ChIP-seq
After mapping and alignment of the ChIP-seq reads to a human and Drosophila genome reference, differences in Drosophila read counts across samples were equalized or normalized. The human ChIP-seq read counts were subsequently normalized using the same ratio used to normalize the Drosophila reads. Using the normalized read counts we called ChIP-seq peaks using MACS2 peak caller with the following commands: H4K5ac8ac ChIP-seq peak call: macs2 callpeak -t -c – bw 400 – broad – broad-cutoff 0.00005 -g hs.
BRD2 ChIP-seq peak call: macs2 callpeak -t -c – bw 350 -q 0.00005 -g hs – call-summits – slocal 2000.
To identify sites with H4K5acK8ac signal significantly changed upon JQ1 treatment, we merged peaks from biological replicate 1 (BR1) and 2 (BR2), and count the reads within the merged peaks, identified peaks with significant differential signal (FDR <0.05) using edgeR (version 3.6.8) with default settings[Citation64].
Transcriptome profiling using CAGE
CAGE was carried out to analyze transcriptome changes in H23 cell line upon BET inhibition by JQ1. CAGE libraries were prepared as previously described [Citation21,Citation65] using RNAs isolated from the nuclear fraction of the untreated/control (at 0 hour), 500 nM JQ1- and DMSO-treated H23 cells (at 3, 6, 12, and 24 hours). All of these treatment conditions have three biological replicates. Since stability of RNA sample affects the promoter hit rate and transcript complexity of a CAGE library, the RNA integrity of each sample was measured using an Agilent Bioanalyzer and all samples used in this study had RIN above 9.0. At least 3 μg RNA was used for CAGE library preparation [Citation65]. Each CAGE library was sequenced at least 15 million reads. The expression levels of genes were calculated based on the annotations from FANTOM CAT [Citation66] as described [Citation21]. Briefly, the numbers of CAGE read 5' ends (CAGE TSS) falling within the ±50 nt region of the prominent TSS of all CAGE clusters in FANTOM CAT were counted in all samples. The expression levels of CAGE clusters were relative log expression (RLE) normalized across all libraries as counts per million (CPM) using edgeR (version 3.6.8) [Citation64] with default settings. Gene-based expression levels were calculated as the sum of CPM of their associated CAGE clusters. Genes differentially expressed between samples were identified, based on CAGE tag counts, using edgeR (version 3.6.8) [Citation64] with default settings. Sets of genes that are enriched in each differential expression analysis were investigated using GSEA pre-ranked of the Gene Set Enrichment Analysis [Citation67], with genes ranked by the log2 fold-changes from edgeR, in default settings. Selected gene sets in the 4 time points were clustered, based on the normalized enrichment score from GSEAPreranked, using the R package Pheatmap (clustering method = ward, distance = euclidean).
RNA isolation and cDNA synthesis
Total RNA was isolated from the untreated (control, 0 hour), DMSO-, and JQ1-treated cells at 0, 3, 6, 12, and 24 hours. RNA isolation was performed using the TRIZOL reagent (Invitrogen, Thermo Fisher Scientific) according to the manufacturer’s protocol. RNA was dissolved in 50 µl of 100 µM EDTA in RNase-free water. The purity of isolated RNA was determined by OD260/280 using a NanoDrop ND-1000 Spectrophotometer (Thermo Fisher Scientific). cDNA was synthesized using High-Capacity cDNA Reverse Transcription Kit with RNase inhibitor (Applied Biosystems, Cat. no. 4374966). First strand cDNA synthesis was performed using 2μg of total RNA in recommended conditions per 20 µl reactions with the thermal cycling protocol: 25°C, 10 min; 37°C, 120 min; 85°C, 5 min; 4°C hold.
Validation of gene expression by quantitative PCR (qPCR)
Gene expression was determined by qPCR (7300/7500 StepOnePlus Real-Time PCR Systems (Applied Biosystems) using SYBR Premix Ex Taq II (Tli RNase H plus, Takara Bio, Cat. no. RR820B). cDNA (1 µl) was used as a template in a 20 µl qPCR reaction with the following cycle parameter: 95°C for 30sec, 40 cycles of 95°C for 5sec, and 60°C for 34sec. qPCR of each validated gene was done in duplicates and independently repeated two times for each biological replicate (primers listed in Table S6). The relative expression level of the tested genes was calculated from the JQ1 and DMSO samples and normalized against GAPDH expression.
Apoptosis and proliferation assays
To monitor cell proliferation during JQ1 treatment, Red Fluorescent Protein (RFP)-H23 cells were used. To quantify apoptotic cells, we used the IncuCyte® Caspase-3/7 Green Apoptosis Assay Reagent couples the activated caspase-3/7 recognition motif (DEVD) to NucView™488, a DNA intercalating dye (Cat. no. 4440). Apoptosis assay and proliferation assay were performed in a 96 well plate, as follows: RFP-H23 cells were seeded at a density of 8,000 cells/well one day before the experiments. On the day of experiments, the cells were treated with JQ1 at the concentrations of 5 nM, 50 nM, 500 nM, 1,000 nM, and 5,000 nM. For apoptosis assay, after adding the JQ1, Caspase-3/7 Green Apoptosis Assay Reagent was added as recommended according to the IncuCyte® protocol. The cell apoptosis and proliferation were monitored every hour directly after the plate was put in the IncuCyte incubator for 24 hours. The captured images were analyzed using the software provided by the IncuCyte® by counting number of the objects (Caspase 3/7 object-green fluorescence signal count for apoptotic cells or red fluorescence protein for proliferating cells) per image. The fold change in proliferation and apoptosis from 0 hour was then calculated for every time point in every JQ1 treatment experiment.
ChIP-seq peak calling
We used MACS2 [Citation68] peak-caller with the significance threshold: P value = 0.01 on each ChIP-seq replicate separately and on pooled bam files from ChIP-seq BR1 and BR2. We performed the irreproducibility discovery rate (IDR) analysis by running the batch-consistency-analysis.r script on the peaks from ChIP-seq BR1 and BR2 (https://sites.google.com/site/anshulkundaje/projects/idr). For the downstream analysis, we used the peaks from pooled bam that overlap with the peaks obtained after IDR analysis: IDR >0.01 for robust peaks and IDR >0.25 for permissive peaks.
Analysis of ChIP-seq peak profile
Genomic distribution/localization of H4K5acK8ac and BRD2 (), Fig. S2A), was determined using peak annotation function of HOMER [Citation33]. To examine and visualize enrichment of histone modification marks or BRD2 in defined regions, such as promoter, enhancer, eRNA, we performed meta-region analysis using genomation [Citation69]. Average normalized peak intensities (reads per million, RPM) of histone modification marks or BRD2 were plotted around the center of defined genomic regions (±5kb).
Super-enhancer (SE) and CAGE expression
Super-enhancers (SEs) were called on H4K5acK8ac reproducible peaks (IDR >0.01) using the publicly available tool ROSE [Citation16,Citation70] with default parameters. The stitched regions that are not classified as super-enhancers by ROSE are defined as typical enhancers (TEs). To associate the CAGE peaks to these regions, we used the bedtools closestBed function to find the peak closest to the SE or TE. Three biological replicates (BR) of CAGE for each time point were used. A set (3 BRs) of CAGE from the untreated cells was used as control. The figures were generated using the R function boxplot.
Unified set of active regions
To obtain a common set of active sites with acetylation marks, we merged the robust peaks (IDR <0.01) of H3K27ac (20,305 peaks) and H4K5acK8ac (22,882 peaks) and obtained 25,448 merged regions. We merged the peaks separated by less than 100 nucleotides, which reduced the number to peaks to 24,045. To perform integrative analysis of histone modification and transcription initiation events we aimed to identify the center and if possible the strand of transcription initiation. First, we overlapped the active acetylated regions with CAGE based TSS annotation from FANTOM5[Citation21] and found that 71,188 out of 201,802 known TTS (DPIs) are overlapping or within 200 nt window from the active acetyl regions in H23 cell line. We clustered TSS separated by less that 500 nt and selected the center and strand of strongest TSS/DPI as a representative for a given group of TSS cluster, which led to the selection of 21,251 centers with strand information (representing 14,685 out of 24,045 merged acetylation peaks). Second, we overlapped the remaining 9,360 acetyl peaks with bidirectionally transcribed enhancer annotated from FANTOM5 [Citation71,Citation72] and found 3,161 enhancer-overlapping 2,448 acetyl sites. We clustered enhancer separated by less that 500 nt and selected the strongest enhancer within each group, 2,815 in total. As the enhancers are bidirectionally transcribed, there is no strand/direction information. Third, we clustered the remaining 6,912 peaks separated by less that 500 nt and selected the strongest peak within each cluster, 6,177 in total. As we used peak midpoints as the centers, no strand information was available. In total, we obtained 30,243 active centers: 21,251 directional TTS, 2,815 bidirectional enhancers, and 6,177 acetylation peaks with little or no CAGE signal.
ChIP-seq and CAGE signal at the active sites
We calculated read per million within (RPM) ±5kb from the peak center, using strand/directionality information where available. The 10 kb window was divided in to 100 bins, and mean RPM within each bin were calculated using ngs.plot package[Citation73] and using bam files of pooled replicates as an input. The RPM profile within 10 kb window was calculated for all 30,243 active centers for each histone marks and CAGE, including time JQ1 time-course and input. 156 regions with mean RPM >0.15 in the input controls were blacklisted and removed from further analyses. To calculate the difference in ChIP-seq and CAGE signal between histone marks or between time points, we calculated the mean RPM in 1kb window of the center (±500 bp) and calculated the log2 fold changes, adding 0.25 offset to mean RPM values.
ChromHMM
We used ChromHMM software [Citation26] to identify chromatin states and to perform genome wide state annotation based on combination of H3K4me1, H3K4me3, H3K27ac, H4KacK8ac, H3K36me3, H3K9me3, H3K27me3, and BRD2. We used BinarizeBam to binarize each the genome into 200 nt bins. We used pooled bam files as an input, a default significance threshold, and fold change threshold >2. The segmentation was performed using LearnModel function, setting the number of states to 20 with default settings. As a reproducibility check we also performed binarization for set of BR1 and BR2 separately. When ChromHMM was performed using the ChIP-seq data set from BR1 and BR2, same findings were obtained, suggesting high reproducibility of our analysis (Fig. S6B).
De novo transcription factor binding motif search
To identify TFs, which control gene expression in BRD2-dependent or independent manners, we performed de novo motif search using HOMER [Citation33]. To identify DNA-binding motifs of TFs that might control the downregulation or upregulation of BRD2 bound genes, BRD2 peaks that overlap with the promoter of the downregulated genes or with the promoter of the upregulated genes were used to run HOMER motif search using the following parameter:
findMotifsGenome.pl input hg19 -size −150,150 -h -mask -S 10 -bg -len 8,10,12,15 input sequences: summits of the above indicated peaks generated by MACS2-bg/background sequences: BRD2 peaks associated with the downregulated genes was used for the motif search using BRD2 peaks associated with the upregulated genes and vice versa.
To search motifs of non-BET proteins which are recruited to acetylated chromatin, we performed motif search using H4K5acK8ac peaks that do not overlap with BRD2 as input sequences using the following parameter:
findMotifsGenome.pl input hg19 -size −150,150 -h -mask -S 10 -bg -len 6,8,12 background sequences: summits of all H4K5acK8ac peaks.
To visualize enrichment and occurrence of the identified motifs in the peak regions, HOMER’s ‘the annotate peak’ function was performed.
Motif activity response analysis (MARA)
To identify key TFs, which might be involved in transcriptional regulation affected by JQ1 and the transcriptional activities of their target genes, we carried out MARA[Citation32]. We submitted the bam files with mapped CAGE sequencing tags (hg19) to ISMARA online tool (The Integrated System for Motif Activity Response Analysis, http://ismara.unibas.ch/fcgi/mara). ISMARA integrates the gene expression data and the predicted transcription factor binding sites to provide estimates of TF motif activities.
Data access
The atomic coordinates and structure factors have been deposited in the Protein Data Bank (PDB) under the following accession codes: The Fab fragment of 2A7D9 in complex with the H4(1–12)K5acK8ac peptide: 5YE3; The Fab fragment of 1A9D7 in complex with the H4(1–12)K5acK8ac peptide: 5YE4. The ChIP-seq data used in this study have been deposited in the Gene Expression Omnibus (GEO) under accession code GSE113715.
Authors’ Contributions
LH performed most of the experiments. BK, LH, CCH, and ML performed the bioinformatics analyses. MW, KS, SY, and TU generated the antigens and antibodies. TM and TI performed crystal structure analysis. PJ performed validation qPCR experiments. YS and HK performed immunostaining analysis. LH, BK, AM, and TU designed the experiments, interpreted the results and wrote the manuscript. AM and TU supervised the project.
Supplemental Material
Download Zip (6.4 MB)Acknowledgments
We acknowledge Dr. Naohito Nozaki (Mab Institute Inc.) for his help in developing anti H4K5acK8ac antibodies; Dr. Atsushi Miyawaki (RIKEN Brain Science Institute) for providing us with the plasmid containing Venus; Dr. Hiroyuki Miyoshi (Keio University) for developing it; the RIKEN BioResource Center (RIKEN BRC) for distributing it; the BL26B2 beamline staff at the SPring-8 for their support in data collection; Dr. Jayson Harshbarger for Venn diagram (https://hypercubed.github.io/venn-chi/#/); Drs. Kazuhide Watanabe, Supat Thongjuea and Nando Dulal Das for the discussion; and Ms. Haruka Yabukami for technical supports.
Disclosure statement
No potential conflict of interest was reported by the authors.
Supplementary material
Supplemental data for this article can be accessed here.
Additional information
Funding
Related Research Data
References
- Verdin E, Ott M. 50 Years of protein acetylation: from gene regulation to epigenetics, metabolism and beyond. Nat Rev Mol Cell Biol. 2014;16:258–264.
- Zeng L, Zhou MM. Bromodomain: an acetyl-lysine binding domain. FEBS Lett. 2002;513:124–128.
- Pérez-Salvia M, Esteller M. Bromodomain inhibitors and cancer therapy: from structures to applications. Epigenetics. 2017;12:323–339.
- Filippakopoulos P, Qi J, Picaud S, et al. Selective inhibition of BET bromodomains. Nature. 2010;468:1067–1073.
- Zuber J, Shi J, Wang E, et al. RNAi screen identifies Brd4 as a therapeutic target in acute myeloid leukaemia. Nature. 2011;478:524–528.
- Chapuy B, McKeown MR, Lin CY, et al. Discovery and characterization of super-enhancer-associated dependencies in diffuse large B cell lymphoma. Cancer Cell. 2013;24:777–790.
- Baker EK, Taylor S, Gupte A, et al. BET inhibitors induce apoptosis through a MYC independent mechanism and synergise with CDK inhibitors to kill osteosarcoma cells. Sci Rep. 2015;5:10120.
- Asangani IA, Dommeti VL, Wang X, et al. Therapeutic targeting of BET bromodomain proteins in castration-resistant prostate cancer. Nature. 2014;510:278–282.
- Filippakopoulos P, Knapp S. Targeting bromodomains: epigenetic readers of lysine acetylation. Nat Rev Drug Discov. 2014;13:337–356.
- Zaware N, Zhou -M-M. Chemical modulators for epigenome reader domains as emerging epigenetic therapies for cancer and inflammation. Curr Opin Chem Biol. 2017;39:116–125.
- Lockwood WW, Zejnullahu K, Bradner JE, et al. Sensitivity of human lung adenocarcinoma cell lines to targeted inhibition of BET epigenetic signaling proteins. Proc Natl Acad Sci. 2012;109:19408–19413.
- Filippakopoulos P, Picaud S, Mangos M, et al. Histone recognition and large-scale structural analysis of the human bromodomain family. Cell. 2012;149:214–231.
- Baud MGJ, Lin-Shiao E, Cardote T, et al. A bump-and-hole approach to engineer controlled selectivity of BET bromodomain chemical probes. Science. 2014;346:638–641.
- Zhang K, Williams KE, Huang L, et al. Histone acetylation and deacetylation: identification of acetylation and methylation sites of HeLa histone H4 by mass spectrometry. Mol Cell Proteomics. 2002;1:500–508.
- Gilan O, Lam EYN, Becher I, et al. Functional interdependence of BRD4 and DOT1L in MLL leukemia. Nat Struct Mol Biol. 2016;23:673–681.
- Lovén J, Hoke HA, Lin CY, et al. Selective inhibition of tumor oncogenes by disruption of super-enhancers. Cell. 2013;153:320–334.
- Anders L, Guenther MG, Qi J, et al. Genome-wide localization of small molecules. Nat Biotechnol. 2014;32:92–96.
- Donato E, Croci O, Sabò A, et al. Compensatory RNA polymerase 2 loading determines the efficacy and transcriptional selectivity of JQ1 in Myc-driven tumors. Leukemia. 2017;31:479–490.
- Klingbeil O, Lesche R, Gelato KA, et al. Inhibition of BET bromodomain-dependent XIAP and FLIP expression sensitizes KRAS-mutated NSCLC to pro-apoptotic agents. Cell Death Dis. 2016;7:e2365.
- Shimamura T, Chen Z, Soucheray M, et al. Efficacy of BET bromodomain inhibition in KRAS-mutant non-small cell lung cancer. Clin Cancer Res. 2013;19:6183–6192.
- Forrest AR, Kawaji H, Rehli M, et al. A promoter-level mammalian expression atlas. Nature. 2014;507:462–470.
- Wakamori M, Fujii Y, Suka N, et al. Intra- and inter-nucleosomal interactions of the histone H4 tail revealed with a human nucleosome core particle with genetically-incorporated H4 tetra-acetylation. Sci Rep. 2015;5:17204.
- Moriniere J, Rousseaux S, Steuerwald U, et al. Cooperative binding of two acetylation marks on a histone tail by a single bromodomain. Nature. 2009;461:664–668.
- Hayashi-Takanaka Y, Maehara K, Harada A, et al. Distribution of histone H4 modifications as revealed by a panel of specific monoclonal antibodies. Chromosom Res. 2015;23:753–766.
- Bernstein BE, Birney E, Dunham I, et al. An integrated encyclopedia of DNA elements in the human genome. Nature. 2012;489:57–74.
- Ernst J, Kellis M. ChromHMM: automating chromatin-state discovery and characterization. Nat Methods. 2012;9:215–216.
- Ramachandran S, Liu P, Young AN, et al. Loss of HOXC6 expression induces apoptosis in prostate cancer cells. Oncogene. 2005;24:188–198.
- Moon S-M, Kim S-A, Yoon J-H, et al. HOXC6 is deregulated in human head and neck squamous cell carcinoma and modulates Bcl-2 expression. J Biol Chem. 2012;287:35678–35688.
- Rathert P, Roth M, Neumann T, et al. Transcriptional plasticity promotes primary and acquired resistance to BET inhibition. Nature. 2015;525:543–547.
- Fong CY, Gilan O, Lam EYN, et al. BET inhibitor resistance emerges from leukaemia stem cells. Nature. 2015;525:538–542.
- Shu S, Lin CY, He HH, et al. Response and resistance to BET bromodomain inhibitors in triple negative breast cancer. Nature. 2016;67:413–417.
- Balwierz PJ, Pachkov M, Arnold P, et al. ISMARA: automated modeling of genomic signals as a democracy of regulatory motifs. Genome Res. 2014;24:869–884.
- Heinz S, Benner C, Spann N, et al. Simple combinations of lineage-determining transcription factors prime cis-regulatory elements required for macrophage and B cell identities. Mol Cell. 2010;38:576–589.
- Cheung KL, Zhang F, Jaganathan A, et al. Distinct roles of Brd2 and Brd4 in potentiating the transcriptional program for Th17 cell differentiation. Mol Cell. 2017;65:1068–1080.
- Hsu SC, Gilgenast TG, Bartman CR, et al. The BET protein BRD2 cooperates with CTCF to enforce transcriptional and architectural boundaries. Mol Cell. 2017;66:102–116.
- Bradbury A, Plückthun A. Reproducibility: standardize antibodies used in research. Nature. 2015;518:27–29.
- Baker M. Reproducibility crisis: blame it on the antibodies. Nature. 2015;521:274–276.
- Nicodeme E, Jeffrey KL, Schaefer U, et al. Suppression of inflammation by a synthetic histone mimic. Nature. 2010;468:1119–1123.
- Sinha A, Faller DV, Denis GV. Bromodomain analysis of Brd2-dependent transcriptional activation of cyclin A. Biochem J. 2005;387:257–269.
- Mazur PK, Herner A, Mello SS, et al. Combined inhibition of BET family proteins and histone deacetylases as a potential epigenetics-based therapy for pancreatic ductal adenocarcinoma. Nat Med. 2015;21:1163–1171.
- Meng S, Zhang L, Tang Y, et al. BET inhibitor JQ1 blocks inflammation and bone destruction. J Dent Res. 2014;93:657–662.
- Delmore JE, Issa GC, Lemieux ME, et al. BET bromodomain inhibition as a therapeutic strategy to target c-Myc. Cell. 2011;146:904–917.
- Mertz JA, Conery AR, Bryant BM, et al. Targeting MYC dependence in cancer by inhibiting BET bromodomains. Proc Natl Acad Sci. 2011;108:16669–16674.
- Pérez-Salvia M, Simó-Riudalbas L, Llinàs-Arias P, et al. Bromodomain inhibition shows antitumoral activity in mice and human luminal breast cancer. Oncotarget. 2017;8:51621–51629.
- Li J, Sutter C, Parker DS, et al. CBP/p300 are bimodal regulators of Wnt signaling. EMBO J. 2007;26:2284–2294.
- Nguyen DX, Chiang AC, Zhang XHF, et al. WNT/TCF Signaling through LEF1 and HOXB9 mediates lung adenocarcinoma metastasis. Cell. 2009;138:51–62.
- Desmet CJ, Gallenne T, Prieur A, et al. Identification of a pharmacologically tractable Fra-1/ADORA2B axis promoting breast cancer metastasis. Proc Natl Acad Sci U S A. 2013;110:5139–5144.
- Xu X, Bieda M, Jin VX, et al. A comprehensive ChIP-chip analysis of E2F1, E2F4, and E2F6 in normal and tumor cells reveals interchangeable roles of E2F family members. Genome Res. 2007;17:1550–1561.
- Lee EY, Cam H, Ziebold U, et al. E2F4 loss suppresses tumorigenesis in Rb mutant mice. Cancer Cell. 2002;2:463–472.
- Gordon S, Akopyan G, Garban H, et al. Transcription factor YY1: structure, function, and therapeutic implications in cancer biology. Oncogene. 2006;25:1125–1142.
- Lee BK, Bhinge AA, Iyer VR. Wide-ranging functions of E2F4 in transcriptional activation and repression revealed by genome-wide analysis. Nucleic Acids Res. 2011;39:3558–3573.
- Larsen JE, Nathan V, Osborne JK, et al. ZEB1 drives epithelial-to-mesenchymal transition in lung cancer. J Clin Invest. 2016;126:3219–3235.
- Andrieu GP, Denis GV. BET proteins exhibit transcriptional and functional opposition in the epithelial-to-mesenchymal transition. Mol Cancer Res. 2018;16:580–586.
- Fernandez-Alonso R, Davidson L, Hukelmann J, et al. Brd4-Brd2 isoform switching coordinates pluripotent exit and Smad2-dependent lineage specification. EMBO Rep. 2017;18:1108–1122.
- Hsu SC, Blobel GA. The role of bromodomain and extraterminal motif (BET) proteins in chromatin structure. Cold Spring Harb Symp Quant Biol. 2017;82:37–43.
- Mukai T, Yanagisawa T, Ohtake K, et al. Genetic-code evolution for protein synthesis with non-natural amino acids. Biochem Biophys Res Commun. 2011;411:757–761.
- Zhu YY, Machleder EM, Chenchik A, et al. Reverse transcriptase template switching: A SMARTtm approach for full-length cDNA library construction. Biotechniques. 2001;30:892–897.
- Otwinowski Z, Minor W. Processing of X-ray diffraction data collected in oscillation mode. Methods Enzymol. 1997;276:307–326.
- McCoy AJ, Grosse-Kunstleve RW, Adams PD, et al. Phaser crystallographic software. J Appl Crystallogr. 2007;40:658–674.
- Emsley P, Lohkamp B, Scott WG, et al. Features and development of coot. Acta Crystallogr Sect D Biol Crystallogr. 2010;66:486–501.
- Adams PD, Afonine PV, Bunkóczi G, et al. PHENIX: A comprehensive Python-based system for macromolecular structure solution. Acta Crystallogr Sect D Biol Crystallogr. 2010;66:213–221.
- Sato Y, Kujirai T, Arai R, et al. A genetically encoded probe for live-cell imaging of H4K20 monomethylation. J Mol Biol. 2016;428:3885–3902.
- Kimura H, Hayashi-Takanaka Y, Goto Y, et al. The organization of histone H3 modifications as revealed by a panel of specific monoclonal antibodies. Cell Struct Funct. 2008;33:61–73.
- Robinson MD, McCarthy DJ, Smyth GK. edgeR: a Bioconductor package for differential expression analysis of digital gene expression data. Bioinformatics. 2010;26:139–140.
- Kodzius R, Kojima M, Nishiyori H, et al. CAGE: cap analysis of gene expression. Nat Methods. 2006;3:211–222.
- Hon -C-C, Ramilowski JA, Harshbarger J, et al. An atlas of human long non-coding RNAs with accurate 5’ ends. Nature. 2017;543:199–204.
- Subramanian A, Tamayo P, Mootha VK, et al. Gene set enrichment analysis: A knowledge-based approach for interpreting genome-wide expression profiles. Proc Natl Acad Sci. 2005;102:15545–15550.
- Feng J, Liu T, Qin B, et al. Identifying ChIP-seq enrichment using MACS. Nat Protoc. 2012;7:1728–1740.
- Akalin A, Franke V, Vlahoviček K, et al. Genomation: A toolkit to summarize, annotate and visualize genomic intervals. Bioinformatics. 2015;31:1127–1129.
- Whyte WA, Orlando DA, Hnisz D, et al. Master transcription factors and mediator establish super-enhancers at key cell identity genes. Cell. 2013;153:307–319.
- Arner E, Daub CO, Vitting-Seerup K, et al. Transcribed enhancers lead waves of coordinated transcription in transitioning mammalian cells. Science. 2015;347:1010–1014.
- Andersson R, Gebhard C, Miguel-Escalada I, et al. An atlas of active enhancers across human cell types and tissues. Nature. 2014;507:455–461.
- Shen L, Shao N, Liu X, et al. ngs.plot: quick mining and visualization of next-generation sequencing data by integrating genomic databases. BMC Genomics. 2014;15:284.