
ABSTRACT
Glioma stem cells (GSCs), a subpopulation of tumor cells, contribute to tumor heterogeneity and therapy resistance. Gene expression profiling classified glioblastoma (GBM) and GSCs into four transcriptomically-defined subtypes. Here, we determined the DNA methylation signatures in transcriptomically pre-classified GSC and GBM bulk tumors subtypes. We hypothesized that these DNA methylation signatures correlate with gene expression and are uniquely associated either with only GSCs or only GBM bulk tumors. Additional methylation signatures may be commonly associated with both GSCs and GBM bulk tumors, i.e., common to non-stem-like and stem-like tumor cell populations and correlating with the clinical prognosis of glioma patients. We analyzed Illumina 450K methylation array and expression data from a panel of 23 patient-derived GSCs. We referenced these results with The Cancer Genome Atlas (TCGA) GBM datasets to generate methylomic and transcriptomic signatures for GSCs and GBM bulk tumors of each transcriptomically pre-defined tumor subtype. Survival analyses were carried out for these signature genes using publicly available datasets, including from TCGA. We report that DNA methylation signatures in proneural and mesenchymal tumor subtypes are either unique to GSCs, unique to GBM bulk tumors, or common to both. Further, dysregulated DNA methylation correlates with gene expression and clinical prognoses. Additionally, many previously identified transcriptionally-regulated markers are also dysregulated due to DNA methylation. The subtype-specific DNA methylation signatures described in this study could be useful for refining GBM sub-classification, improving prognostic accuracy, and making therapeutic decisions.
Introduction
Glioblastoma (GBM) is the most malignant tumor in the central nervous system with a dismal median survival of 14–16 months [Citation1]. Despite aggressive multi-modal treatments, such as surgical resection combined with chemotherapy and radiotherapy, the outcome of patients with GBM remains poor [Citation2,Citation3]. To date, only IDH1 mutation and MGMT methylation status have been proven to be reliable indicators of GBM malignancy and therapeutic responses, respectively [Citation4,Citation5].
Glioma stem-like cells (GSCs) comprise a subpopulation of tumor cells that contributes to GBM heterogeneity, recurrence, and therapy resistance. Targeting the stem-like tumor cells is critical for improving GBM patient clinical outcome [Citation6]. GSC gene expression profiles represent three transcriptomically-defined subtypes of patient tumors: proneural (PN), mesenchymal (MES), and classical (CL) [Citation7–Citation9]. Additionally, epigenomic profiling (by DNA methylation analysis) has allowed the sub-classification of GBM tumors into six categories [Citation10]. However, a direct correlation between DNA methylation and gene expression profiles of GBM bulk tumors and GSCs has not been documented.
It is established that aberrant DNA methylation contributes to the pathophysiology of human cancers, including GBM [Citation11]. In general, promoter hypermethylation is associated with gene silencing of tumor suppressor genes, whereas hypomethylation is associated with gene expression, activation, and chromosomal rearrangements of oncogenes, contributing to tumor progression [Citation12]. Intragenic methylation may promote genomic instability and transcript splicing [Citation13].
In this study, we analyzed methylation array (Illumina HumanMethylation450 BeadChip, a.k.a. 450K) data on a panel of 23 patient-derived GSC lines and The Cancer Genome Atlas (TCGA) datasets for GBM bulk tumors. In addition, we compared an initial list of differentially methylated genes with their corresponding gene expression profiles in both GSCs[Citation7] and GBM bulk tumors. These DNA methylation alterations were associated with specific subtypes and were either unique to GSCs, unique to GBM bulk tumors, or common to both with respect to those specific subtypes. The dysregulated genes were associated with clinical prognosis of patients with gliomas.
Results
Methylation profiling identifies subtype-associated methylation signatures in GSCs and GBM bulk tumors
To determine the DNA methylation signatures associated with transcriptomically pre-defined GSC and GBM subtypes, we performed 450K methylation array profiling on a total of 23 GSC spheres that included six PN, four MES, and 13 GSC with unknown subtype [Citation7,Citation14,Citation15] (Supplemental Table 1). We downloaded DNA methylation and gene expression data for GBM bulk tumors from TCGA, including 22 PN, 29 MES, 13 neural (N), and 29 CL GBM (Supplemental ). Using strategies shown in , we first carried out transcriptomically pre-defined hierarchical clustering between six PN and four MES GSC subtypes [Citation7,Citation14,Citation15]. To determine whether known PN and MES GSCs presented distinct DNA methylation patterns, the 5,062 most variable CpGs were used (Supplementary Figure 2A). We then identified 11,994 CpGs differentially methylated between the PN and MES subtypes (as defined in ) after false discovery rate (FDR) correction (P <0.05; )). We further performed hierarchical clustering using these CpGs and generated an unknown cluster (U1), including JK42, JK44, JK46, and JK83 GSCs, with unknown subtype [Citation15], and the rest of GSCs that could not be clustered well ()). Thereafter, we proceeded with three distinct clusters (PN, MES, and U1) for further analyses.
Figure 1. Research design. Differentially methylated probes between the transcriptomically pre-defined PN and MES subtypes in GSCs and TCGA GBM bulk tumors were examined. CpG loci that are exclusively methylated or unmethylated in specific subtypes of GSCs and GBM (P <0.05) were compared to the corresponding gene expression profiles (P <0.05) to identify DNA methylation signatures. Then, the genes that were uniquely occurring either in GSCs or in GBM bulk tumors, or were commonly occurring in both were analyzed.
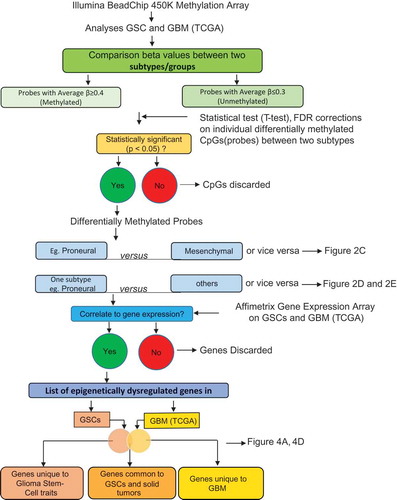
Figure 2. Subtype-associated methylation landscape in GSCs and GBM bulk tumors. (A) Methylation patterns based on 11,994 differentially methylated CpGs (P <0.05, FDR corrected) between transcriptomically pre-defined phenotypes of GSCs (4 PN and 6 MES) [Citation7,Citation14]. (B) Clustering of 23 GSCs generated PN, MES, and an unknown cluster U1 containing JK42, JK44, JK46, and JK83. (C) Differentially methylated genes between PN and MES in GSCs and GBM. (D) and (E) Hypermethylated or hypomethylated genes in each subtype of GSCs (D) and GBM (E). Numbers at the top of the bars in (C, D, E) indicate the number of genes that are methylated or unmethylated in the corresponding subtypes.
![Figure 2. Subtype-associated methylation landscape in GSCs and GBM bulk tumors. (A) Methylation patterns based on 11,994 differentially methylated CpGs (P <0.05, FDR corrected) between transcriptomically pre-defined phenotypes of GSCs (4 PN and 6 MES) [Citation7,Citation14]. (B) Clustering of 23 GSCs generated PN, MES, and an unknown cluster U1 containing JK42, JK44, JK46, and JK83. (C) Differentially methylated genes between PN and MES in GSCs and GBM. (D) and (E) Hypermethylated or hypomethylated genes in each subtype of GSCs (D) and GBM (E). Numbers at the top of the bars in (C, D, E) indicate the number of genes that are methylated or unmethylated in the corresponding subtypes.](/cms/asset/57ad7b4c-cee0-4c59-8f37-521231c2f2c3/kepi_a_1469892_f0002_oc.jpg)
We found that GSCs and GBM bulk tumor shared a similar bi-modal distribution of CpG methylation. We observed minimal variation between GSCs and GBM bulk tumors, with higher frequencies of methylated CpGs in GSCs than in GBM bulk tumors (Supplementary Figure 2B, ). In addition to performing statistical tests comparing each CpG site between the two subtypes, a binomial distribution test of PN vs. MES for GSCs and GBM bulk tumors was also carried out to ensure the statistical significance of these differences (P <2.2e−16; )). Interestingly, we observed substantially more MES-hypermethylated genes in both GSCs and GBM bulk tumors than MES-hypomethylated genes. Combined numbers of methylated genes in PN and MES subtypes in GSCs were higher compared to those in GBM bulk tumors ()). Next, we examined genes that were exclusively methylated in one subtype (e.g., PN GSCs) but unmethylated in another subtype (e.g., MES and U1 GSCs) ()). In addition, we examined genes that were methylated in one GBM subtype (e.g., PN), while unmethylated in other GBM subtypes (e.g., MES, N, and CL) ()). Conversely, subtype-associated hypomethylated genes were also specific to the indicated subtype of GSCs ()) and GBM bulk tumors ()). These data suggest that the MES subtype predominantly presents hypermethylation events, whereas the PN subtype exhibits mainly hypomethylation events ()). Taken together, these data suggest that MES GSCs and MES, N, and CL GBM bulk tumors show more hypermethylation events, whereas PN and U1 GSCs and PN GBM bulk tumors exhibit mainly hypomethylation events ( and )).
Genomic location of subtype-associated DNA methylation in GSCs and GBM bulk tumors
We determined whether each GSC/GBM bulk tumor subtype shows unique patterns of subtype-specific CpG methylation loci distribution with respect to gene structure – based on Illumina 450K array design [upstream of the promoter region (N-Shelf, N-Shore), promoter region (Islands), and downstream of the promoter region (S-Shore, S-Shelf, and Open sea)]. In Open sea positions, hypermethylated CpG loci show dominance in GSC U1 subtype ()) and GBM MES subtype ()). Conversely, the number of hypomethylated CpGs was higher in PN GSCs ()) and GBM CL ()). In Island positions, hypermethylated CpG loci show dominance in PN and MES GSCs ()) and N, CL GBM ()), while hypomethylated CpG loci were high in MES GBM bulk tumors ()). When hyper- and hypo-methylated CpGs were compared only between PN and MES subtypes, significant differences were also found in Open sea and Island positions in GSCs and GBM bulk tumors ()).
Figure 3. Distribution of subtype-specific hypermethylated and hypomethylated probes with respect to gene location. (A) and (B) Hypermethylated CpGs (text in red) in PN, MES, and U1 GSCs (A), and PN, MES, CL, and N GBM (B). (C) and (D) Hypomethylated probes (text in green) in PN, MES, and U1 GSCs (C), and PN, MES, CL, and N GBM (D). (E) and (F) Distribution/comparison of differentially methylated CpG loci in their genomic location in PN versus MES GSCs (E) and GBM bulk tumors (F).
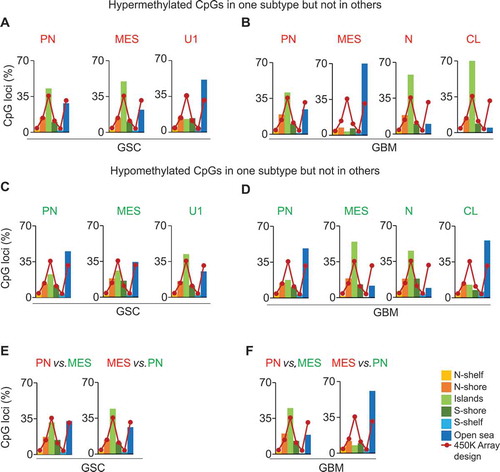
In the 450K methylation array, Illumina has defined the genomic location of each CpG as i) promoter region [transcription start site (TSS)1500, TSS200, TSS]; ii) 5’ untranslated region (5’UTR); iii) 1st exon and; iv) non-promoter region (body and 3’UTR). In the promoter region TSS1500 (1500 nucleotides upstream of the TSS), hypermethylated CpG loci showed dominance in U1 GSCs and N GBM bulk tumors, while hypomethylated CpGs were high in MES GSC and N GBM bulk tumors (Supplementary Figure 3A to 3C). In the body region, hypermethylated CpG loci showed dominance in PN, MES, and U1 GSCs, and in N GBM bulk tumors, while hypomethylated CpGs were high inPN, MES, N and CL GBM bulk tumors (Supplementary Figure 3A to 3C). Furthermore, CL GBM bulk tumors showed decreased levels of hypomethylated CpGs in all three types of promoter regions (Supplementary Figure 3D). When hyper- and hypo-methylated CpGs were compared only between PN and MES subtypes, significant differences were also found only in TSS1500 and body positions in GSCs and GBM bulk tumors, regardless of the direction of the comparisons were made (Supplementary Figure 3E, 3F).
DNA methylation gene signatures are either unique to each or common to both PN and MES GSCs and GBM
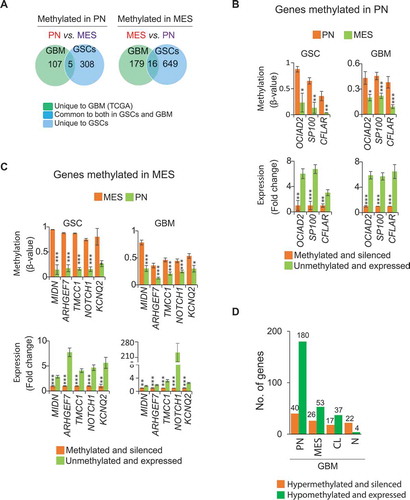
We assessed whether the subtype-associated DNA methylation signatures identified above were unique or common between PN and MES subtypes of GSCs and GBM bulk tumors. To this effect, we generated a corresponding list of genes whose methylation status correlates with their gene expression using our microarray expression datasets for GSCs (GSE67089) [Citation7] and TCGA datasets for GBM. We identified 313 PN-methylated genes in GSCs and 112 PN-methylated genes in GBM bulk tumors that showed ≥1.5-fold higher expression in MES GSCs and GBM bulk tumors, respectively () and Supplementary Table 2). Five were commonly dysregulated in GSCs and GBM bulk tumors: OCIAD2, GCNT2, SP100, MT2A, and CFLAR (), Supplementary Figure 4A-D, and Supplementary Table 3). Similarly, 665 MES-methylated genes in GSCs and 195 MES-methylated genes in GBM bulk tumors showed ≥1.5-fold increased expression in PN in GSCs and GBM bulk tumors, respectively () and Supplementary Table S2). Sixteen of these genes were commonly dysregulated in GSCs and GBM bulk tumors: MIDN, ARGHEF7, TMCC1, NOTCH1, KCNQ2, DIP2C, USP54, WSCD1, COL5A1, ATXN10, BACH2, SPATA2, TUB, PLXNB1, ETV1, and SOX5 (), Supplementary Figure 4E to 4H, and Supplementary Table 3).
Figure 4. Subtype-associated DNA methylation signatures in GSC and GBM bulk tumors. (A) Differentially methylated and expressed genes between PN and MES that are either unique to either GSCs or GBM, or are common between them. Representative examples of genes that are methylated and silenced either in PN (B) or MES (C) commonly in GSCs and GBM bulk tumors. * P <0.05; ** P <0.01; *** P <0.001. (D) Hyper- or hypo-methylated genes associated with one specific GBM subtype but not in other subtypes. Numbers at the top of the bars indicate the absolute numbers of hyper- or hypo-methylated genes. First, average β-value of individual CpG locus (probe) was determined to generate differentially methylated probes and then the genes corresponding to differentially methylated probes were identified.
To examine FDR of these genes, we randomly assigned PN and MES GBM bulk tumors into two groups: test and validation sets. We then determined the methylation of five PN-methylated/silenced and 16 MES-methylated/silenced genes in GBM bulk tumors. The methylation differences in GCNT2 and MT2A from five PN-methylated genes, and in KCNQ2 and SOX5 from 16 MES-methylated genes were not statistically significant in the validation set of GBM bulk tumors (Supplementary Figure 5A and 5B). This could be due to the small sample size. Therefore, 17 of 21 differentially methylated genes showed statistically significant methylation differences in GSCs as well as in randomly divided paired sets of GBM bulk tumors.
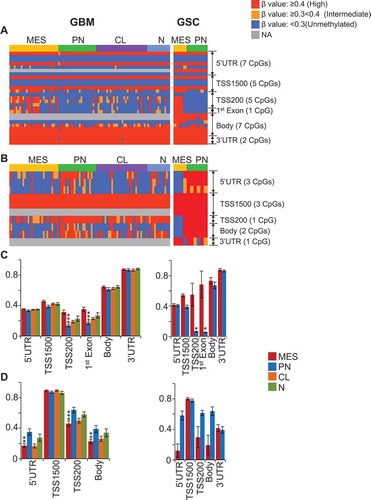
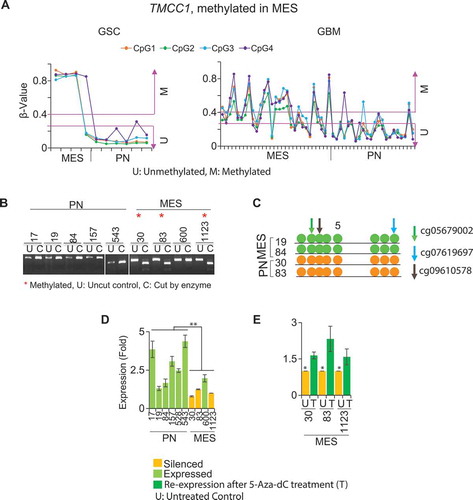
Figure 5. Global methylation profile of representative genes in GBM bulk tumors and GSCs. (A) Global methylation profiling of TMCC1 (a MES methylated gene) and (B) SP100 (a PN methylated gene). (C) Average β-value of all CpG loci in respective subtypes for TMCC1 (29 CpG loci) and (D) SP100 (10 CpG loci) from the 450K array, showing their methylation status in specific regions in respective subtypes. Methylation of these respective CpG loci also contributes to the correlation of methylation with the expression of these genes (Refer to ). *P <0.05; ** P <0.01; *** P <0.001.
Additionally, we determined DNA methylation signatures in GBM bulk tumors that are uniquely hypermethylated or hypomethylated in each subtype and investigated whether their methylation correlates with their gene expression profiles. Genes that were hypermethylated and silenced in one subtype were unmethylated and expressed in the other three subtypes. Conversely, the genes that were hypomethylated and expressed in one subtype were methylated and silenced in 3 other subtypes (), Supplementary Tables 4, 5, 6). Due to a lack of defined CL and N GSCs, we were unable to compare epigenetically dysregulated genes in CL and N GBM bulk tumors with GSCs.
Furthermore, we examined the methylation of all CpG loci for individual genes based on the 450K array to determine their global methylation pattern. Our analysis provided additional details regarding which gene regions contain CpG loci whose methylation contributes to overall gene silencing. We found that in TMCC1 (a MES-methylated gene with 29 CpG loci in the 450K array), only those CpG loci located in TSS200 and 1st exon regions were specifically methylated in both MES GBM bulk tumors and GSCs (). In MIDN (a MES-methylated gene with 23 CpG loci in the 450K array), methylation of only those CpG loci located in body regions was specific to MES both in GBM tumors and GSCs (Supplementary Figure 6A, B). Similarly, in SP100 (a PN-methylated gene with 10 CpG loci in the 450K array), only those CpG loci located in the 5’UTR and body regions were specific to PN in both GBM bulk tumors and GSCs ()).
Figure 6. Methylation and expression of TMCC1 in GSCs and GBM bulk tumors. (A) TMCC1 is methylated in MES but unmethylated in PN in both GSCs and GBM. COBRA (B) and bisulphite sequencing (C) validated methylation of TMCC1 in PN and MES GSCs. Arrows represent the methylated CpG sites that were used as references to design primers. Colors indicate different probes identified. (D) qRT-PCR analysis. TMCC1 is silenced in MES GSCs and is expressed in PN GSCs. (E) Treatment of MES GSCs with 1 µM 5-Aza-dC restored the expression of TMCC1. Data are representative from three independent experiments. * P <0.05; **P <0.01: U: untreated control: T: treated with 5-Aza-dC.
DNA methylation inversely correlates with gene expression
We investigated the extent of correlation between DNA methylation and gene expression in the identified genes that are commonly dysregulated in both GSCs and GBM bulk tumors (). A representative example includes methylation of TMCC1 ()), CFLAR, SP100, MIDN, and NOTCH1 (Supplementary Figure 7) in individual GSCs (6 PN and 4 MES; n = 10; )) and GBM bulk tumors (22 PN and 29 MES; n = 51; Supplemental ). We validated the methylation status of 4 genes, TMCC1 ()), MIDN, NOTCH1, and ARHGEF7 (Supplementary Figures 4, 8A, and 8B), by combined bisulphite and restriction analyses (COBRA) and/or direct bisulphite sequencing in representative samples. The methylation status of these genes was inversely correlated with their expression in individual samples () and Supplementary Figure 8C to 8F). After treating PN or MES GSCs with 5-Aza-2’-deoxycytidine (5-Aza-dC), TMCC1, SP100, CFLAR, MIDN, and NOTCH1 regained their expression () and Supplementary Figure 8C to 8F).
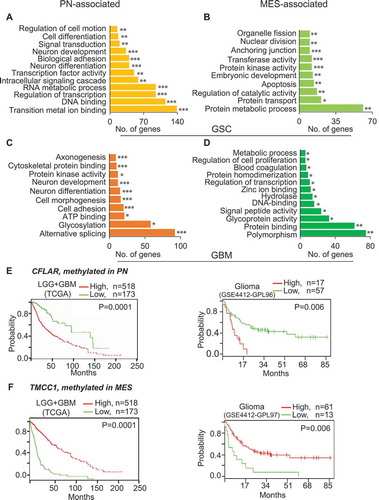
Figure 7. DNA methylation signature genes are associated with pathways and molecular functions and are predictive of clinical outcomes. Genes that are methylated in MES (A) and PN (B) in GSCs, as well as in MES (C) and PN (D) in GBM are associated with various molecular functions and pathways. (E) Low-expression of CFLAR, a PN-methylated/silenced but MES-unmethylated/expressed gene, and (F) high-expression of TMCC1, a MES-methylated/silenced PN-unmethylated/expressed gene exhibit better clinical outcome of glioma patients. * P <0.05; ** P <0.01; *** P <0.001.
PN- and MES-associated methylation gene signatures are associated with molecular functions, biological processes, and clinical prognosis of glioma
Analysis of subtype-associated methylation genes using the database for annotation, visualization and integrated discovery (DAVID) [Citation16] showed that these epigenetically dysregulated genes are associated with various molecular functions and biological processes (–)). By analyzing databases at Prognoscan[Citation17], PROGgeneV2 [Citation18,Citation19], and Firebrowse (http://firebrowse.org/), all linked to TCGA and the repository for molecular brain neoplasia data (Rembrandt) [Citation20] or other datasets, we determined the correlation of expression levels of the identified dysregulated genes with clinical outcomes of glioma patients. We found that high levels of expression of PN-methylated CFLAR and SP100 correlate with poorer prognoses () and Supplementary Figure 9A). Conversely, low levels of expression of MES-methylated TMCC1, ARHGEF7, NOTCH1, MIDN, KCNQ2, ATXN10, USP54, and TUB correlate with poorer prognoses (), Supplementary Figure 9B to 9H).
Finally, we performed multivariate analyses on clinical prognoses, expression of our candidate genes, and four established clinical prognostic indicators, including age, gender, and IDH1 and TP53 mutations. We found that instances of high CFLAR expression or low TMCC1 expression, which confer poor clinical prognoses of glioma patients, are independent of these factors (Supplementary Figure 10). Additionally, clinical prognoses of glioma patients due to the expression of ARGHEF7, NOTCH1, and SP100 are independent of TP53 mutations (Supplementary Figure 11). Furthermore, clinical prognoses of patients with glioma due to the expression of ARGHEF7 and SP100 are also independent of IDH1 mutations (Supplementary Figure 11). Lastly, high co-expression of PN-methylated genes CFLAR, SP100, and OCIAD2, and low co-expression of MES-methylated genes TMCC1, USP54, TUB, and NOTCH1 correlate with shorter survival (P = 0.018 and P = 0.011, respectively) for patients with high-grade gliomas (GSE 4271)[Citation21] (Supplementary Figure 12).
Discussion
In this study, we employed a novel approach to carry out genome-wide analyses of > 485,000 CpG loci from the 450K array data on a total of 23 patient-derived GSCs and 94 TCGA GBM bulk tumors. First, our analyses on GSCs produced three methylome clusters, of which PN and MES clusters recapitulated pre-defined gene expression subtypes. We identified an additional methylome cluster in GSCs referred to as U1. Second, we identified subtype-specific global hyper- or hypo-methylation events and unique patterns of hypermethylated or hypomethylated CpG loci distribution with respect to genomic positions. Third, we identified methylation signatures that are unique to GSC, or GBM bulk tumors, or are common between them. Fourth, we validated the methylation and expression status of commonly dysregulated genes in GSCs and GBM bulk tumors. Lastly, using individual and multivariate analyses, we performed correlation analyses on levels of expression of those commonly dysregulated genes with the clinical prognosis of glioma patients.
Our analyses of the DNA methylome profiling distinguished GSCs into three distinct clusters. Of these, PN and MES were re-confirmed based on transcriptionally pre-defined GBM bulk tumors and GSCs [Citation7,Citation22]. Previous studies also classified GBM into six methylome clusters[Citation23]. Here, we showed that subtype-specific global hyper- or hypo-methylation events correlate to gene expression in respective GBM/GSC subtypes. These subtype-specific methylation events are higher in GSCs when compared to GBM in respective subtypes, suggesting that GBM stem-like cell populations may have acquired higher levels of DNA methylation. However, there are fewer GSC lines compared to GBM bulk tumors included in this study. Therefore, we cannot exclude the possibility that this may have influenced the difference in the number of genes identified between GSCs and GBM bulk tumors. Moreover, there is a similar β-value distribution pattern of CpGs among GSCs or GBM bulk tumors. Unique patterns of CpG distribution with respect to genomic location and gene features in each of GSC and GBM subtype provide useful information on epigenetic mechanisms of subtype-specific phenotypes.
This study generated subtype-associated epigenetic signatures that are uniquely dysregulated in GSCs or GBM bulk tumors, or are commonly dysregulated between them. Of note, more genes with DNA methylation alterations were found in GSCs overall compared to GBM bulk tumors. A possible explanation for these data is that GBM bulk tumors are highly heterogeneous. GBM bulk tumors are comprised of non stem-like tumor cell populations with a small fraction of GSC as well as other types of tumor-associated cells. GSCs constitute predominantly stem-like tumor cell populations [Citation6,Citation24,Citation25]. As a result, the differences in distinctly dysregulated genes with respect to DNA methylation and gene expression may reflect variations in the composition of GSCs and GBM bulk tumors. Another explanation for these results is that these GSCs were non-clonally derived from fresh surgical tumor specimens and enriched for stem-like tumor cell populations by cell culture at various laboratories, including ours. These GSCs retain the vast majority of properties of both tumor and stem cells. Therefore, the subtype-associated epigenetic signatures in GSCs should be mostly distinct from GBM bulk tumors but similar to a small extent. Our analyses are in agreement with a recent study that reveals advantages and limitations of using glioma spheres (i.e., GSCs) to model GBM biology [Citation9]. Compared to this report [Citation9], a limitation in our study is the lack of paired GSC and GBM bulk tumor samples, which would provide a better comparison of methylation and gene expression. Nonetheless, our analysis of a total of 21 commonly dysregulated genes with respect to DNA methylation, gene expression, and correlation of gene expression with clinical prognoses strongly indicates high significance of these subtype-associated epigenetic signatures in GBM biology and clinical applications.
In addition, previously reported gene expression signatures in GBM [Citation22] inversely correlate with our identified DNA methylation gene signatures. Among our subtype-associated epigenetic gene signatures, 33 genes of PN-methylated/silenced and 55 genes of MES-methylated/silenced gene signatures matched previously published PN and MES-enriched gene signatures, respectively [Citation22]. This includes well-established PN markers, such as OLIG2, PDGFRA, and NOTCH1 as well as MES markers, such as PGCP, SP100, STAT6, TNFRSF18, and CASP8. Thus, our data suggest that these previously established expression signatures could possibly be epigenetically dysregulated due to DNA methylation. A number of candidate genes were re-expressed after 5-Aza-dC treatment, indicating that these genes undergo DNA methylation in respective GBM/GSCs subtypes.
A subset of PN tumors possesses extensive epigenetic alterations called glioma CpG island methylator phenotype (G-CIMP) [Citation10], for which the IDH1 mutation is a strong determinant [Citation26]. The PN and MES GSC lines used in this study are wild type for IDH1 with the exception of GSC 603, which shows a distinct epigenetic profile relative to the three major clusters [Citation7,Citation14,Citation15]. Thus, it is unlikely that our analysis contained a majority of G-CIMP+ samples. Additionally, we were not able to classify PN subtype samples into G-CIMP+ and G-CIMP- groups due to the small number of PN tumors available (n = 22 in TCGA GBM and n = 6 in GSCs). Therefore, the unique methylation patterns associated with the PN subtype may have included both G-CIMP+ and G-CIMP- tumors in TCGA GBM bulk tumors and GSCs. Similarly, we examined the methylation status of the MGMT promoter from our 450K array data in the 23 GSCs. We found that the MGMT promoter regions were methylated at various levels in all GSC lines with moderate variations in the CpG loci. Thus, the subtype-associated methylation signatures identified here are independent of MGMT promoter methylation.
In this study, we focused on a total of 21 genes of subtype-specific epigenetic signatures that commonly occur in GSCs and GBM bulk tumors. Of these, five genes are methylated in PN and 16 are methylated in MES subtypes (), Supplementary 4). Some of these genes have been studied in cancers including gliomas while others have not. For example, aberrations in DNA methylation of BACH2 have been reported in breast [Citation27] and gastric cancers [Citation28] but not in gliomas. CFLAR was previously found highly expressed in high-risk glioma patients compared to low-risk patients [Citation29]. OCIAD2 is one of the top-50 hypermethylated and downregulated genes in G-CIMP+ PN tumors [Citation10]. Midbrain nuclear protein (MIDN) is involved in the regulation of genes in the nucleolus during neurogenesis [Citation30]. MIDN was also described as a new glucokinase interaction partner in pancreatic beta cells, which binds and inhibits glucokinase when glucose levels are low [Citation31]. Transmembrane and coiled-coil domain family 1 (TMCC1) is an endoplasmic reticulum (ER) protein expressed in diverse types of human cells that interact with other ribosomal proteins with possible roles in ER organization [Citation32]. NOTCH1 is either oncogenic or tumor suppressive, based on cellular contexts and tumor types [Citation33]. Here, our data show that low levels of NOCTH1 correlate with poorer survival, suggesting that NOTCH1 functions as a tumor suppressor in glioma [Citation34]. Rho guanine nucleotide exchange factor 7 (ARHGEF7), also called β-Pix is a member of a family of guanine nucleotide exchange factor (GEF) activators of small GTP-binding proteins. ARHGEF7/6 (PIX) forms a regulatory node with GIT proteins that are GTPase activating proteins (GAP) for the ADP-ribosylation factor small GTP-binding proteins. The GIT-PIX node integrates numerous fundamental cellular processes through a wide variety of mechanisms, pathways, and signaling partners that are critical in various pathophysiological processes, including cancers [Citation35]. Potassium voltage-gated channel subfamily Q member 2 (KCNQ2) is a potassium voltage-gated channel protein, which is a critical determinant of neuronal excitability and regulates neuronal membrane potential [Citation36]. Additionally, our analysis also showed that PN- or MES-methylated genes are enriched in various molecular functions and biological pathways. These associated functions/pathways are unique to either GBM bulk tumors or GSCs, or are common to both of them.
Finally, we performed multivariate analyses on clinical prognoses utilizing four established clinical prognostic indicators, including age, gender, and TP53 and IDH1 mutations. Our analyses demonstrated that our candidate genes showed that the predictive values of the expression of these regulated genes for clinical outcomes were independent of these clinical indicators. Of note, since we focused on differentially methylated genes using samples that are IDH1 wild type (WT), the diagnostic analyses in this study are restricted to gliomas that are IDH1 WT, as defined by the World Health Organization (WHO) 2016 criteria [Citation37].
In conclusion, we identified tumor subtype-associated DNA methylation signatures that are unique to either GSCs or GBM bulk tumors, or are common to both of them. These signatures could regulate non-stem-like cells, stem-like cells, or both populations. These candidate marker genes correlate to their expression in respective subtypes and clinical prognosis of glioma patients. This is the first time that comprehensive methylation gene signatures have been reported that are unique to each subtype of GBM bulk tumors or GSCs, or common to both. Collectively, this study provides novel insights on tumor subtype-associated epigenetic regulation in GBM bulk tumors and GSCs.
Methods
Patient-derived glioma stem cell lines (GSCs) and cultures
A total of 23 patient-derived glioma stem cells (GSCs) were studied as previously described [Citation7,Citation14,Citation15] (Supplementary Table 1). GSCs were maintained in serum-free DMEM/F12 media supplemented with B27, EGF, FGF, heparin, and antibiotics (penicillin and streptomycin) at 37°C with 5% CO2 [Citation7].
Subtype classification of GBM and GSCs
Based on gene expression (transcriptomic) profiling, TCGA GBM bulk tumors are classified into four subtypes, PN, MES, N, and CL [Citation22]. Similarly, based on methylation profiling, GBM tumors are also classified into six clusters without further characterization[Citation23]. Therefore, we used the four clinically relevant pre-defined subtypes based on their gene expression[Citation22] to investigate methylation profiling of GBM bulk tumors and GSCs in this study. Based on pre-defined transcriptomic profiling [Citation7,Citation14,Citation15], of the 23 GSCs utilized in this study: six were PN, four were MES subtype, and the remaining 13 GSC lines were of unknown tumor subtype (Supplementary Table 1).
Microarray gene expression data
Gene expression data of GSCs generated from the Affymetrix Human Genome U219 array were used (GSE67089) [Citation7]. We identified differential methylation signatures that correlate with the corresponding gene expression in PN and MES GSCs. Fold-changes ≥1.5 in gene expression between PN and MES GSCs with P values <0.05 were considered significant. Gene expression array of GBM bulk tumors from TCGA dataset with pre-defined subtypes (PN, MES, CL, and N) were used (). The 450K array methylation data for GBM bulk tumors from TCGA were also downloaded and analyzed. This ensured that the comparison of methylation and expression data was done for the same panel of GBM bulk tumors.
Preparation of genomic DNA and RNA
Genomic DNA extraction from GSCs was performed using the Gentra Puragene Cell Kit (Qiagen). Briefly, cell pellets were lysed in 300 μl of the lysis buffer. Then, the lysate was mixed with 1.5 μl RNase A and 100 μl protein precipitation solution. The cell debris was removed by brief centrifugation. The supernatant containing DNA was mixed with isopropanol to precipitate DNA. The samples were processed further according to the manufacturer’s instructions. The RNeasy Mini Extraction Kit (Qiagen) was used to prepare RNA samples. Cell pellets were lysed in a lysis buffer containing β-mercaptoethanol. The samples were briefly centrifuged and the supernatant was mixed with 70% ethanol, transferred to RNeasy Mini spin column and processed further according to manufacturer’s instructions. DNA and RNA concentrations were determined using Nanodrop1000 (Thermo Fisher Scientific).
Illumina HumanMethylation450 BeadChip (450K) array and gene microarray data
A total of 23 GSCs (Supplementary Table 1) were used for the Illumina 450K array profiling that interrogates 485,577 CpG loci across the whole genome. The 450K array profiling was carried out at the NUSeq Core at Northwestern University. Chip processing was carried out according to manufacturer’s instructions. The signal intensities obtained from the Illumina GenomeStudio was converted to β-values and normalization was carried out to remove biases between the Infinium I and II probes. Probes on X- and Y-chromosomes were also removed. In order to preserve the biological variations on methylation profiles among different subtypes, no further normalization was performed [Citation38,Citation39]. For GBM bulk tumors, 450K array data from TCGA were used for PN (22), MES (29), N (13), and CL (29) subtype tumors (Supplementary Figure 1). Gene expression data of GSCs generated from the gene expression microarray were used (GSE67089) [Citation7]. To determine subtype-associated methylation in GSCs or GBM bulk tumors, transcriptomically pre-defined subtypes PN, MES, N, and CL were considered [Citation22].
To determine subtype-associated hypermethylation in GSCs or GBM bulk tumors, transcriptomically pre-defined subtypes PN, MES, N, and CL were considered [Citation22]. Only probes showing an average β-value ≥0.4 and β-value of ≥0.4 in 25% of the samples were considered as methylated, whereas probes with an average β-value of ≤0.3 and β-value ≤ 0.25 in 25% of the samples were considered as unmethylated. Subtype-associated hypermethylation signature probes were considered methylated in a specific subtype but unmethylated in the other subtypes (e.g., methylated in PN GSCs/GBM bulk tumors but unmethylated in others). Similarly, the subtype-associated hypomethylation was determined. In addition, differential methylation between PN and MES was determined. Probes with P <0.05 (Student’s t-test) were considered for further analyses.
Clustering and methylation-associated analyses
Unbiased hierarchical clustering between PN and MES GSCs was performed using Cluster 3 [Citation40]. We used a cut off β-value ≥0.4 across all samples, resulting in 5,062 CpG loci that are differentially methylated. Based on this clustering, 11,994 statistically significant (P <0.05, FDR corrected) and differentially methylated CpGs between PN and MES GSCs were generated. These CpGs were used to determine whether other GSCs with unknown subtype cluster together with known PN and MES GSC subtypes.
qRT-PCR
qRT-PCR was performed as previously described [Citation41]. Briefly, 20 μl in each PCR reaction contained 10 μl Power SYBR PCR Master Mix (Life Technologies), 1 μl each of forward and reverse primers, 1 μl cDNA template and nuclease-free water. Six hundred nanograms RNA was converted to cDNA using PrimeScript 1st strand cDNA Synthesis Kit (Takara) according to manufacturer’s instructions. For re-expression analyses, 4 PN and 4 MES GSCs were treated with 5-Aza-dC on alternate days for 5 days. The primers used for qRT-PCR for individual genes are shown in Supplementary Table 7.
Bisulphite sequencing
Bisulfite conversion of genomic DNA from GSC lines and positive controls was performed using the Epitect Bisulfite Kit (Qiagen). Briefly, 300 ng of genomic DNA isolated from respective GSCs was mixed with 85 μl bisulphite conversion reagent (bisulphite mix), 15 μl DNA protect buffer and RNase free water making a total volume of 140 μl. The samples were then processed according to manufacturer’s instructions. Genomic DNA samples were incubated with S-Adenosyl methionine (SAM) and DNA methyltransferase (New England Biolabs) for 2 h at 37°C to generate fully methylated positive controls prior to bisulfite conversion.
DNA methylation status of candidate genes in GSCs was determined by COBRA PCR products with BstU1 or TaqI enzymes (Fermentas) and/or by direct bisulphite sequencing at the Core Facility Center for Genetic Medicine, Northwestern University, using gel-purified PCR product. The COBRA PCR products were purified using QIAquick Gel Extraction Kit (Qiagen). Three to ten nanograms of gel-purified DNA and 1 μM primer for each sample was used for sequencing. Each sequencing reaction was carried out in triplicate samples.
The COBRA primers (Supplementary Table 7) were designed around each differentially methylated CpG(s). These primers contained additional CpGs that were not included in Illumina 450K array design. Primers were designed based on standard bisulphite DNA primer designing criteria [Citation42,Citation43] for amplifying bisulfite-converted DNA.
Analysis of methylation-associated molecular functions and biological processes
DAVID [Citation16] analysis was used to identify biological processes and pathways for candidate genes based on the Kyoto encyclopedia of genes and genomes (KEGG) [Citation44], protein analysis through evolutionary relationships (PANTHER), and Reactome databases[Citation45]. In addition, molecular functions of these genes were identified with the functional annotation tool from DAVID.
Survival analyses
Survival/Kaplan-Meier analyses [Citation41] using individual or multivariable factors/genes were performed using the publicly available gene expression omnibus (GEO) expression profiles, TCGA, Rembrandt [Citation20], and other databases by using online tools available at websites of Prognoscan [Citation17], PROGgeneV2 [Citation19], and Firebrowse (http://firebrowse.org/). A P value <0.05 was considered significant.
Statistical analyses
Statistical analyses were performed using the R Statistical Package[Citation46] and GraphPad Prism 6 (GraphPad Software). Paired two-sided Student’s t-test was used to compare between the groups/subtypes. A P value <0.05 was considered significant.
Ethics Statement
All the work related to GSCs was conducted in this study under institutional review board (IRB)-approved protocols approved at Northwestern University in Chicago, IL, USA. All patients were informed of consent before these GSC lines were established 7, 14, 15. All the work that involves RNA and DNA was conducted in this study under institutional biosafety committee (IBC)-approved protocols approved at Northwestern University in Chicago, IL, USA.
Consent for publication
All authors have read, edited, and approved the manuscript. They also provided their consents for publication of this study.
Availability of Data and Material
Data of the microarray gene expression were previously deposited at the GEO under an accession number of GSE670897.
Data of 450 DNA methylation arrays of GSCs have been deposited at the GEO under an accession number of GSE90498.
Author Contributions
S.-Y.C., and W.Z. conceived, designed, and supervised this study. R.P.P. coordinated the experimental design and development of this study, performed experiments and drafted the manuscript. R.P.P., Z.Z., X. Wan, and S. Lu carried out the data analyses and provided statistical inputs. T.S. prepared DNA samples for 450K methylation array analyses. A.A.A. and N.S. edited the manuscript and provided intellectual inputs. R.P.P., N.S., and C.X.L. performed experiments. B.H., D.J., T.H, M.S.L., J.K., C.W.B., X.L., and I.N. provided intellectual inputs. All authors have read, edited, and approved the manuscript.
Competing Interests
The authors declare no competing financial interests.
Supplemental Material
Download Zip (6.9 MB)Disclosure statement
No potential conflict of interest was reported by the authors.
Supplementary material
Supplemental data for this article can be accessed here.
Additional information
Funding
Related Research Data
References
- Wen PY, Kesari S. Malignant gliomas in adults. N Engl J Med. 2008;359:492–507.
- Chinot OL, Wick W, Mason W, et al. Bevacizumab plus radiotherapy-temozolomide for newly diagnosed glioblastoma. N Engl J Med. 2014;370:709–722.
- Osuka S, Van Meir EG. Overcoming therapeutic resistance in glioblastoma: the way forward. J Clin Invest. 2017;127:415–426.
- Wick W, Weller M, van den Bent M, et al. MGMT testing–the challenges for biomarker-based glioma treatment. Nat Rev Neurol. 2014;10:372–385.
- Sanson M, Marie Y, Paris S, et al. Isocitrate dehydrogenase 1 codon 132 mutation is an important prognostic biomarker in gliomas. J Clin Oncol. 2009;27:4150–4154.
- Lathia JD, Mack SC, Mulkearns-Hubert EE, et al. Cancer stem cells in glioblastoma. Genes Dev. 2015;29:1203–1217.
- Mao P, Joshi K, Li J, et al. Mesenchymal glioma stem cells are maintained by activated glycolytic metabolism involving aldehyde dehydrogenase 1A3. Proc Natl Acad Sci U S A. 2013;110:8644–8649.
- De Bacco F, Casanova E, Medico E, et al. The MET oncogene is a functional marker of a glioblastoma stem cell subtype. Cancer Res. 2012;72:4537–4550.
- Laks DR, Crisman TJ, Shih MY, et al. Large-scale assessment of the gliomasphere model system. Neuro Oncol. 2016;18:1367–1378.
- Noushmehr H, Weisenberger DJ, Diefes K, et al. Identification of a CpG island methylator phenotype that defines a distinct subgroup of glioma. Cancer Cell. 2010;17:510–522.
- Allis CD, Jenuwein T. The molecular hallmarks of epigenetic control. Nat Rev Genet. 2016;17:487–500.
- Baylin SB, Jones PA. A decade of exploring the cancer epigenome - biological and translational implications. Nat Rev Cancer. 2011;11:726–734.
- Shenker N, Flanagan JM. Intragenic DNA methylation: implications of this epigenetic mechanism for cancer research. Br J Cancer. 2012;106:248–253.
- Rohle D, Popovici-Muller J, Palaskas N, et al. An inhibitor of mutant IDH1 delays growth and promotes differentiation of glioma cells. Science. 2013;340:626–630.
- Srikanth M, Das S, Berns EJ, et al. Nanofiber-mediated inhibition of focal adhesion kinase sensitizes glioma stemlike cells to epidermal growth factor receptor inhibition. Neuro Oncol. 2013;15:319–329.
- Huang D, Sherman BT, Lempick RA. Systematic and integrative analysis of large gene lists using DAVID bioinformatics resources. Nat Protoc. 2008;4:44–57.
- Mizuno H, Kitada K, Nakai K, et al. PrognoScan: a new database for meta-analysis of the prognostic value of genes. BMC Med Genomics. 2009;2:18.
- Goswami CP, Nakshatri H. PROGgene: gene expression based survival analysis web application for multiple cancers. J Clin Bioinforma. 2013;3:22.
- Goswami CP, Nakshatri H. PROGgeneV2: enhancements on the existing database. BMC Cancer. 2014;14:970.
- Madhavan S, Zenklusen JC, Kotliarov Y, et al. Rembrandt: helping personalized medicine become a reality through integrative translational research. Mol Cancer Res. 2009;7:157–167.
- Phillips HS, Kharbanda S, Chen R, et al. Molecular subclasses of high-grade glioma predict prognosis, delineate a pattern of disease progression, and resemble stages in neurogenesis. Cancer Cell. 2006;9:157–173.
- Verhaak RG, Hoadley KA, Purdom E, et al. Integrated genomic analysis identifies clinically relevant subtypes of glioblastoma characterized by abnormalities in PDGFRA, IDH1, EGFR, and NF1. Cancer Cell. 2010;17:98–110.
- Ceccarelli M, Barthel FP, Malta TM, et al. Molecular profiling reveals biologically discrete subsets and pathways of progression in diffuse glioma. Cell. 2016;164:550–563.
- Bonavia R, Inda MM, Cavenee WK, et al. Heterogeneity maintenance in glioblastoma: a social network. Cancer Res. 2011;71:4055–4060.
- Patel AP, Tirosh I, Trombetta JJ, et al. Single-cell RNA-seq highlights intratumoral heterogeneity in primary glioblastoma. Science. 2014;344:1396–1401.
- Turcan S, Rohle D, Goenka A, et al. IDH1 mutation is sufficient to establish the glioma hypermethylator phenotype. Nature. 2012;483:479–483.
- Flower KJ, Shenker NS, El-Bahrawy M, et al. DNA methylation profiling to assess pathogenicity of BRCA1 unclassified variants in breast cancer. Epigenetics. 2015;10:1121–1132.
- Haam K, Kim HJ, Lee KT, et al. Epigenetic silencing of BTB and CNC homology 2 and concerted promoter CpG methylation in gastric cancer. Cancer Lett. 2014;351:206–214.
- Shukla S, Pia Patric IR, Thinagararjan S, et al. A DNA methylation prognostic signature of glioblastoma: identification of NPTX2-PTEN-NF-kappaB nexus. Cancer Res. 2013;73:6563–6573.
- Tsukahara M, Suemori H, Noguchi S, et al. Novel nucleolar protein, midnolin, is expressed in the mesencephalon during mouse development. Gene. 2000;254:45–55.
- Hofmeister-Brix A, Kollmann K, Langer S, et al. Identification of the ubiquitin-like domain of midnolin as a new glucokinase interaction partner. J Biol Chem. 2013;288:35824–35839.
- Brennan CW, Verhaak RG, McKenna A, et al. The somatic genomic landscape of glioblastoma. Cell. 2013;155:462–477.
- Lobry C, Oh P, Aifantis I. Oncogenic and tumor suppressor functions of Notch in cancer: it’s NOTCH what you think. J Exp Med. 2011;208:1931–1935.
- Brat DJ, Verhaak RG, Aldape KD, Cancer Genome Atlas Research N; et al. Comprehensive, integrative genomic analysis of diffuse lower-grade gliomas. N Engl J Med. 2015;372:2481–2498.
- Zhou W, Li X, Premont RT. Expanding functions of GIT Arf GTPase-activating proteins, PIX Rho guanine nucleotide exchange factors and GIT-PIX complexes. J Cell Sci. 2016;129:1963–1974.
- Taylor KC, Sanders CR. Regulation of KCNQ/Kv7 family voltage-gated K+ channels by lipids. Biochim Biophys Acta. 2017;1859:586–597.
- Louis DN, Perry A, Reifenberger G, et al. The 2016 World Health Organization classification of tumors of the central nervous system: a summary. Acta Neuropathol. 2016;131:803–820.
- Pidsley R, Chloe CY, Volta M, et al. A data-driven approach to preprocessing Illumina 450K methylation array data. BMC Genomics. 2013;14:293.
- Laird PW. Principles and challenges of genomewide DNA methylation analysis. Nat Rev Genet. 2010;11:191–203.
- de Hoon MJ, Imoto S, Nolan J, et al. Open source clustering software. Bioinformatics. 2004;20:1453–1454.
- Huang T, Alvarez AA, Pangeni RP, et al. A regulatory circuit of miR-125b/miR-20b and Wnt signalling controls glioblastoma phenotypes through FZD6-modulated pathways. Nat Commun. 2016;7:12885.
- Clark SJ, Harrison J, Paul CL, et al. High sensitivity mapping of methylated cytosines. Nucleic Acids Res. 1994;22:2990–2997.
- Pangeni RP, Channathodiyil P, Huen DS, et al. The GALNT9, BNC1 and CCDC8 genes are frequently epigenetically dysregulated in breast tumours that metastasise to the brain. Clin Epigenetics. 2015;7:57.
- Kanehisa M, Goto S. KEGG: kyoto encyclopedia of genes and genomes. Nucleic Acids Res. 2000;28:27–30.
- Fabregat A, Sidiropoulos K, Garapati P, et al. The reactome pathway knowledgebase. Nucleic Acids Res. 2016;44:D481–7.
- RDevelopmentCoreTeam. A language and environment for statistical computing. Vienna: The R Foundation for Statistical Computing; 2011.