
ABSTRACT
Histone posttranslational modifications (PTMs) help regulate DNA templated processes; however, relatively little work has unbiasedly explored the single-molecule combinations of histone PTMs, their dynamics on short timescales, or how these preexisting histone PTMs modulate further histone modifying enzyme activity. We use quantitative top down proteomics to unbiasedly measure histone H4 proteoforms (single-molecule combinations of PTMs) upon butyrate treatment. Our results show that histone proteoforms change in cells within 10 minutes of application of sodium butyrate. Cells recover from treatment within 30 minutes after removal of butyrate. Surprisingly, K20me2 containing proteoforms are the near-exclusive substrate of histone acetyltransferases upon butyrate treatment. Single-molecule hierarchies of progressive PTMs mostly dictate the addition and removal of histone PTMs (K16ac > K12ac ≥ K8ac > K5ac, and the reverse on recovery). This reveals the underlying single-molecule mechanism that explains the previously reported but indistinct and unexplained patterns of H4 acetylation. Thus, preexisting histone PTMs strongly modulate histone modifying enzyme activity and this suggests that proteoform constrained reaction pathways are crucial mechanisms that enable the long-term stability of the cellular epigenetic state.
Introduction
The nucleosome is comprised of a histone octamer and approximately 147 bp of DNA and is the basic unit of chromatin [Citation1]. Histone octamers contain two copies from each of the core histone families: H2A, H2B, H3, and H4. Each histone family has multiple closely related sequence variants, except histone H4, which exists as one unique sequence without variation across most eukaryotes. Each core histone has a basic N-terminal tail that contains dense sites of variable, and abundantly occupied, posttranslational modification (PTM) [Citation2]. Numerous histone PTMs, including acetylation (ac), methylation (me), and phosphorylation (ph), have been identified on the N-terminal tails of each histone [Citation3–Citation5]. The PTMs of histone H4 are well studied but somewhat enigmatic and mostly without strongly predictive one-to-one correlations to biological output.
Histone modifications regulate DNA-dependent processes by recruitment of regulatory proteins and modulation of chromatin structure [Citation6]. For example, acetylated histones are well accepted as an active marker of gene transcription since the middle of the last century [Citation7,Citation8]. It is, however, important to distinguish causation from correlation and necessary from sufficient. Histone acetylation is necessary but not sufficient for active transcription. Histone acetylation can directly affect chromatin structure by neutralizing the positive charges on the side chain of lysine, thus disrupting histone-DNA interaction; however, most evidence points to a limited regulatory role for such biophysical mechanisms. In one example of this biophysical phenomena, it has been shown that H3K56ac facilitates ‘DNA breathing’ in this manner [Citation9].
The single-molecule coexistence of PTMs is a fundamental mechanism of biology that often transduces different information than the same PTMs on separate molecules. For example, H3K9me3, a repressive marker, recruits HP1 to maintain heterochromatin regions [Citation10–Citation12], while coexistence of H3S10ph on the same molecule abolishes this recruitment [Citation13]. However, many of these findings that have proven proteoform (single-molecule combinations of PTMs) mechanisms have done so with only binary combinations of PTMs and with a bias toward the PTMs selected for study. Here we explore the single-molecule mechanisms of acetylation on histone H4 upon butyrate treatment with unbiased quantitative methods that reveal mechanisms important to the regulation of eukaryotic genomes. Ultimately, it will be impossible to fully understand chromatin without quantitation of bona fide single-molecule PTM combinations.
Histone PTMs are ‘written’ and ‘erased’ by enzymes with site specificity that is often incompletely characterized. Histone acetyltransferases (HAT), many of which are conserved from yeast to human, are required for histone acetylation [Citation14]. The first two HATs, Hat1, and Gcn5, were identified in Saccharomyces cerevisiae over 20 years ago, yet the substrate specificity of HATs is still not fully understood [Citation15,Citation16]. Single HAT enzymes are often reported to modify multiple histone substrates at multiple sites. For example, the previous literature suggests that p300 preferentially modifies H3K14ac, H3K18ac, H4K5ac, and H4K8ac [Citation17,Citation18]. However, essentially all previous studies have inherently focused on discrete histone PTMs, ignoring the presence of abundant preexisting PTMs on available substrates. Thus, preceding the work here, it was not clear if these pre-existing histone PTMs affect enzyme specificity, although superficial patterns suggestive of this have been previously noted. Histone acetylation is removed by histone deacetylases (HDAC), which are highly conserved across eukaryotes [Citation19]. Eighteen human HDACs have been identified and categorized into four classes [Citation20]. HDACs are not only essential to modulating the abundance of histone acetylation but also indirectly modulate other histone PTMs. HDACs are sometimes found in complexes with histone demethylases, thus indirectly modulating histone methylation [Citation21,Citation22].
Epigenetic therapies provide an innovative and promising approach to the treatment of various diseases [Citation23]. Dysregulation of histone PTMs contributes to many diseases [Citation24–Citation26]. Epigenetic inhibitors modulate the activity of enzymes associated with histone PTMs, thus regulating the abundance of histone PTMs. The use of combinations of epigenetic therapies is emerging as a potentially powerful strategy [Citation27,Citation28]. Other work in our laboratory shows that the order and the timing of the application of combinatorial epigenetic therapies may have profound effects on the biochemical outcome of the treatment regime at the molecular level. The combined effects are not simply a superposition but a function of more complex single-molecule level mechanisms, which we interrogate here.
A small set of recent works have suggested that cells respond to epigenetic treatment rapidly. It has been shown in a single paper years ago that histone H4 acetylations increase in as quickly as 8 minutes after butyrate application in human cells (MCF7 cells) [Citation29]. In yeast, deacetylation and acetylation can occur within minutes as well [Citation30]. However, all these works focused on the superficial abundance of discrete histone PTMs, not the underlying physiologically present proteoforms and their single-molecule combinations. These rapid changes to histone PTM abundances likely affect all DNA dependent process at a similar timescale. Indeed, it has been shown that gene transcription is affected after only 30 minutes post butyrate application [Citation31].
Histone PTMs have been shown to occur in specific progressive orders and hierarchies. Superficial patterns in the change in abundance of H4 acetylations have been previously noted at 4 hours after butyrate application [Citation32]. We reveal here that this is indeed realized at the single-molecule level, identifying specific mechanisms by which this occurs, and the early dynamics of this hierarchy are explored here for the first time. We show that the presence of preexisting H4 PTMs on single molecules is the primary mechanism of the underlying superficially described pattern of H4 acetylations observed after butyrate application.
Top down proteomics is the unique solution for detection of histone proteoforms (PTM combinations on single molecules). Decades ago, antibody-based assays were developed to detect histone PTMs and are now ubiquitous [Citation24,Citation33]. However, these approaches suffer from multiple shortcomings, such as epitope occlusion and a limited capacity to distinguish methylation states or to place multiple PTMs on single molecules. Bottom up proteomics methods detect and localize histone PTMs precisely but cannot determine if distal histone PTMs co-exist on single molecules [Citation34–Citation37]. In bottom up proteomics the sample is typically digested with trypsin, thus obliterating any single-molecule connectivity between distal PTMs that exist on the same single molecule prior to mass spectrometric analysis. This allows for the localization of each PTM to a specific site in a protein through its surrogate peptide but never the co-localization of two PTMs from separate peptides onto the same protein molecule. It remains ambiguous if two such PTMs co-exist on the same molecule, are mutually exclusive and never co-occur, or a mixture of co-occurrence and exclusion. Conversely, in top down proteomics the intact protein is introduced into the mass spectrometer and then sequenced in the gas phase from end to end, thus unambiguously proving and in this case quantitatively measuring the co-existence of distal PTMs on single molecules. We have developed a quantitative top down proteomic method that quantitatively measures intact proteoforms and thus the definitive coexistence of PTMs on single molecules. Thus, we directly and unbiasedly measure single-molecule combinations of PTMs. With this multi-level nuanced data, a notation that distinguishes each level of detail discussed is imperative for clear and precise communication of results. The “<>“ notation indicates a proteoform that contains only the PTMs within the angle braces and all other sites of variable modification are definitively unoccupied. Discrete PTMs, described simply as PTMs in the prevailing literature, are indicated by a ‘{}’ notation. Binary combinations of PTMs, as well as higher order combinations, are also denoted by ‘{}’ brackets. More details about notation are available in the method section. Throughout this work we express abundances as a percentage of the total histone H4 present in the cells at whatever level or dimension we are operating. Unlike antibody-based approaches where PTMs cannot be properly normalized, our approach allows for direct quantitative comparison across multiple PTMs, combinations of PTMs, and proteoforms.
Our current work quantitatively and unbiasedly measures histone proteoforms on histone H4 by use of top down proteomics and reveals that the widely used HDAC inhibitor sodium butyrate results in immediate changes to histone H4 PTMs and remarkably specific proteoforms. Butyrate is a short-chain fatty acid and inhibits a broad but not universal range of HDAC activity [Citation29]. Butyrate also serves as a carbon source and can be oxidized to acetyl-CoA, thereby contributing to the increase of acetylation [Citation38].
We show that histone acetylations increase immediately and that the previously unexplained patterns observed by other approaches are due to a progressive single-molecule hierarchy of a remarkably narrow and specific set of proteoforms. Histone acetylations also return to basal conditions rapidly in the reverse hierarchical order after removal of butyrate. Astonishingly, these early increases in acetylation occur exclusively on molecules containing a preexisting H4{K20me2} modification in cells. Each progressive acetylation occurs near exclusively on molecules with the previous acetylation in the hierarchy. Overall, we show that histone PTMs are dynamic, hierarchical, and written and removed in a proteoform specific manner. Our results reveal the single-molecule level mechanism of previously observed superficially apparent abundance hierarchy of H4 acetylation. Such extraordinarily specific proteoform-level mechanisms suggest an evolved utility and that continued proteoform-level analysis is required for a complete understanding of the chromatin regulation system.
Results
The basal level of H4 PTMs and proteoforms in SUM159 and MCF7 cells
SUM159 and MCF7 cells have very similar abundances of discrete H4 PTMs with a few exceptions (). In both cell lines, the most abundant discrete acetylation, other than the near constitutive N-terminal acetylation (Nα-ac), is H4{K16ac} (~40% of histone H4 molecules carry this mark). The most abundant methylation is H4{K20me2} (60–70%). Consistent with this abundance, previous work has shown extremely broad genomic localization of this PTM [Citation39]. Very low abundance (<1%) PTMs are also measured with high confidence, such as H4{S1ph} (0.2%) and {R3me1} (0.2%). The relative precision of the measurements[Citation40] over a wide range of abundances enables the detection of relatively small differences.
Table 1. Relative abundance of discrete H4 PTMs in SUM159 and MCF7 cells. Histone PTMs vary greatly in abundance, requiring quantitative methods to effectively study their function. Error represents the standard error from three biological replicates.
Approximately 200 different H4 proteoforms are identified in both cells with a wide range of abundances (Supplemental Table 1 and 2). The most abundant proteoform contains only the two most abundant PTMs: Nα-ac and K20me2 (i.e., H4<Nα-acK20me2>) (~40%), followed by H4<Nα-acK16acK20me2> (~25%). Only ~0.02% of H4 molecules in both cell lines exist as the proteoform with all sites of variable modification occupied to some degree (H4<Nα-acS1phR3me1K5acK8acK12acK16acK20me2K31ac>). This has not been observed by previous methods and suggests an extensive network of interactions between PTMs. The abundance of the proteoform that only contains N-terminal acetylation (H4<Nα-ac>) is ~5%. Conceptually important to a proper understanding of the substrates available to enzymes, completely unmodified H4 molecules are not observed in either cell line. Thus, in vitro enzymology studies of histone H4 are often performed on non-physiological substrates. Use of physiologically relevant substrates in future work should enhance our understanding of epigenetic enzymes and chromatin function.
Cells respond to butyrate rapidly, resulting in increased discrete H4 acetylations
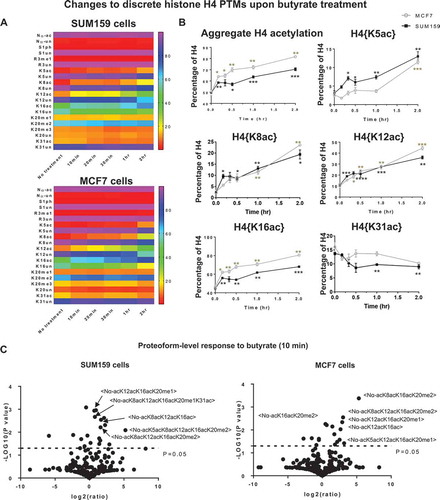
Histone H4 acetylation increases immediately upon butyrate application ( (Supplemental Table 3). Aggregate H4 acetylation increases within 10 minutes after butyrate application. Similar to a pan-acetyl antibody-based measurement, aggregate H4 acetylation is the percentage of H4 molecules containing at least one Nε-acetyl lysine following butyrate treatment. Discrete H4{K8ac}, {K12ac}, and {K16ac}, similar to site-specific antibodies, all increase within 10 minutes. H4{K5ac} increases more slowly and is not affected until 20 minutes SUM159 cells and 2 hours in MCF7 cells. These changes are specific as neither H4{K31ac} nor H3{K9ac} are affected at any time point as might be expected if driven by increased acetyl-CoA. Overall, discrete H4 acetylations increase immediately.
Hyperacetylated proteoforms immediately increase upon butyrate treatment
Hyperacetylated proteoforms (molecules containing two or more Nε-acetyl lysines) increase rapidly and represent most of the increase in acetylation. The number of proteoforms significantly affected by butyrate are plotted in Figure S1. In SUM159 cells, 19 proteoforms are significantly affected 10 minutes after butyrate application (P <0.05). Among these 19 proteoforms 13 are increased and 11 of those are hyperacetylated (~85%) (, left panel) (Supplemental Table S4). For example, <Nα-acK5acK8acK12acK16acK20me2> increases from 0.05 ± 0.01% to 1.75 ± 0.02% (a 35-fold increase). This is consistent with all discrete H4 acetylations, except H4{K31ac}, increasing immediately upon butyrate application. The increase in hyperacetylated proteoforms results in an obligate decrease in hypoacetylated proteoforms. For example, <Nα-ac> decreases from 5.16 ± 0.08% to 3.67 ± 0.11%. MCF7 cells are very similar. 17 proteoforms are significantly affected after 10 minutes of treatment (P <0.05) (,right panel) (Supplemental Table S5). Moderately acetylated proteoforms, the intermediate products of acetyltransferases, dramatically increase during this period. <Nα-acK16acK20me2> increases by 9.06 percentage points (from 23.86 ± 0.10% to 32.92 ± 0.71%), and is the most increased proteoform by abundance (P = 0.005). This change results in the dramatic decrease of <Nα-acK20me2> (from 37.50 ± 2.00% to 26.56 ± 0.58%) (P = 0.02). Overall, hypoacetylated proteoforms are rapidly converted to hyperacetylated proteoforms.
Figure 1. Cells respond to butyrate treatment immediately. (A) Heatmap of the effect of butyrate application on all discrete PTMs (irrespective of other coexisting PTMs) in SUM159 and MCF7 cells. (B) The effects of butyrate on all discrete H4 acetylations in SUM159 and MCF7 cells (C) Volcano plot of proteoform (combinations of PTMs at the single-molecule level) changes due to 10 min butyrate application in SUM159 cells (left panel) and in MCF7 cells (right panel). Error bars in B represent standard error from three biological replicates and all statistics are relative to basal conditions (time 0).
H4 PTMs recover rapidly after removing butyrate
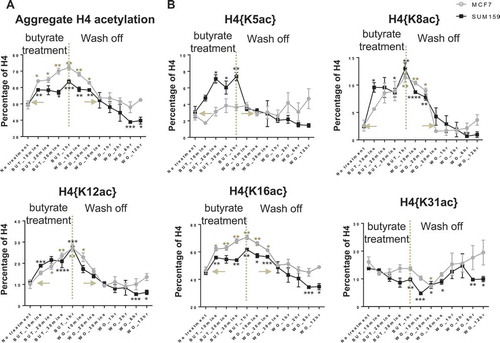
Discrete H4 acetylations return to basal levels within minutes after removal of butyrate. The aggregate acetylation recovers within 30 minutes and continues decreasing 1 hour after removal of butyrate in both cell lines (Figure 2(a)). All discrete acetylations recover in 10–30 minutes (). Thus, cells exhibit a previously unknown capacity to recover from epigenetic perturbations with extraordinary speed.
Figure 2. Cells recover rapidly after removal of butyrate. (A) The aggregate level of H4 acetylation and (B) discrete H4 acetylations recover within 30 min after removal of butyrate. Error bars represent standard error from three biological replicates and all statistics are relative to basal conditions (time 0).
Early increased acetylations are near-exclusively in combination with K20me2
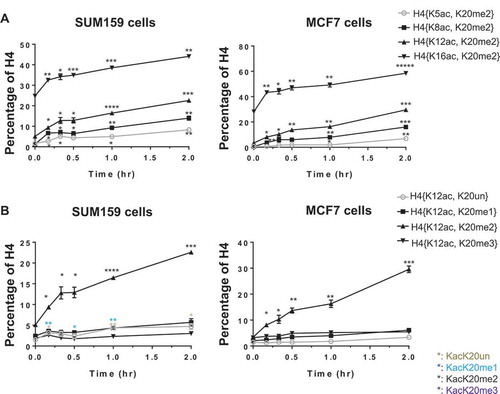
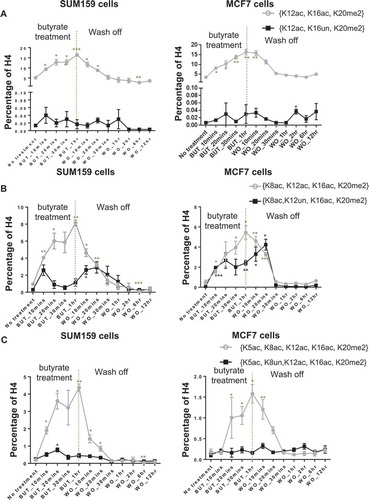
The increase of H4 acetylations during the early response to butyrate are primarily on molecules containing preexisting K20me2. The single-molecule binary combinations, H4{K5ac, K20me2}, {K8ac, K20me2}, {K12ac, K20me2}, and {K16ac, K20me2}, continually increase post-butyrate application in both cell lines (Figure 3(a)). Acetylation does not increase on molecules with H4K20un, K20me1, or K20me3, indicating that molecules with preexisting H4K20un, K20me1, or K20me3 are entirely excluded from the acetyltransferase activity after butyrate treatment (Figure S2). Taking H4{K12ac, K20me2} as a compelling example, the basal abundance of H4{K12ac, K20me2} is similar to H4{K12ac, K20un}, {K12ac, K20me1}, and {K12ac, K20me3} in both cell lines (). However, only H4{K12ac, K20me2} is increased by as much as 7-fold after butyrate treatment while H4{K12ac, K20un}, {K12ac, K20me1}, and {K12ac, K20me3} are unchanged. A similar trend is observed for H4{K5ac, K20me2}, {K8ac, K20me2}, and {K16ac, K20me2}, as shown in Figure S2. Furthermore, proteoforms containing K20me2 and multiple acetylations increase most dramatically after butyrate application. In SUM159 cells, the top two most increased proteoforms contain K20me2: <Nα-acK5acK8acK12acK16acK20me2> is increased the most (from 0.05 ± 0.01% to 1.75 ± 0.02%) and is followed by <Nα-acK8acK12acK16acK20me2> (from 0.64 ± 0.02% to 1.94 ± 0.11%) (, left panel) (Supplemental Table 4). In MCF7 cells, proteoforms containing K20me2 and acetylation increase by an aggregate 15.73 percentage points (from 26.18 ± 0.39% to 41.91 ± 1.34%), compared to 2.34 percentage points increase in proteoforms not containing K20me2 (from 2.32 ± 0.11% to 4.79 ± 0.07%) (, right panel) (Supplemental Table 5). To determine whether the increase of acetylated and dimethylated molecules was caused by an increase in acetylation or methylation, we also examined the percentage of different methylated H4K20 and found that the level of methylation did not change significantly (Figure S3). Preliminary observation of the same specificity in a third cell line (T47D cells) suggests this is a common, most likely general phenomenon (Figure S6A). Thus, acetylation, but not methylation, is responsible for the increase in acetylated and dimethylated molecules. Overall, this data shows for the first time that early increased acetylation occurs almost exclusively in combination with H4K20me2.
Figure 3. Early increases in H4 acetylation are specifically in combination with H4K20me2. (A) Single-molecule binary combinations containing H4K20me2 and acetylation increase upon treatment. (B) H4K12ac only increases in the presence of K20me2, and not with other K20 methylation states, despite having similar single-molecule binary combination initial abundances. All increases in acetylation (K5ac, K8ac, K12ac, K16ac) are near-exclusively in combination with H4K20me2 (Figure S2). Error bars in A, B represent standard error from three biological replicates and all statistics are relative to basal conditions (time 0).
Discrete histone acetylation increases in a specific progressive and hierarchical order upon butyrate application
The substantial difference in basal abundance of H4 acetylations and the amount of change observed upon butyrate treatment is suggestive of a hierarchical order. In the abundance order of K16ac > K12ac > K8ac ≥ K5ac is readily apparent. The absolute change upon butyrate treatment is also consistent with this hierarchy (). This apparent hierarchy has been noted many times before; however, the observation of this hierarchy at the discrete level does not yield mechanistic insight as to how this hierarchy arises nor provide any more than a correlative observation. Here we reveal for the first time the single molecular mechanism by which this arises.
H4 acetylations increase in a hierarchical manner at the single-molecule level
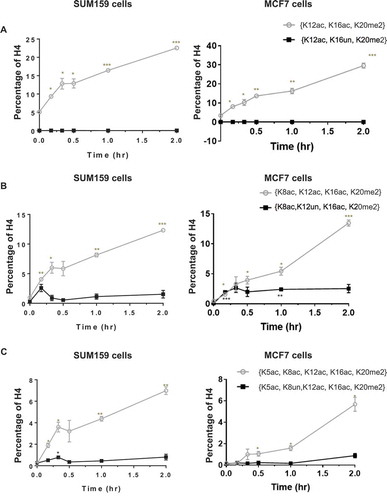
H4 acetylations increase in a hierarchical manner at the single-molecule level and specifically in combination with K20me2. Having established that the H4 acetylations exhibit an abundance (discrete-level) hierarchy and that increased acetylation is near exclusive to molecules with preexisting K20me2, we next prove that the acetylation hierarchy is indeed a single-molecule (proteoform-level) hierarchy. Furthermore, this is exclusively in combination with K20me2. For a proteoform to be dynamically increasing upon butyrate application, K20me2 is required for K16ac and both K20me2 and K16ac are required for K12ac. A similar progressive dependency continues for K8ac and K5ac. For example, the single-molecule ternary combination H4{K12ac, K16ac, K20me2} responds to butyrate rapidly, while H4{K12ac, K16un, K20me2} does not increase (). This indicates that the increase of H4K12ac is dependent on K16ac and K20me2. The dynamics of H4{K8ac, K12ac, K16ac, K20me2} and {K8ac, K12un, K16ac, K20me2} () also indicate that the increase of H4K8ac is largely dependent on H4K12ac (as well as K16ac and K20me2); although some non-K12ac dependent acetylation of K8 is apparent at 10–20 minutes. Similarly, H4{K5ac, K8ac, K12ac, K16ac, K20me2} and {K5ac, K8un, K12ac, K16ac, K20me2} () show that H4K5ac increases only in the presence of K8ac (as well as K12ac, K16ac and K20me2). Acetylation increases near exclusively in the presence of H4K20me2 and in a specific hierarchical order at the single-molecule level (H4K16ac>K12ac≥K8ac>K5ac), with the exception that K8ac may precede K12ac for a minority population of molecules.
Figure 4. Histone acetylations occur in a progressive hierarchical order at the single-molecule level. (A) H4K12ac is dependent on H4K16ac; (B) H4K8ac is mostly dependent on H4K12ac; (C) H4K5ac is dependent on H4K8ac. These changes are thus highly proteoform specific, requiring H4K20me2 and a series of prior acetylations. Error bars represent standard error from three biological replicates and all statistics are relative to basal conditions (time 0).
Single-molecule H4 PTMs recover in reverse-hierarchical order after removal of butyrate
H4 acetylations recover in the reverse-hierarchical order and near exclusively in combination with K20me2 at the single-molecule level. We show that the hierarchical order of H4 acetylations is preserved at the single-molecule level specifically with H4K20me2 during the deacetylation process (Figure S4A and B). H4{K12ac, K16ac, K20me2} recovers quickly upon removal of butyrate, while H4{K12ac, K16un, K20me2} is not affected (). This indicates that ‘erasing’ of H4K12ac occurs in the presence of K16ac (and K20me2). Similarly, indicates that the recovery of H4K8ac mostly occurs in the presence of K12ac; however, H4K12ac may also be removed prior to the removal of K8ac. This partial relaxation between H4K8ac and K12ac also appears in the acetylation hierarchy (). This is apparent in the transient increases of H4{K8ac, K12un, K16ac, K20me2} on both the uphill and downhill slopes of H4{K8ac, K12un, K16ac, K20me2}, before the other site is added or removed. suggests that removal of H4K5ac is strongly dependent on K8ac. Overall, this evidence shows that the recovery pattern of H4 acetylations in the presence of K20me2 is K5ac > K8ac ≥ K12ac > K16ac at the single-molecule level.
Figure 5. Histone acetylations are removed in a hierarchical order at the single-molecule level. (A) Removal of H4K12ac depends on H4K16ac; (B) removal of H4K8ac partially depends on H4K12ac; (C) removal of H4K5ac depends on H4K8ac. This hierarchy upon recovery is remarkably symmetric to the progressive acetylation hierarchy observed during treatment. Error bars represent standard error from three biological replicates and all statistics are relative to basal conditions (time 0).
Discussion
The early dynamics of discrete H4 acetylations in response to butyrate treatment and the deacetylation upon recovery have never been explored at the single-molecule proteoform-level. Previous work has suggested that the early dynamics may be important to biological function. Here, we employ quantitative top down proteomics to analyze the dynamics of histone H4 acetylations and proteoforms thereof in two breast cancer cell lines upon butyrate treatment and recovery. We unbiasedly quantitate discrete H4 PTMs and all single-molecule combinations of H4 PTMs as cells respond to and then recover from butyrate treatment. We show that acetylation occurs in a hierarchical order at the single-molecule level and is exclusive to H4K20me2 containing substrates in living cells. Our data provide unprecedentedly specific details on histone PTMs dynamics and cellular enzyme substrate specificity at the proteoform level.
Cells respond to epigenetic perturbation rapidly
Most histone H4 acetylations are extremely dynamic! Cells respond and recover immediately to butyrate treatment. All discrete H4 acetylations, except H4{K31ac}, are significantly increased within 10 minutes post-treatment (). Hyperacetylated proteoforms also significantly increase on the same time scale (). Collectively this evidence suggests that cells respond to butyrate immediately, in agreement with sparse but conclusive previous results [Citation29,Citation31]
Cells recover to basal conditions rapidly after removal of butyrate. Total H4 acetylation, as well as all discrete H4 acetylations, recover within 30 minutes. Note that some discrete H4 acetylations progress below the basal level after removal of butyrate treatment. Oscillations that overshoot and then asymptotically approach the equilibrium point are typical in non-steady state chemical equilibria. There may be additional dynamics, such as increased accessibility due to structural changes to the chromatin upon hyperacetylation. This rapid recovery is surprising and has wide implications to both fundamental chromatin regulation and how epigenetic modulators should be administered in the clinic.
Not all discrete acetylation levels are affected rapidly. As we mentioned above, H4{K31ac} does not significantly increase even after 2 hours of buty-rate treatment. Similarly, H3.1{K9ac} remains at the same level during this timescale of butyrate treatment (Figure S5). Thus, not all acetylations respond to butyrate treatment on this timescale, suggesting different roles in chromatin regulation. The H4 acetylations that change quickly likely play an important role in dynamic regulatory processes.
Early increases in H4 acetylation are due to the inhibitory effects of butyrate on HDAC. Butyrate can be oxidized to acetyl-CoA, and thus might contribute to increased histone acetylation by a second pathway independent of its direct inhibition of HDACs [Citation38].
However, this process is slower than the timescale here. Furthermore, if total acetyl-CoA is increased all histone acetylations should increase. However, H4{K31ac} and H3.1{K9ac} are not affected by butyrate treatment ( and S5). This indicates that the rapid increase of histone acetylation is due to the direct inhibition of HDACs.
Overall, our results suggest that, contrary to the prevailing dogma, chromatin is regulated in a very dynamic manner. Histone PTMs can be ‘written’ or ‘erased’ essentially immediately after perturbation of the system. This indicates that the balance of histone modifying enzymes and histone PTMs is critical. Thus, we posit that the persistence of epigenetic states does not arise through slow reaction rates but through constraining feedback mechanisms.
Previously described superficial patterns of histone H4 acetylation abundance changes are recapitulated here and mechanistically explained at the single-molecule level. The patterns of histone H4 acetylations, without knowledge of single molecule co-occurrence, have been previously studied [Citation32,Citation40–Citation42]. Our discrete level findings are consistent with these previous results. For example, we confirm that H4K16ac is the most abundant acetylation on H4 and is the preferred acetylation site if not already occupied [Citation32].
However, such disjunct observations are of limited use relative to proteoform-level observations that yield far more functional and mechanistic insight.
H4 acetylations are added in a specific hierarchy with high fidelity but with a few unique exceptions at the single-molecule level and in near exclusive combination with K20me2 (Figure 6(a)). The rapid response of acetylation occurs in a specific progressive hierarchy: H4K16ac is followed by K12ac, K8ac and, finally, by K5ac at the single-molecule level. Notably, some proteoforms violate this hierarchical order. For example, H4{K8ac, K12un, K16ac, K20me2} increases rapidly upon butyrate treatment; however, this is transient, as the missing K12 is rapidly acetylated. ( and ). Supporting our findings, previous work has shown that the addition of acetylation occurs first at K16 then at K12 and is followed by either K8 or K5 [Citation32].
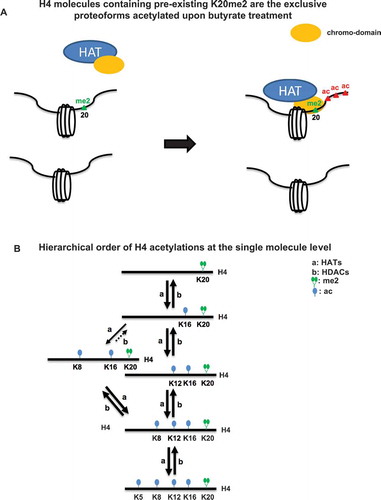
Figure 6. (A) A potential model to explain the proteoform specific increases in H4 acetylation that are observed immediately. Acetylation may be indirectly mediated by a protein with the capacity to recognize H4K20me2. (B) A schematic of the reaction pathways for the observed progressive and hierarchical order of H4 acetylations as cells respond to butyrate.
These bottom up results localized these sites of modifications on single peptides, but importantly did not connect it to full proteoforms and the specificity with respect to H4K20 methylation state. A similar phenomenon is also observed in T47D cells (Figure S6B). All this evidence suggests that there is a strong hierarchical order with specific minor exceptions. Thus, specific histone proteoforms respond to perturbations and discrete PTMs alone are insufficient to understand the mechanism of response.
H4 acetylations recover in the reverse order of acetylation at the single-molecule level also in near exclusive combination with K20me2 (K5ac > K8ac ≥ K12ac > K16ac) () and S4). As with the hierarchy during increasing acetylation, H4K12ac is an exception and can be removed prior to K8ac for a lesser population of molecules (). This indicates for the first time that hierarchical order is preserved at the single-molecule level during HDAC activity. This is a striking symmetry of proteoform specificity of evolutionarily unrelated enzymes and is further suggestive of a system that has evolved to use proteoform-level constraints.
Histone modifying enzymes exhibit proteoform-level substrate specificity in living cells
These findings support the concept that enzymes that ‘write’ or ‘erase’ histone PTMs recognize specific proteoforms as substrates. They are proteoform specific. This is distinct from site specificity. These enzymes are modulated in their activity by the presence of preexisting PTMs on histone H4 molecules. That enzymes with high sequence specificity do not recognize their endogenous substrate sequence when posttranslationally modified should not be surprising. This is effectively a different substrate. However, many enzymes modifying histones have been previously characterized as having low site specificity. The HATs and HDACs involved in this process, are associated with multiple discrete modification sites [Citation15,Citation16]. However, low site specificity does not preclude high proteoform substrate specificity. A single HAT that writes acetylations at multiple sites but only in a particular order is necessarily a series of proteoform substrate specific reactions. The enzyme or other constituents of a complex ‘read’ histone PTMs on the single-molecule level and direct further modification of the same substrate. Indeed, some histone modifying enzymes also contain PTM recognition domains, such as bromodomains [Citation43–Citation47]. Thus, the coexistence of histone PTMs may influence the enzyme proteoform-level specificity regardless of the enzyme mediating multiple PTM sites.
Further supporting a proteoform substrate specificity model, our work also shows that the early increases in H4 acetylations after butyrate application are occurring exclusively in combination with H4K20me2. This suggests the possibility that HATs containing a chromo-domain, or contained in a complex with such activity, ‘read’ H4K20me2, and then add acetyl groups on the same H4 molecule (). This general concept is further supported by H4 acetylations also recovering in a hierarchical order and specifically with K20me2 (Figure S4). H4{K20me2} is an abundant PTM (~60%); however, near 100% of the added acetylation is on molecules with H4{K20me2}. Thus, abundance alone is an insufficient explanation. Alternatively, H4K20me2 may simply be compartmentalized in the cell such that they are more accessible to HATs and HDACs and all other K20 methylation states (K20un, K20me1 and K20me3) are inaccessible. While the localization of some methylation states is consistent with this concept, data on the genomic localization of K20me2 is sparse as it exhibits an extremely broad un-localized ChIP-seq track[Citation39]. Thus, methylation of K20 plays a crucial role in directing acetylation and deacetylation at the single-molecule level.
One possible explanation of this hierarchy is that HATs or complexes containing HATs can read preexisting H4 acetylations (e.g., K16ac) and this results in the addition of acetylations in a progressive and hierarchical order, ending in H4K5ac. Supporting this, some HATs contain acetyl lysine recognizing bromodomains [Citation47]. If HDACs were not substrate specific, the naïve assumption would be that the most abundant H4 acetylation will be removed most rapidly during the recovery of HDAC activity. However, H4K5ac, the least abundant, is removed first, while H4K16ac is deacetylated last. We show that this is a result of a hierarchical single-molecule mechanism. This demonstrates that proteoforms, not discrete histone PTMs, are the true cellular substrates for these enzymes. Therefore, enzymes that modulate histone PTMs are likely to commonly exhibit substrate specificity on the proteoform level. Thus, continued investigation of single-molecule mechanisms of specificity is essential to a complete understanding of chromatin regulation.
These novel proteoform-level findings open new questions to be addressed in the future. For example, there are many minor exceptions to the hierarchy that exist but do not change under any of the conditions tested here. We speculate, due to the slow dynamics but presence of such minor exceptions that these deviant proteoforms, distant from the major proteoform specific reaction pathways, may build up under some conditions and be detrimental to proper cellular function. The presence and slow change of these exceptions could be due to localization to less accessible portions of the genome where they are less exposed to continuous maintenance.
Summary
Overall, histone acetylation is dynamically regulated in a proteoform specific manner upon butyrate treatment. We find that discrete histone H4 acetylations, and multiply acetylated proteoforms, increase as quickly as 10 minutes post application of butyrate. Additionally, we show that the H4 acetylations affected by butyrate treatment recover within 10–30 minutes after removal of treatment. H4 acetylations are ‘written’ and ‘erased’ in a progressive and hierarchical order at the single-molecule level with proteoform substrate specificity. Acetylations are added in the order of K16ac > K12ac ≥ K8ac > K5ac and removed oppositely, always near exclusively in combination with K20me2. Thus, the coexistence of histone PTMs has an impact on enzyme specificity. All this evidence suggests that histone PTMs are not as static as often described in the literature; they are likely actively added and removed constantly. The persistent regulation of the genome by histone PTMs is likely achieved by feedback mechanisms rather than slow reaction rates. Without the information we present here, it is difficult, if not impossible, to determine the bona fide physiological substrates for many PTM mediating enzymes that are crucial to understanding chromatin regulation. We show this in multiple cell lines with variable HDAC expression levels. For example, MCF7 cells have slightly higher expression levels of some HDACs, while T47D cells have lower levels [Citation48]. This indicates that the phenomena we observe is not unique but is a general feature of the chromatin biochemistry of cells.
Overall, this work demonstrates that H4 acetylations are dynamically regulated in a proteoform specific manner, mechanistically explaining their progressive and hierarchical order. This has wide-ranging implications on our understanding of chromatin regulation.
Materials and methods
Tissue culture
SUM159 and MCF7 cells were grown according to the protocol from American Type Culture Collection at 37°C with 5% CO2. SUM159 cells were maintained in F-12 Nutrient Mixture (Life Technologies) supplemented with 5% newborn calf serum (NCS), 100 U/ml penicillin and streptomycin, 10 mM HEPES, and 1 µg/ml hydrocortisone. MCF7 cells were grown in Dulbecco’s Modified Eagle Medium (Life Technologies) supplemented with 10% NCS and 100 U/ml penicillin and streptomycin.
Histone isolation and purification
The protocol for nuclei isolation and acid extraction is adapted from previous work [Citation49]. In brief, nuclei are isolated with an NP-40 alternative based procedure in the presence of a cocktail of inhibitors. The isolated nuclei are acid extracted using 0.2 M H2SO4 to precipitate non-histone proteins and 0.2 g/ml trichloroacetic acid to precipitate a crude histone preparation of only chromatin bound histones. Histone H4 is further purified by reversed phase HPLC prior to LC-MS/MS analysis.
Butyrate treatment
SUM159 and MCF7 cells were treated with 5 mM sodium butyrate. Three 100 mm dishes per time point were harvested at 0, 10, 20, 30 min, 1 and 2 h.
Removal of butyrate
SUM159 and MCF7 cells were incubated with 5 mM sodium butyrate for 1 h, and then washed with cold 1X PBS twice and incubated in medium without any treatment. Cells were harvested at 0, 10, 20, 30 min, 1, 2, 6 and 12 h after removal of butyrate.
LC-MS/MS
A Thermo Scientific DIONEX UltiMate 3000 RSLCnano System with a ProFlow Pump block was used for on-line liquid chromatography. Histone H4 was resuspended in buffer A (98% H2O, 2% ACN, 0.1% FA). A linear gradient from 27% buffer B (2% H2O, 98% ACN, 0.1% FA) to 30% buffer B in 70 min was used, followed by a subsequent wash. A single homemade column (15 cm in length, 100 µm ID) packed with ZORBAX C3-300SB (3.5 µm bead size with 300 Å pores) was used for all experiments. Approximately 100 ng of histone H4 obtained from offline fractionation was injected into mass spectrometry. Mass spectrometry was performed with a Thermo Scientific Orbitrap Fusion Lumos operating in positive mode and intact protein mode.
Data analysis
The data analysis method is adapted from previous work [Citation50] and has been further developed for histone H4. In many less precise methods a 2-fold change is often arbitrarily considered an insignificant change in many analyses. However, since H4 acetylations can approach 50% under basal conditions, it may be impossible to have a 2-fold increase of total H4 acetylation. Thus, we use relative abundance normalized to the total number of histone H4 molecules and use P values to estimate the probability of non-random change. All P values are calculated according to a two-tailed Student’s t-test. Standard error is used throughout this study.
Notation
The “<>“ notation indicates a proteoform. For example, H4<K20me2> indicates that only K20me2 is present on this particular histone H4 molecule. The ‘{}’ notation indicates a discrete PTM. This notation definitively ignores or ‘marginalizes out’ the PTMs occurring at all other sites except those that are specifically designated. For example, the abundance of H4{K20me2} is calculated by the sum of all proteoforms containing K20me2 and then normalized to 100% (of total H4). Thus, H4{K20me2} is identical to the commonly used H4K20me2 as detected by antibody-based methods, but different from H4<K20me2> that has an approximately opposite meaning of being the exclusive PTM present. The binary combination of H4K16ac and H4K20me2, without consideration of the presence or absence of any other PTM is denoted as H4{K16ac, K20me2}.
Supplemental Material
Download Zip (546.3 KB)Acknowledgments
The authors thank Ms. Akhila Balasubramanian for preliminary work.
Disclosure statement
No potential conflict of interest was reported by the authors.
Supplementary material
Supplemental data for this article can be accessed here.
Related Research Data
References
- Luger K, Mäder AW, Richmond RK, et al. Crystal structure of the nucleosome core particle at 2.8 Å resolution. Nature. 1997;389:251–260.
- Davie JR. Covalent modifications of histones: expression from chromatin templates. Curr Opin Genet Dev. 1998;8:173–178.
- Vaquero A, Loyola A, Reinberg D. The constantly changing face of chromatin. Sci Aging Knowl Environ. 2003;2003:re4.
- Campos EI, Reinberg D. Histones: annotating chromatin. Annu Rev Genet. 2009;43:559–599.
- Bannister AJ, Kouzarides T. Regulation of chromatin by histone modifications. Cell Res. 2011;21:381–395.
- Cosgrove MS, Boeke JD, Wolberger C. Regulated nucleosome mobility and the histone code. Nat Struct Mol Biol. 2004;11:1037–1043.
- Allfrey VG, Faulkner R, Mirsky AE. Acetylation and methylation of histones and their possible role in the regulation of RNA synthesis. Proc Natl Acad Sci. 51(5):786–794.
- Gershey EL, Vidali G, Allfrey VG. Chemical studies of histone acetylation. The occurrence of epsilon-N-acetyllysine in the f2a1 histone. J Biol Chem. 1968;243:5018–5022.
- Andrews AJ, Chen X, Zevin A, et al. The histone chaperone Nap1 promotes nucleosome assembly by eliminating nonnucleosomal histone DNA interactions. Mol Cell. 2010;37:834–842.
- Peters AH, Kubicek S, Mechtler K, et al. Partitioning and plasticity of repressive histone methylation states in mammalian chromatin. Molecular Cell. 2003;12(6):1577–1589.
- Thiru A, Nietlispach D, Mott HR, et al. Structural basis of HP1/PXVXL motif peptide interactions and HP1 localisation to heterochromatin. EMBO J. 2004;23:489–499.
- Stewart MD, Li J, Wong J. Relationship between histone H3 lysine 9 methylation, transcription repression, and heterochromatin protein 1 recruitment. Mol Cell Biol. 2005;25:2525–2538.
- Fischle W, Tseng BS, Dormann HL, et al. Regulation of HP1–chromatin binding by histone H3 methylation and phosphorylation. Nature. 2005;438:1116–1122.
- Kimura A, Matsubara K, Horikoshi M. A decade of histone acetylation: marking eukaryotic chromosomes with specific codes. J Biochem (Tokyo). 2005;138:647–662.
- Kleff S, Andrulis ED, Anderson CW, et al. Identification of a gene encoding a yeast histone H4 acetyltransferase. J Biol Chem. 1995;270:24674–24677.
- Brownell JE, Zhou J, Ranalli T, et al. Tetrahymena histone acetyltransferase A: a homolog to yeast Gcn5p linking histone acetylation to gene activation. Cell. 1996;84:843–851.
- Schiltz RL, Mizzen CA, Vassilev A, et al. Overlapping but distinct patterns of histone acetylation by the human coactivators p300 and PCAF within nucleosomal substrates. J Biol Chem. 1999;274:1189–1192.
- Daujat S, Bauer U-M, Shah V, et al. Crosstalk between CARM1 methylation and CBP acetylation on histone H3. Curr Biol CB. 2002;12:2090–2097.
- Ekwall K. Genome-wide analysis of HDAC function. Trends Genet TIG. 2005;21:608–615.
- Seto E, Yoshida M. Erasers of histone acetylation: the histone deacetylase enzymes. Cold Spring Harb Perspect Biol. 2014;6(4):a018713.
- Gajan A, Barnes VL, Liu M, et al. The histone demethylase dKDM5/LID interacts with the SIN3 histone deacetylase complex and shares functional similarities with SIN3. Epigenetics Chromatin. 2016;9(1):4.
- Lee MG, Wynder C, Bochar DA, et al. Functional interplay between histone demethylase and deacetylase enzymes. Mol Cell Biol. 2006;26:6395–6402.
- Heerboth S, Lapinska K, Snyder N, et al. Use of epigenetic drugs in disease: an overview. Genet Epigenetics. 2014;6:9–19.
- Fraga MF, Ballestar E, Villar-Garea A, et al. Loss of acetylation at Lys16 and trimethylation at Lys20 of histone H4 is a common hallmark of human cancer. Nat Genet. 2005;37:391–400.
- Sadri-Vakili G, Cha J-HJ. Mechanisms of disease: histone modifications in Huntington’s disease. Nat Clin Pract Neurol. 2006;2:330–338.
- Portela A, Esteller M. Epigenetic modifications and human disease. Nat Biotech. 2010;28:1057–1068.
- Raha P, Thomas S, Thurn KT, et al. Combined histone deacetylase inhibition and tamoxifen induces apoptosis in tamoxifen-resistant breast cancer models, by reversing Bcl-2 overexpression. Breast Cancer Res. 2015;17:26.
- Abdelfatah E, Kerner Z, Nanda N, et al. Epigenetic therapy in gastrointestinal cancer: the right combination. Ther Adv Gastroenterol. 2016;9:560–579.
- Davie JR. Inhibition of histone deacetylase activity by butyrate. J Nutr. 2003;133:2485S–2493S.
- Katan-Khaykovich Y, Struhl K. Dynamics of global histone acetylation and deacetylation in vivo: rapid restoration of normal histone acetylation status upon removal of activators and repressors. Genes Dev. 2002;16:743–752.
- Halsall JA, Turan N, Wiersma M, et al. Cells adapt to the epigenomic disruption caused by histone deacetylase inhibitors through a coordinated, chromatin-mediated transcriptional response. Epigenetics Chromatin. 2015;8:29.
- Zhang L, Su X, Liu S, et al. Histone H4 N-Terminal acetylation in Kasumi-1 cells treated with depsipeptide determined by acetic acid–urea olyacrylamide gel electrophoresis, amino acid coded mass tagging, and mass spectrometry. J Proteome Res. 2007;6:81–88.
- Fang J, Feng Q, Ketel CS, et al. Purification and functional Characterization of SET8, a nucleosomal histone H4-Lysine 20-Specific methyltransferase. Curr Biol. 2002;12:1086–1099.
- Garcia BA, Mollah S, Ueberheide BM, et al. Chemical derivatization of histones for facilitated analysis by mass spectrometry. Nat Protoc. 2007;2:933–938.
- Plazas-Mayorca MD, Zee BM, Young NL, et al. One-pot shotgun quantitative mass spectrometry characterization of histones. J Proteome Res. 2009;8:5367–5374.
- Sweet SMM, Li M, Thomas PM, et al. Kinetics of Re-establishing H3K79 methylation marks in global human chromatin. J Biol Chem. 2010;285:32778–32786.
- Sidoli S, Bhanu NV, Karch KR, et al. Complete workflow for analysis of histone post-translational modifications using bottom-up mass spectrometry: from histone extraction to data analysis. JoVE J Vis Exp. 2016;e54112–e54112.
- Roediger WEW. Utilization of nutrients by isolated epithelial cells of the rat colon. Gastroenterology. 1982;83:424–429.
- Schotta G, Lachner M, Sarma K, et al. A silencing pathway to induce H3-K9 and H4-K20 trimethylation at constitutive heterochromatin. Genes Dev. 2004;18:1251–1262.
- Couppez M, Martin-Ponthieu A, Sautière P. Histone H4 from cuttlefish testis is sequentially acetylated. Comparison with acetylation of calf thymus histone H4. J Biol Chem. 1987;262:2854–2860.
- Thorne AW, Kmiciek D, Mitchelson K, et al. Patterns of histone acetylation. Eur J Biochem. 1990;193:701–713.
- Sobel RE, Cook RG, Allis CD. Non-random acetylation of histone H4 by a cytoplasmic histone acetyltransferase as determined by novel methodology. J Biol Chem. 1994;269:18576–18582.
- Dhalluin C, Carlson JE, Zeng L, et al. Structure and ligand of a histone acetyltransferase bromodomain. Nature. 1999;399:491–496.
- Jacobson RH, Ladurner AG, King DS, et al. Structure and function of a human TAFII250 double bromodomain module. Science. 2000;288:1422–1425.
- Owen DJ, Ornaghi P, Yang JC, et al. The structural basis for the recognition of acetylated histone H4 by the bromodomain of histone acetyltransferase gcn5p. EMBO J. 2000;19:6141–6149.
- Hudson BP, Martinez-Yamout MA, Dyson HJ, et al. Solution structure and acetyl-lysine binding activity of the GCN5 bromodomain. J Mol Biol. 2000;304:355–370.
- Jeanmougin F, Wurtz J-M, Le Douarin B, et al. The bromodomain revisited. Trends Biochem Sci. 1997;22:151–153.
- Schmidt T, Samaras P, Frejno M, et al. ProteomicsDB. Nucleic Acids Res. 2018;46:D1271–81.
- Shechter D, Dormann HL, Allis CD, et al. Extraction, purification and analysis of histones. Nat Protoc. 2007;2:1445–1457.
- DiMaggio PA, Young NL, Baliban RC, et al. A mixed integer linear optimization framework for the identification and quantification of targeted post-translational modifications of highly modified proteins using multiplexed electron transfer dissociation tandem mass spectrometry. Mol Cell Proteomics. 2009;8(11):2527–2543.