
ABSTRACT
Late onset of clinical symptoms in hepatocellular carcinoma (HCC) results in late diagnosis and poor disease outcome. Approximately 85% of individuals with HCC have underlying liver cirrhosis. However, not all cirrhotic patients develop cancer. Reliable tools that would distinguish cirrhotic patients who will develop cancer from those who will not are urgently needed. We used the Illumina HumanMethylation450 BeadChip microarray to test whether white blood cell DNA, an easily accessible source of DNA, exhibits site-specific changes in DNA methylation in blood of diagnosed HCC patients (post-diagnostic, 24 cases, 24 controls) and in prospectively collected blood specimens of HCC patients who were cancer-free at blood collection (pre-diagnostic, 21 cases, 21 controls). Out of 22 differentially methylated loci selected for validation by pyrosequencing, 19 loci with neighbouring CpG sites (probes) were confirmed in the pre-diagnostic study group and subjected to verification in a prospective cirrhotic cohort (13 cases, 23 controls). We established for the first time 9 probes that could distinguish HBV-negative cirrhotic patients who subsequently developed HCC from those who stayed cancer-free. These probes were identified within regulatory regions of BARD1, MAGEB3, BRUNOL5, FXYD6, TET1, TSPAN5, DPPA5, KIAA1210, and LSP1. Methylation levels within DPPA5, KIAA1210, and LSP1 were higher in prospective samples from HCC cases vs. cirrhotic controls. The remaining probes were hypomethylated in cases compared with controls. Using blood as a minimally invasive material and pyrosequencing as a straightforward quantitative method, the established probes have potential to be developed into a routine clinical test after validation in larger cohorts.
Introduction
Hepatocellular carcinoma (HCC), one of the most prevalent primary liver cancers, is the 4th most common cancer in the world and the 2nd leading cause of cancer death in the US (Globocan 2012) [Citation1]. In contrast to the stable or declining trends for most cancers, incidence rates for HCC increased more than any other cancer in the last two decades [Citation1]. Much of this increase is likely due to the rising incidence of chronic hepatitis C and B infections (HCV and HBV), obesity, and type 2 diabetes, all being major risk factors for cirrhosis and subsequent HCC [Citation2]. Due to late onset of clinical symptoms and lack of reliable screening tests, HCC is diagnosed late and is associated with poor prognosis and a high mortality rate [Citation2].
The current recommended method for HCC surveillance is a combination of serum alpha-fetoprotein (AFP) and a liver ultrasound every 6 to 12 months [Citation3]. However, using AFP as a screening test can miss up to 40% of patients since a significant proportion of HCC patients do not have elevated AFP [Citation3–Citation5]. In addition, elevated AFP levels are mostly detectable after HCC has already developed, which excludes AFP as an early detection marker. Using ultrasound to distinguish malignant from benign lesions is also problematic due to the nodularity of cirrhotic livers [Citation3–Citation5]. It is therefore critical to identify new effective tools that will improve the early detection of liver cancer and the surveillance for patients at risk. It is estimated that early HCC detection would increase the cure rate from 5 to 80%, which further strengthens the importance of identifying reliable HCC biomarkers [Citation2,Citation3]. Although additional serum markers were investigated, such as AFP-L3 (one of the glycoforms of AFP), des-γ-carboxyprothrombin (DCP), glypican-3 (GPC3), Golgi protein 73 (GP73), midkine (MDK), and osteopontin (OPN), squamous cell carcinoma antigen (SCCA), Annexin A2, and circulating microRNAs, their utility in the clinical settings is diminished by insufficient sensitivity and specificity [Citation3–Citation5].
Etiological factors for HCC include numerous environmental exposures, such as chronic infection with HBV and HCV, alcohol abuse, consumption of aflatoxin contaminated food, and a diet deficient in methyl donors [Citation4,Citation6]. These risk factors clearly suggest the involvement of epigenetic components in HCC pathogenesis, which has been demonstrated in several studies by us and others [Citation6–Citation12]. Epigenetics refers to alterations in gene expression without changes in the underlying DNA sequence and consists of three main components: DNA methylation, histone modifications, and noncoding RNA mechanisms. DNA methylation is considered to be the gate-keeper of gene expression providing stable long-term regulation [Citation13]. Aberrations in DNA methylation patterns, including increase (hypermethylation) in certain regions and decrease (hypomethylation) in others, have been linked to cancer initiation, progression, and metastasis [Citation8,Citation13]. Hypermethylation of tumor suppressor genes linked to transcriptional silencing, and recently reported promoter hypomethylation linked to activation of oncogenes and pro-metastatic genes have been described in tumor tissues from nearly all types of cancer including HCC [Citation8,Citation14–Citation16]. Ethanol intake, for instance, decreases levels of a ubiquitous methyl donor S-adenosylmethionine (SAM) in hepatic cells, which subsequently results in global DNA hypomethylation of the liver tissue, and leads to liver cirrhosis and HCC [Citation6,Citation7]. On the other hand, supplementation with SAM can prevent HCC in rodents [Citation17]. These studies are re-enforced by our previous report where, using genome-wide high throughput technology, we discovered thousands of gene promoters differentially methylated in HCC tumors compared with normal adjacent tissue [Citation8]. Interestingly, recent discoveries suggest that aberrations in DNA methylation occur not only in target tissues where tumors develop but also in other tissues such as blood [Citation18,Citation19]. An excellent example is exposure to aflatoxin B1, one of the etiological factors of HCC, that is associated with changes in DNA methylation patterns of white blood cells [Citation18].
Epigenome-wide association studies provide increasing evidence that changes in DNA methylation are primary events in cancer and therefore may be an excellent tool for identifying reliable early disease biomarkers [Citation8,Citation9]. Clinically relevant early detection biomarkers must be detected by minimally invasive methods in readily accessible tissues such as blood. There is precedent in support of this approach using blood in human cancers, including HCC and colorectal, ovarian, and breast cancers, where serum was tested [Citation20–Citation24]. In these studies, DNA methylation detected using DNA isolated from blood serum corresponds to circulating tumor DNA. While testing circulating tumor DNA sounds logical, low levels of such DNA in serum, especially at early phases of the disease [Citation25], decrease the relevance of serum-based tests for early detection in cancer. Interestingly, recent studies in colorectal, breast, and bladder cancers show that DNA methylation patterns in white blood cells (WBC) might carry reliable cancer biomarkers [Citation26–Citation29]. In HCC, three latest reports identify 6 CpG sites in WBC DNA and demonstrate that methylation at those sites can distinguish HCC from healthy blood in prospective samples collected prior to diagnosis [Citation22,Citation30–Citation32]. Most importantly, all these studies were performed on samples from China and Taiwan, where HCC is predominantly associated with hepatitis B viral infection. Patterns in North American populations, where HCC is mostly linked to alcoholic and non-alcoholic fatty liver disease or HCV, remain unknown. Our goal was therefore to investigate whether DNA methylation in WBC in prospective samples from non-HBV carriers can distinguish individuals who will develop HCC from those who will stay cancer free.
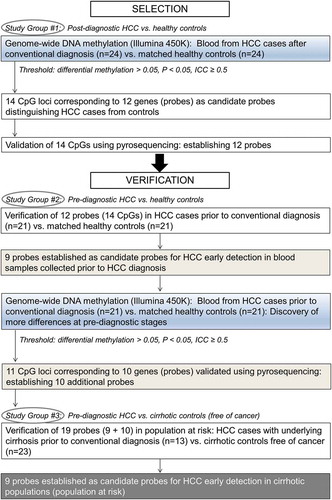
To establish alterations in WBC DNA methylation with potential to be developed into clinically relevant biomarkers for HCC early detection, we compared genome-wide DNA methylation landscapes in blood collected from HCC patients after diagnosis and up to 4 years prior to diagnosis (i.e., prospective samples from individuals with HCC at the time when they were clinically considered cancer-free) (). Our initial group of controls comprised of healthy individuals. The strongest alterations in DNA methylation present at pre-diagnostic stages of the disease vs. healthy controls were subsequently tested in a population at risk, namely individuals with liver cirrhosis. We established 9 probes corresponding to 9 genes in which DNA methylation levels are distinct between prospective (pre-diagnostic) samples from HCC patients with underlying cirrhosis and individuals with cirrhosis who stayed cancer free within the same follow up period. Our present study establishes, for the first time, differences in DNA methylation at specific gene loci that are detectable in blood of individuals prior to conventional diagnosis with HCC as compared with healthy or cirrhotic individuals free of cancer. Such alterations could be developed into non-invasive quantitative biomarkers in populations at risk after validation in a larger cohort. This would be a breakthrough in managing liver disease.
Figure 1. Overview of the design strategy.
Materials and methods
Patients and blood DNA samples
Blood samples from hepatocellular carcinoma (HCC) patients and matched controls were collected by the Indiana Biobank and by Dr. Naga Chalasani group (liver clinic at Indiana University). Please see Supplementary Materials and Methods for details on sample processing. Samples were obtained from three study groups: Study Group #1: blood samples collected from 24 HCC cases after conventional diagnosis (median = 2.3 years) and 24 matched healthy controls (Supplementary Table S1A); Study Group #2: blood samples collected from 21 HCC cases up to 4 years prior to conventional diagnosis (median = 313 days) and 21 matched healthy controls (Supplementary Table S1B); Study Group #3: blood samples collected from 13 HCC cases with underlying cirrhosis up to 2 years prior to conventional diagnosis (median = 97 days) and matched 23 cirrhotic controls without HCC (Supplementary Table S1C). Cases were matched with controls on gender, age, ethnicity, hepatitis C infection, and diabetes. The presence or absence of HCC in our study was determined based on the AASLD criteria [Citation33]. All patients provided written informed consent, and the Ethics Committee from concerned institutions approved the study.
Illumina Infinium HumanMethylation450 BeadChip microarray
Genomic DNA from blood samples in post-diagnostic Study Group #1 and pre-diagnostic Study Group #2 was processed for genome-wide DNA methylation analysis using Infinium HumanMethylation450 BeadChip (450K) as described previously (please see Supplementary Materials and Methods for details) [Citation34]. The methylation score for each CpG was represented as a beta value according to the fluorescent intensity ratio with any values between 0 (unmethylated) and 1 (completely methylated). Raw microarray data and processed data are available from Gene Expression Omnibus (accession number for post-diagnostic Study Group #1: GSE113409; accession number for pre-diagnostic Study Group #2: GSE113392).
Bisulfite treatment of DNA and pyrosequencing
For validation of candidate genes selected based on the microarray data, DNA bisulfite conversion was performed as previously described (please see Supplementary Materials and Methods for details) [Citation8,Citation35]. Specific bisulfite converted gene sequences were amplified with HotStar Taq DNA polymerase (Qiagen) using biotinylated primers listed in Supplementary Table S2. Please see Supplementary Materials and Methods for details. The biotinylated DNA strands were pyrosequenced in the PyroMarkTMQ24 instrument (Biotage, Qiagen), as previously described [Citation36]. Data were analyzed using PyroMarkTMQ24 software.
Statistical analysis
Microarray data
DNA was isolated from frozen whole blood (WBC DNA and potentially circulating tumor DNA) and bioinformatics analyses excluded marginal changes (less than 1%) that could account for circulating tumor DNA. Hence, the presented differences correspond to changes in DNA methylation of WBC population. For convenience, we refer to detected changes as ‘differences in blood DNA methylation’.
Raw methylation data from the 450K microarrays were pre-processed using GenomeStudio and IMA (Illumina Methylation Analyzer for 450K, R/Bioconductor). White blood cell type adjustment was performed using previously published data [Citation37–Citation39]. Please see Supplementary Materials and Methods for details on the analyses. The median beta value across all cases or all controls was calculated for each CpG and a paired Wilcoxon test was used to assess differences between cases and controls (delta beta = differential methylation = median case – median control). A methylation difference with P <0.05 was considered nominally statistically significant. We did not use false discovery rate (FDR) correction of the P values due to limited sample sizes; however, the selected differences were successfully validated by an independent quantitative method, namely pyrosequencing, and verified in independent Study Groups. Among statistically significant differences, we took into account only those that are variable in the population, yet stable over time as identified by intraclass correlation coefficient (ICC) >0.50 based on previously published data (please see Supplementary Materials and Methods for details) [Citation40].
White blood cell type adjustment
Different WBCs need to be taken into account when analyzing DNA methylation in whole blood [Citation37,Citation38]. As WBC differentials were not available for our samples, we used 450K methylation data obtained from purified CD4 T-cells, CD8 T-cells, CD19 B-cells, monocytes, natural killer (NK) cells, neutrophils and eosinophils, and whole PBMCs (n = 6 subjects) [Citation38]. We identified the probes that differed significantly between each individual cell type and PBMC (linear regression using beta values, P < 1e−07 and delta-beta > 0.05). This identified n = 10,082 unique probes, which were subsequently removed from the statistical analyzes, assuming as a first approach that blood composition only marginally affected methylation patterns at other sites (n = 444,054 remaining probes). Genome-wide estimation of cell composition was also used to infer cell proportions using the reference-based method [Citation39].
Pyrosequencing
The non-parametric Mann-Whitney U-test was used to compare the difference in DNA methylation at every tested CpG site in the selected genes (probes) determined by pyrosequencing between cases and controls in all the Study Groups. The results were considered statistically significant when P <0.05.
Results
The landscape of DNA methylation in blood samples collected from patients diagnosed with HCC compared with matched healthy controls
Previous data generated in blood provide increasing evidence that white blood cells (WBC) have different DNA methylation patterns specific to cancer patients compared with healthy individuals without cancer [Citation26–Citation29,Citation41]. To delineate patterns of DNA methylation in blood collected from HCC patients, we performed genome-wide analysis using the Illumina 450K microarray. Twenty-four cases who provided blood following diagnosis with HCC were matched with 24 healthy individuals (control group), enrolled by the Indiana Biobank, as described in Materials and Methods. We will refer to this group of samples as Study Group #1 (post-diagnostic). Please see Supplementary Materials and Methods for microarray characterization.
We identified 7,047 differentially methylated CpG sites in post-diagnostic HCC cases as compared with healthy controls (P <0.05, paired Wilcoxon test, ICC ≥0.5) ()). Difference in methylation expressed as median case – median control (delta beta = differential methylation) were distributed equally in the positive (hypermethylation) and negative (hypomethylation) range of values ()). Chromosomal views of these differences were plotted using the Integrative Genomics Viewer (IGV) visualization tool ()). Each vertical bar corresponds to a single differentially methylated CpG site, with blue indicating hypomethylation and red indicating hypermethylation in case vs. control. Classification of differentially methylated CpG sites according to their location relative to CpG islands (CpGIs) and transcription start site (TSS) revealed that hypomethylated loci are located in CpGIs and CpGI shores (<2 kb flanking CpGI) (), left panel), and within promoters and 5’UTR regions (), right panel) at higher frequency than hypermethylated sites. Among 3,600 CpG sites hypomethylated in cases vs. controls, 2,141 sites were assigned to gene coding regions whereas 3,447 hypermethylated sites corresponded to 1,831 genes. Bioinformatics analysis using GO, KEGG, and DAVID knowledgebase indicate that genes containing hypomethylated CpG sites are associated with functions that are essential for gene transcription, cell adhesion, cell migration, and regulation of signal transduction pathways, including MAPK, WNT, and NOTCH ()). It suggests that these hypomethylated genes might be important for immunological response of white blood cells to cancer. Addressing this intriguing hypothesis requires future extensive studies.
Figure 2. The landscape of DNA methylation delineated using Illumina Infinium Human Methylation 450K BeadChip microarray platform in blood DNA collected after conventional diagnosis with hepatocellular carcinoma (HCC). (A) Pie chart of the 7,047 CpG sites differentially methylated between HCC cases and matched healthy controls. Diff. refers to differential methylation (delta beta = case beta value – control beta value where beta value refers to methylation level). (B) Distribution of differences in DNA methylation levels (delta beta values = differential methylation, Y axis) across all 7,047 differentially methylated loci (X axis). (C) Chromosomal view of 7,047 differentially methylated CpG sites. Regions differentially methylated in HCC cases vs. matched healthy controls are shown in the bar track of the chromosomal views, with blue indicating hypomethylation and red indicating hypermethylation (Case minus Control). (D) Classification of differentially methylated CpG sites according to their location relative to CpG islands (CpGI) and transcription start site (TSS). Hypomethylated loci are located in CpGI and CpGI shores (left panel), and within promoters and 5'UTR regions (right panel) at higher frequency than hypermethylated sites. (E) Functional analyzes using GO, KEGG and DAVID knowledgebase indicate biological functions and pathways associated with genes corresponding to CpG sites hypomethylated and hypermethylated in cases vs. controls. (F) A color-coded table showing median methylation levels and first and third quartile values (in brackets) in cases (average of n = 24) and matched controls (average of n = 24) for the 14 CpG loci corresponding to 12 genes selected for further validation.
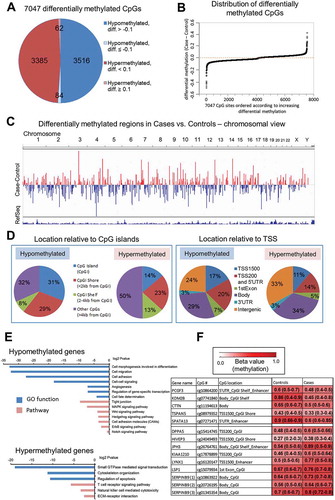
One of the highest differences in DNA methylation levels expressed as delta beta (diff.) were identified within enhancers of PCGF3, SPATA13, JPH3, LYNX1, CpGI of DPPA5, KIAA1210, LSP1, SERPINB9, CpGI shelves (<2 kb flanking outwards from a CpGI shore) and shores of KDM2B, TSPAN5, HIVEP3, and gene body of CTTN ()). These differences were located within loci that show a larger variation between individuals than within individuals as indicated by ICC >0.50 [Citation40]. Indeed, they were consistent across the majority of matched pairs case-control in Study Group #1. The strongest differences, higher than 0.30, were detected for KDM2B, SPATA13, LYNX1, and JPH3.
Selection of candidate differentially methylated regions in HCC cases vs. matched healthy controls
The next step in our workflow was to identify CpG loci among differentially methylated sites found on the microarray which would have the highest potential to distinguish HCC cases from controls in the studied population (). We therefore applied several criteria to increase the probability that the CpG loci are ubiquitously differentially methylated in blood of HCC cases vs. controls. First, the magnitude of the difference in DNA methylation was ≥0.1 with P <0.05. Second, DNA methylation at the CpG loci showed a larger variation between individuals than within individuals with ICC threshold >0.50 [Citation40]. Third, the difference within a given CpG locus was consistent across the majority of matched pairs case-control in our Study Group (≥15/24 pairs). Fourth, the position of the CpG locus corresponded to a gene regulatory region.
Taking into account those criteria, we selected 14 CpG loci corresponding to 12 genes for further validation. Relative methylation levels (beta values) in cases (median of n = 24) and matched controls (median of n = 24) for those loci are shown in ). Five CpG sites were hypomethylated in cases vs. controls and corresponded to PCGF3, KDM2B, CTTN, TSPAN5, and SPATA13. The remaining CpG sites, located within DPPA5, HIVEP3, JPH3, KIAA1210, LYNX1, LSP1, SERPINB9, demonstrated higher methylation levels in cases vs. controls based on the array data. All selected loci are located in regulatory gene regions including CpGIs, CpGI shores and shelves, 5ʹUTR, enhancers, or promoters (TSS1500) ()). PCGF3 and KDM2B are involved in regulation of histone modifications and consequently chromatin accessibility. PCGF3 is a component of a polycomb group multiprotein PRC1-like complex that is required to maintain repressive state of many genes [Citation42]. KDM2B has a direct enzymatic activity to demethylate lysine 4 and 36 of histone H3, which affects transcriptional activity of chromatin [Citation43]. CTTN, TSPAN5, and SPATA13 regulate cell motility and migration. Overexpression of CTTN and SPATA13 increases abilities of cells to invade and metastasize, which reflects the role of these proteins in cell adhesion, cell junctions, and cytoskeleton organization [Citation44,Citation45]. TSPAN5 is a transmembrane protein that mediates signal transduction and regulates cell growth and motility [Citation46,Citation47]. Another interesting gene involved in cell growth is SERPINB9 that regulates cell apoptosis [Citation48]. Among selected genes, there are also regulators of pluripotency of stem cells – such as PCGF3 and DPPA5 [Citation42,Citation49] –, brain-specific genes – such as JPH3 and LYNX1 [Citation50,Citation51] –, transcription factors – such as HIVEP3 [Citation52] –, and genes specific to immune cells – such as LSP1 [Citation53].
Validation of candidate differentially methylated regions in HCC cases using pyrosequencing
The values obtained from the microarray require further validation. For validation by pyrosequencing, PCR primers were designed to encompass the CpG site differentially methylated on the microarray (CpG of interest, marked in square in box plots of Supplementary Figure S1) and additional neighboring CpG sites (please see gene maps in Supplementary Figure S1(A)). Thus, we could obtain a pattern of methylation within a broader DNA region. We call the fragments validated by pyrosequencing ‘probes’ and take into account DNA methylation levels at every CpG within the tested probe. Each probe corresponds to a single gene. Pyrosequencing quantitatively measures the percentage of methylation at a single CpG site resolution and requires only PCR of bisulfite converted genomic DNA. Such a simple method would be easily translatable to a clinical setting.
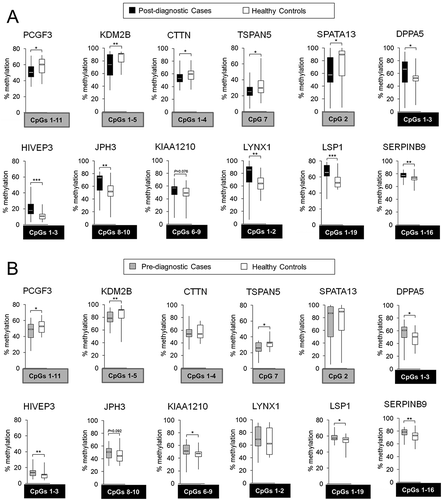
Technical validation by pyrosequencing of 12 probes (genes) indicates statistically significant differences in methylation level at majority of CpG sites of interest in post-diagnostic blood samples from HCC cases vs. healthy controls (P <0.05, Mann-Whitney U-test) (Supplementary Figure S1(B)). The results are shown in box plots created from dots corresponding to patient samples and representing the percentage of methylation at a given CpG site. The locations of CpG sites measured by pyrosequencing are shown in the gene maps in Supplementary Figure S1(A). The differences in median methylation at CpG sites of interest (covered on the array) were the most profound at CpG#1 of KDM2B (47.5% difference in median), CpG#2 of LYNX1 (41.2% difference in median), CpG#2 of SPATA13 (31.6% difference in median), and CpG#10 of JPH3 (14.2% difference in median). Interestingly, the same set of genes show the highest differences between cases and controls on the microarray ()). Several probes such as PCGF3, CTTN, TSPAN5, and DPPA5, are interesting examples where the influence of the neighboring CpG on the intensity detectable by the array is clearly visible. Specifically, the CpG covered on the array (CpG#4) within PCGF3 was significantly hypomethylated in cases vs. controls based on the array data. However, the change in DNA methylation level at this CpG did not reach statistical significance according to quantitative pyrosequencing readings. Instead, significant hypomethylation (P <0.05, Mann-Whitney U-test) was detected at CpGs surrounding CpG#4.
DNA methylation levels within selected probes quantified by pyrosequencing distinguish blood of HCC cases collected prior to diagnosis from blood of healthy controls
Established probes in which DNA methylation levels distinguish HCC cases from healthy controls would have potential to be developed into early detection tests only if the observed difference can be detected at the stage when HCC cannot be diagnosed using conventional methods. We therefore verified whether the 12 probes (genes) established based on the microarray data in Study Group #1 (post-diagnostic) show similar pattern of changes in samples collected from HCC patients at the stage when they were clinically considered healthy. Twenty-one cases, who provided blood samples up to 4 years prior to diagnosis, were matched with 21 healthy individuals (control group), enrolled by the Indiana Biobank, as described in Materials and Methods. We refer to this group of matched pairs case-control as Study Group #2 (pre-diagnostic = prospective). Pyrosequencing confirmed differences within CpG sites located in all the probes except CTTN, SPATA13, and LYNX1 (Supplementary Figure S1(C)). Subsequently, we were searching for CpG sites that show a consistent difference in DNA methylation in both Study Groups #1 and #2 followed by calculating average methylation level for those common CpG sites (). Interestingly, there was a consistent distribution of changes and all CpGs assessed by pyrosequencing were included into the average methylation level for regions in PCGF3, LSP1, and SERPINB9 (). Difference in the average methylation level at pre-diagnostic stages was the highest for regions within KDM2B (10% difference in median) and DPPA5 (12.4% difference in median) ()).
Figure 3. Differentially methylated regions within 5 hypomethylated probes: PCGF3, KDM2B, CTTN, TSPAN5, and SPATA13; and 7 hypermethylated probes: DPPA5, HIVEP3, JPH3, KIAA1210, LYNX1, LSP1, and SERPINB9, in hepatocellular carcinoma (HCC) cases vs. matched healthy controls. Using Illumina 450K microarray, DNA methylation was determined in blood DNA collected from individuals after conventional diagnosis with HCC. Based on the microarray data, 5 hypomethylated and 9 hypermethylated CpG sites corresponding to 5 and 7 genes (probes), respectively, were chosen for validation by pyrosequencing. The difference in DNA methylation, statistical significance, consistency of the difference, location of the CpG site, and the function of a corresponding gene were taken into account in the selection. (A,B) Average methylation level across selected CpG sites within a given probe in (A) post-diagnostic HCC cases (n = 24) and matched healthy controls (n = 24), and (B) pre-diagnostic HCC cases (n = 21) and matched healthy controls (n = 21), as determined by pyrosequencing in PCGF3, KDM2B, CTTN, TSPAN5, SPATA13, DPPA5, HIVEP3, JPH3, KIAA1210, LYNX1, LSP1, and SERPINB9. Blood samples of pre-diagnostic HCC cases (n = 21) were collected at the time when the patients were clinically considered cancer free and developed HCC within 4 years of follow-up. CpG sites included in calculating the average methylation levels of the probe are shown in grey or black square box where grey refers to hypomethylation and black to hypermethylation. The CpG sites were selected based on the consistency of DNA methylation differences in pre- and post-diagnostic samples. ***P <0.001, **P <0.01, *P <0.05.
Genome-wide alterations in the DNA methylation patterns in blood samples collected from HCC patients prior to conventional diagnosis as compared with matched healthy controls
Nine out of 12 probes (genes) established based on the data in Study Group #1 (post-diagnostic) could distinguish HCC patients before the onset of clinical symptoms (pre-diagnostic). To reveal more such probes and compare blood DNA methylation profiles at pre- and post-diagnostic stages, we performed Illumina 450K microarray on pre-diagnostic samples.
Only 971 differentially methylated CpG sites were identified in pre-diagnostic HCC cases as compared with healthy controls (P <0.05, paired Wilcoxon test, ICC ≥0.5) ()). Among 735 hypomethylated CpG sites, 438 sites were assigned to gene coding regions whereas 236 hypermethylated sites corresponded to 144 genes. The most robust changes with delta beta (diff.) higher than 0.30 were identified within 5ʹUTR of ACAN, CpG island of ATHL1, and CpG island shelf of RPTOR ()). These differences were consistent across the majority of matched pairs case-control in Study Group #2 (ICC ≥0.93) [Citation40].
Figure 4. Differential DNA methylation delineated using Illumina Infinium HumanMethylation450 BeadChip microarray platform in blood DNA collected prior to conventional diagnosis (pre-diagnostic) with hepatocellular carcinoma (HCC). Comparison of Illumina 450K array data of pre-diagnostic and post-diagnostic study groups. (A) Pie chart of the 971 CpG sites differentially methylated between pre-diagnostic HCC cases and matched healthy controls. Diff. refers to differential methylation (delta beta = case beta value – control beta value, where delta beta refers to methylation level). 76% of all differentially methylated CpGs in pre-diagnostic subgroup were hypomethylated. (B) A color-coded table showing median methylation levels and first and third quartile values (in brackets) in cases (average of n = 21) and matched controls (average of n = 21) for 11 CpG sites corresponding to 10 genes (probes) selected for further validation. (C) A bar chart shows CpG sites and genes differentially methylated in pre- and post-diagnostic subgroups as compared with matched healthy controls. (D) Classification of differentially methylated CpG sites in pre-diagnostic and post-diagnostic subgroups according to the location relative to CpG islands (CpGI, left panel) and transcription start site (TSS, right panel). Red bars correspond to hypermethylation (positive values) and blue bars represent hypomethylation (negative values). (E) Manhattan plots displaying differentially methylated CpG sites in pre-diagnostic (left panel) and post-diagnostic (middle panel) cases vs. matched healthy controls. Chromosomes are color coded to demonstrate the distribution of methylation changes. Each dot corresponds to a single CpG site and reflects a level of significance. The higher value of – log(P value) the more significant difference. (F) A bar chart shows common CpG sites and common genes differentially methylated in both pre- and post-diagnostic subgroups as compared with matched healthy controls.
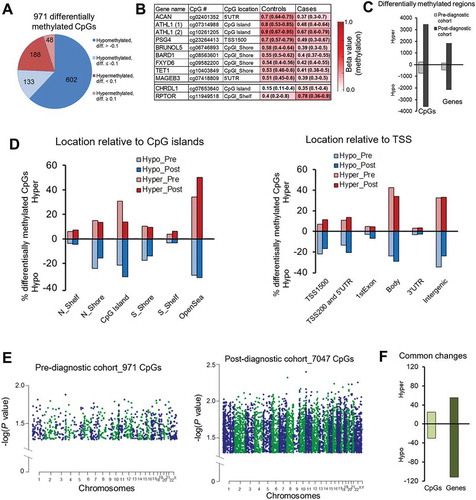
While the number of hyper- and hypo-methylated sites in post-diagnostic samples was practically equal (), nearly 76% of differentially methylated CpG sites in Study Group #2 (pre-diagnostic) showed lower levels of methylation in cases vs. controls (P = 2.973E-11, Wilcoxon test) (). This suggests a stronger regulatory role of hypomethylation in gene transcription in blood cells of individuals developing cancer which is consistent with previous findings [Citation54]. Indeed, those hypomethylated loci are located in regulatory regions important for gene transcription such as CpG island shores, promoters, and 5'UTR (). The distribution of differentially methylated CpGs relative to CpG islands and TSS is similar between pre- and post-diagnostic groups ()). Similarly to post-diagnostic patterns, genes hypomethylated in the Study Group #2 (pre-diagnostic) fall into category of multiple signaling pathways indicating a potential role for those genes in regulating functions of immune cells and subsequently the immune response at very early stages of cancer development.
Difference in methylation expressed as median case – median control (delta beta = differential methylation) was higher than 0.1 in 20% of identified changes in Study Group #2 (pre-diagnostic) (). Level of significance for changes observed in the pre-diagnostic group was lower than at the post-diagnostic stage as indicated by Manhattan plots in . It could suggest progression of changes along with the disease development. We indeed observed numerous such examples including genes selected as candidates for validation in pyrosequencing based on the microarray data in Study Group #1 (depicted in squares in ). Differential methylation of cg07741840 within KDM2B and cg07271471 within SPATA13 was respectively −0.2 and −0.045 in pre-diagnostic samples and reached more robust −0.41 and −0.29 values in post-diagnostic group. Hypermethylated CpG sites within LYNX1 (cg16120147) and JPH3 (cg26764761) show a difference of 0.008 and 0.1, respectively, at pre-diagnostic stages, which progressed to 0.28 and 0.34 in diagnosed HCC. As shown in , 44 CpG sites corresponding to 27 genes are differentially methylated at both pre- and post-diagnostic stages of HCC (Supplementary Table S3). Interestingly, although significant, changes at those common CpGs are subtle and rather constant throughout the disease development. Additional 129 genes showed the same difference in Study Groups #1 and #2 but the difference was located at distinct CpG sites (Supplementary Table S3).
Differential methylation within ATHL1, ACAN, BRUNOL5, BARD1, MAGEB3, FXYD6, TET1, PSG4, RPTOR, and CHRDL1, as quantified by pyrosequencing distinguishes blood of HCC cases prior to diagnosis from healthy controls
Among DNA methylation differences detected in Study Group #2 (pre-diagnostic), we selected 11 CpG loci corresponding to 10 genes for further validation by pyrosequencing ( and , Supplementary Figure S2). To increase the probability that the CpG loci are ubiquitously differentially methylated in pre-diagnostic blood samples of HCC cases vs. controls, we applied several criteria as described above. Briefly, the magnitude of the difference in DNA methylation was ≥0.1 with P <0.05, ICC threshold ≥0.70 [Citation40], consistent difference within a given CpG locus across the majority of matched pairs (≥17/21 pairs), and location of the CpG locus in a gene regulatory region. Relative methylation levels (beta values) in cases (median of n = 21) and matched controls (median of n = 21) for those loci are shown in a color map in ). Two CpG sites were hypermethylated in cases vs. controls and corresponded to CHRDL1 and RPTOR. The remaining CpG sites, located within ACAN, ATHL1, PSG4, BRUNOL5, BARD1, FXYD6, TET1, or MAGEB3, demonstrated lower methylation levels in cases vs. controls based on the array data. All selected loci are located in regulatory gene regions including CpGI, CpGI shores and shelves, 5'UTR, or promoters (TSS1500) (, gene maps in Supplementary Figure S2, left panel). The genes encompassing the selected loci are associated with a wide range of functions. RPTOR and CHRDL1 regulate respectively mTOR and TGF-beta signaling [Citation55,Citation56]. PSG4 is involved in regulation of innate immune system [Citation57] whereas BRUNOL5 regulates gene transcription through pre-mRNA alternative splicing and mRNA editing [Citation58]. BARD1 is implicated in transcriptional regulation, control of DNA damage repair, and cell cycle [Citation59], whereas ACAN and FXYD6 are important for cell adhesion and cell-cell communication [Citation60,Citation61]. Another interesting finding is that one of the genes containing hypomethylated CpG sites in blood DNA of cases is TET1. TET1 is implicated in gene-specific hypomethylation [Citation62]. Thus, TET1 could be a likely candidate responsible for the profound loss of methylation at gene-specific loci that we detect in blood DNA of cases. This interesting hypothesis will be mechanistically tested in future studies.
Figure 5. Differentially methylated regions within 10 probes corresponding to ATHL1, ACAN, BRUNOL5, BARD1, MAGEB3, FXYD6, TET1, PSG4, RPTOR, and CHRDL1 in pre-diagnostic hepatocellular carcinoma (HCC) cases vs. matched healthy controls. Average methylation level across selected CpG sites within a given probe in pre-diagnostic HCC cases (n = 21) vs. matched healthy controls (n = 21), as determined by pyrosequencing in 10 probes corresponding to 10 genes: ATHL1, ACAN, BRUNOL5, BARD1, MAGEB3, FXYD6, TET1, PSG4, RPTOR, and CHRDL1. Selected differentially methylated CpG sites were chosen based on showing consistent changes in DNA methylation in the tested region and are shown in square box, with grey indicating hypomethylation and black indicating hypermethylation in cases vs. controls. ***P <0.001, **P <0.01, *P <0.05.
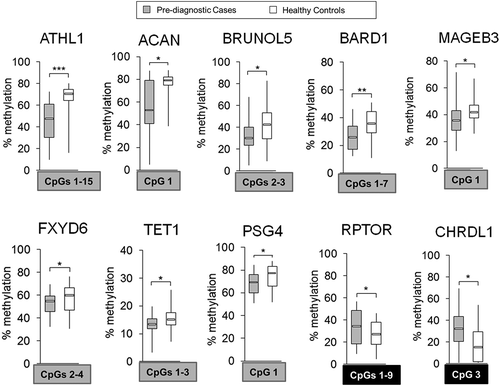
Pyrosequencing quantitatively confirmed changes in DNA methylation observed in the genome-wide analysis (P <0.05, Mann-Whitney U-test) (Supplementary Figure S2, right panel). The highest differences within CpG sites of interest (covered on the array, marked in squares) were detected for CpG#2 of ATHL1 (42.5% difference in median), CpG#1 of ACAN (26% difference in median), CpG#3 of CHRDL1 (17% difference in median), and CpG#4 of BARD1 (13.3% difference in median). Interestingly, ATHL1 and ACAN also show the highest differences on the microarray (). As in post-diagnostic samples, several genes do not show significant changes at a CpG covered on the array but instead have differences at neighboring CpGs. BRUNOL5 is an interesting example. CpG#3 was significantly hypomethylated in cases vs. controls based on the array data. However, this CpG was hypomethylated in 16 cases vs. matched controls according to quantitative pyrosequencing readings. The remaining 5 samples were hypomethylated at neighboring CpG#2. Significant hypomethylation (P <0.05, Mann-Whitney U-test) was detected only for combined analysis of CpG#2 and CpG#3. Similarly, pyrosequencing data indicate significant hypomethylation at CpG#1 within TET1 instead of CpG#2 covered on the array. We then calculated the average methylation level for CpG sites showing consistent changes within each probe (). ATHL1, BARD1, and RPTOR demonstrated changes across the entire tested region and all CpG sites were included in calculations of the average methylation levels (). Established fragments distinguish cases from healthy controls and may have an importance for early detection of HCC.
Differential methylation within nine pyrosequenced probes distinguishes blood of HCC cases prior to and after diagnosis from blood of cirrhotic controls free of cancer
Liver cirrhosis is one of the main risk factors of HCC, but not all cirrhotic patients develop cancer. The main challenge that clinicians face today in liver disease management is to identify individuals with liver cirrhosis who are at higher risk of HCC development. This challenge may be overcome by identifying early detection biomarkers that distinguish not only HCC subjects from healthy individuals but more importantly cirrhotic patients that will develop HCC from those that will not. We established 19 probes (genes) that successfully distinguish HCC cases prior to diagnosis from healthy controls shown in (excluding CTTN, SPATA13, and LYNX1) and . Nine probes were detected based on the genome-wide analysis in Study Group #1 (post-diagnostic) () and remaining 10 probes were derived from the secondary analysis of DNA methylation patterns in Study Group #2 (pre-diagnostic) (). We therefore tested using pyrosequencing whether those 19 differentially methylated probes established as potential biomarkers in samples derived from HCC patients prior to and after diagnosis and matched healthy controls, could serve as biomarkers for HCC early detection and surveillance in populations at risk (i.e., individuals with cirrhosis).
To address this question, we tested blood samples from a prospective cohort of cirrhotic patients without HCC at the time of blood collection (Study Group #3). Thirteen additional cases who developed HCC within 2 years of follow-up were selected and matched with 23 cirrhotic controls that stayed cancer free during the same follow-up period (Study Group #3) (Supplementary Table S1C). Each of 10 cases were matched with 2 controls and the remaining 3 cases were each matched with 1 control. DNA methylation was quantified by pyrosequencing in all 19 probes and the average methylation level was compared between 13 cases and matched 23 cirrhotic controls (please see Supplementary Figure S3 for DNA methylation at single CpG site resolution). Among 10 probes discovered based on the microarray data in Study Group #2 (pre-diagnostic), 5 probes located within BARD1, MAGEB3, BRUNOL5, FXYD6, and TET1 distinguished cases that developed HCC from cirrhotic controls that stayed cancer free within the same period of follow-up (). For 9 probes established based on the microarray data in Study Group #1 (post-diagnostic), we observed differences between cirrhotic cases and cirrhotic controls within TSPAN5, DPPA5, KIAA1210, and LSP1 but with P <0.1 (). A small size of our cirrhotic Study Group #3 could influence statistical significance of the results. Indeed, when we added more cases to the analysis of these 4 probes by including 15 pre-diagnostic cases from Study Group #2 that had registered underlying cirrhosis, all differences were statistically significant (P<0.05) (Supplementary Figure S3(C)). Because the probes were derived from Study Group #1, adding cases from Study Group #2 still maintained a criterion of an independent analysis.
Figure 6. Differentially methylated regions within 9 probes: BARD1, MAGEB3, BRUNOL5, FXYD6, TET1, TSPAN5, DPPA5, KIAA1210, and LSP1, in pre-diagnostic hepatocellular carcinoma (HCC) cases with underlying liver cirrhosis vs. cirrhotic controls free of cancer: candidate probes for HCC early detection in populations at risk. (A, B) Average methylation level across selected CpG sites within: A) BARD1, MAGEB3, BRUNOL5, FXYD6, and TET1 in pre-diagnostic cirrhotic HCC cases (light grey, n = 13 from Study Group #3) and cirrhotic controls free of cancer (white, n = 23); B) TSPAN5, DPPA5, KIAA1210, and LSP1 in pre-diagnostic cirrhotic HCC cases (light grey, n = 13 from Study Group #3) and cirrhotic controls that remained cancer free within the same period of follow up (white, n = 23), as determined by pyrosequencing. Selected differentially methylated CpG sites are shown in square box, with grey indicating hypomethylation and black indicating hypermethylation in cases vs. controls. ***P <0.001, **P <0.01, *P <0.05. (C) A network map of genes corresponding to 9 probes that can distinguish cirrhotic patients who will develop hepatocellular carcinoma (HCC) from those who will stay cancer free within a given follow up period. The network was established based on publicly available data and shows the implication of the genes in functions related to cells actively proliferating and undergoing functional changes (e.g., immune cells or cancer cells). Genes hypomethylated in blood samples of pre-diagnostic hepatocellular carcinoma (HCC) cases such as BARD1, MAGEB3, BRUNOL5, FXYD6, TET1, and TSPAN5 (marked in grey) show evidence for the oncogenic role whereas hypermethylated genes including DPPA5, KIAA1210, and LSP1 (marked in black) are implicated in tumor suppressor functions. Several of them such as BARD1, FXYD6, TSPAN5, and LSP1 are functionally related to immune pathways as indicated by ImmuNet, a collection of immune-related functional relationships networks. TSPAN5 was also found to be expressed in T-lymphoid cells [Citation46].
![Figure 6. Differentially methylated regions within 9 probes: BARD1, MAGEB3, BRUNOL5, FXYD6, TET1, TSPAN5, DPPA5, KIAA1210, and LSP1, in pre-diagnostic hepatocellular carcinoma (HCC) cases with underlying liver cirrhosis vs. cirrhotic controls free of cancer: candidate probes for HCC early detection in populations at risk. (A, B) Average methylation level across selected CpG sites within: A) BARD1, MAGEB3, BRUNOL5, FXYD6, and TET1 in pre-diagnostic cirrhotic HCC cases (light grey, n = 13 from Study Group #3) and cirrhotic controls free of cancer (white, n = 23); B) TSPAN5, DPPA5, KIAA1210, and LSP1 in pre-diagnostic cirrhotic HCC cases (light grey, n = 13 from Study Group #3) and cirrhotic controls that remained cancer free within the same period of follow up (white, n = 23), as determined by pyrosequencing. Selected differentially methylated CpG sites are shown in square box, with grey indicating hypomethylation and black indicating hypermethylation in cases vs. controls. ***P <0.001, **P <0.01, *P <0.05. (C) A network map of genes corresponding to 9 probes that can distinguish cirrhotic patients who will develop hepatocellular carcinoma (HCC) from those who will stay cancer free within a given follow up period. The network was established based on publicly available data and shows the implication of the genes in functions related to cells actively proliferating and undergoing functional changes (e.g., immune cells or cancer cells). Genes hypomethylated in blood samples of pre-diagnostic hepatocellular carcinoma (HCC) cases such as BARD1, MAGEB3, BRUNOL5, FXYD6, TET1, and TSPAN5 (marked in grey) show evidence for the oncogenic role whereas hypermethylated genes including DPPA5, KIAA1210, and LSP1 (marked in black) are implicated in tumor suppressor functions. Several of them such as BARD1, FXYD6, TSPAN5, and LSP1 are functionally related to immune pathways as indicated by ImmuNet, a collection of immune-related functional relationships networks. TSPAN5 was also found to be expressed in T-lymphoid cells [Citation46].](/cms/asset/53e74f88-873e-4814-9f96-ba69134aa6d7/kepi_a_1481706_f0006_b.gif)
All together, we identified 9 out of 19 probes located within BARD1, MAGEB3, BRUNOL5, FXYD6, TET1, TSPAN5, DPPA5, KIAA1210, and LSP1 as candidates for potentially differentiating cirrhotic cases who will developed HCC from cirrhotic controls that will stay cancer free (). The strongest differences ranging between 10–15% were detected at CpG#13 in LSP1 and CpG#3 in BARD1 (Supplementary Figure S3). Cirrhotic controls showed average methylation levels across the tested regions similar to cases for the remaining 10 probes within PCGF3, KDM2B, HIVEP3, JPH3, SERPINB9, ATHL1, ACAN, PSG4, RPTOR, and CHRDL1, in spite of some differences detected at certain CpG loci (Supplementary Figure S3). Although ATHL1 shows significant differences at CpG#2 and CpG#12, small magnitude of those changes and lack of variable methylation levels between cases and controls at other neighboring CpG sites led to excluding ATHL1 probes from further analysis as potential markers in the cirrhotic population (Supplementary Figure S3(B)).
The 9 probes within BARD1, MAGEB3, BRUNOL5, FXYD6, TET1, TSPAN5, DPPA5, KIAA1210, and LSP1 show a promise as candidate biomarkers of HCC early detection in populations at risk. Candidate biomarkers at pre-diagnostic stages of a disease will be accurate only if they persist throughout the disease progression. These 9 candidate probes indeed maintain consistent differences in DNA methylation in post-diagnostic Study Group #1 as compared with cirrhotic controls (Supplementary Figure S4(A)) and healthy controls (, Supplementary Figure S4(B)).
Differential methylation within nine pyrosequenced probes may be specific to HBV-negative populations at risk for HCC development
In order to verify whether the 9 probes established in our group of patients at risk for HCC development are specific to HBV-negative samples, we used publicly available Illumina 450K data by Zhang et al. (GSE67170) [Citation63] and plotted methylation levels of the 9 probes in the cohort of HBV-positive samples with or without HCC. Zhang et al. tested blood samples collected at the time of diagnosis from HBV-positive cases at 5 different stages of HCC development, including minimally advanced stage 0 (n = 10 per stage). Cases were compared with healthy controls or with HBV-positive controls free of cancer. Importantly, none of the 9 probes established in our study was differentially methylated at stage 0 of HCC as compared with healthy or HBV-positive individuals (Supplementary Figure S5(A,B)).
At stage B of HCC, TET1 was consistently hypomethylated in cases vs. healthy or HBV-positive individuals (Supplementary Figure S5(A,B)). Statistical significance of the difference was not achieved for other stages and was masked when all stages were combined for the analysis of T-cells only (data not shown). Hence, this suggests that TET1 can differentiate both HBV-positive and HBV-negative cases in a population at risk and may serve as a stage-specific marker. However, future longitudinal studies in the same patients are required to confirm these observations. Another probe, located within BARD1, was differentially methylated at advanced stages of HCC; however, hypermethylation instead of hypomethylation was observed (Supplementary Figure S5(B)). The change in BARD1 was not detected when cases were compared to healthy individuals (Supplementary Figure S5(A)). The opposite pattern was noted for DPPA5, which was hypomethylated throughout the stages only when the control group consisted of healthy individuals (Supplementary Figure S5(A)). Similarly, hypermethylated LSP1 and hypomethylated TSPAN5 were detected at stage B but failed to distinguish HCC cases in a population at risk such as individuals with HBV infection.
Functional role of differential methylation occurring at pre-diagnostic stages of HCC
CpG loci differentially methylated within the 9 established probes are located in regulatory regions of genes (). This led us to a question whether the DNA methylation changes are functionally important and change the readout of gene transcription. It is well established that there is a reverse correlation between expression and DNA methylation within gene regulatory regions. Hence, we would expect that hypomethylated genes will be overexpressed while lower expression will be detected for hypermethylated genes. We compared our DNA methylation patterns with expression of the 9 genes in blood samples using publicly available data by Shi et al. (GSE49515) [Citation64] and Sakai et al. (GSE10459) [Citation65]. Shi et al. performed expression microarrays on peripheral blood mononuclear cells (PBMC) from 10 post-diagnostic HCC cases as compared with 10 healthy individuals. Interestingly, we found that hypermethylated genes including DPPA5, KIAA1210, and LSP1, are expressed at lower levels in HCC cases compared with healthy controls and the difference was statistically significant for LSP1 (Supplementary Figure S5(C)). Among hypomethylated genes, MAGEB3, TET1, and TSPAN5 were significantly overexpressed in cases with a trend observed for BARD1. Only BRUNOL5 and FXYD6 did not show a correlation between methylation and expression. A comparison of HBV-negative post-diagnostic HCC cases (n = 32) vs. cirrhotic controls (n = 30) using data by Sakai et al. [Citation65] showed overexpression of BARD1 and FXYD6 as expected and unexpectedly upregulation of LSP1 that is hypermethylated in our study groups (Supplementary Figure S5(D), data for TET1 and KIAA1210 not available). As seen in studies by Zhang et al. [Citation63], some changes may be specific to HCC stages and masked when no stage distinction is made. Another possibility for the discrepancies is that the change is specific only to one of the transcripts for a given gene and is lost in the analysis of overlapped transcripts. Zhang et al. [Citation63] also suggest that epigenetic changes in blood cells may contribute to transient changes in gene expression that are time/context dependent and cannot be captured by measuring mRNA levels. Nevertheless, the associations we observe here between methylation differences and expression changes in independent samples could support a claim that the DNA methylation alterations may be functional rather than stochastic.
Additionally, functional analysis of the 9 genes corresponding to the established probes demonstrates their enrichment in functions related to cells actively proliferating and undergoing functional changes (e.g., immune cells or cancer cells), such as cell growth, motility, adhesion, regulation of gene transcription, signal transduction, pluripotency, and immune response ()). Hypomethylated genes show evidence for the oncogenic role whereas hypermethylated genes are implicated in functions associated with tumor suppression. Several of the genes are also expressed in immune cells and are functionally related to immune pathways such as BARD1, FXYD6, TSPAN5, and LSP1, as indicated by a collection of immune-related functional relationships networks ImmuNet. Briefly, TSPAN5 is from tetraspanins family that regulates migration processes and was found to be expressed in cancer cells at invasive and metastatic stages [Citation46]. Similarly, FXYD6 enhances migration and proliferation of cancer cells, including HCC [Citation60]. BARD1 interacts with BRCA1 tumor suppressor decreasing its transcriptional activity and was found to be overexpressed in many types of cancer when BRCA1 is downregulated [Citation59]. BRUNOL5 is implicated in mRNA editing and alternative splicing which impacts gene transcription and function [Citation58]. MAGEB3 is a member of MAGE family of antigens highly expressed in numerous types of cancer which is linked to advanced tumor grade, metastasis, invasion, and poor prognosis [Citation66]. MAGE family was also found to be enriched in cancer stem cells. TET1 is a methylcytosine dioxygenase implicated in gene-specific hypomethylation and regulates gene transcription [Citation62]. Among hypermethylated genes, DPPA5 is an RNA binding protein highly expressed in undifferentiated pluripotent stem cells. The metabolic activity of DPPA5-overexpressing cells is shifted from tumor-specific glycolysis (the Warburg effect) to more oxidative phosphorylation which could indicate tumor suppressor role for DPPA5 [Citation42,Citation49,Citation67]. LSP1, a gene specific to lymphocytes, was found to be downregulated in HCC tissues and cell lines, which correlated with poor clinicopathological features. LSP1-mediated inhibition of HCC cell growth may be mechanistically caused by inhibition of the ERK pathway [Citation53]. KIAA1210, essential cell junction protein regulating dynamic changes of chromatin structures, was found to be downregulated in prostate cancer, which suggests its tumor suppressor role [Citation68,Citation69].
Discussion
Lack of reliable screening tests accounts for high mortality rate in HCC [Citation1,Citation2]. Hence, identifying tools that will improve HCC early detection and surveillance in patients at risk is of high interest. As epigenetic alterations are implicated in HCC development and progression [Citation6–Citation9], first attempts in biomarker research aimed at establishing epigenetic changes in tissue biopsies that could discriminate cancer from normal samples [Citation3,Citation8,Citation9,Citation22]. Commonly studied hypermethylated genes include p16, SOCS1, GSTP1, and CDH1, whose differential methylation was proposed as a prognostic marker of HCC associated with clinicopathological data [Citation3,Citation22]. We further proposed three genes, GPM6B, MAGEA12 and FCRL1, as candidate HCC biomarkers whose DNA methylation levels discriminate tumors from normal adjacent tissue and tumors from cirrhotic tissue [Citation9]. Although promising, those markers have low likelihood to be applied in the clinic because biopsies are not appropriate for early diagnostic tests. The next challenge in the field was to find an approach where those biomarkers can be detectable by minimally invasive methods. Numerous studies, including HCC [Citation22–Citation24], colorectal [Citation20], and ovarian cancers [Citation21], showed that blood serum may be a promising material carrying the same DNA methylation signature of markers as tumor tissue because it contains circulating tumor DNA. However, there is an obstacle in using that approach in early cancer detection mainly due to low levels of circulating tumor DNA in serum at early phases of the disease [Citation25]. Since cancer is a systemic disease, we and others hypothesize that white blood cells (WBC) will have different DNA methylation patterns specific to patients developing HCC compared to individuals without cancer [Citation22,Citation30–Citation32]. This pattern of alterations could constitute an early diagnostic marker of HCC.
Recent studies show that DNA methylation patterns in white blood cells (WBC) might carry reliable biomarkers. Global methylation of genomic DNA in WBC differentiated cancer patients from healthy individuals and was suggested as a useful epigenetic biomarker for cancer risk estimation and early detection [Citation26,Citation27]. Hypomethylation within BLCA-4 repeats in blood cells was associated with higher risk of bladder cancer [Citation28]. Methylation in ATM intragenic loci in DNA from WBC was proposed as a potential marker of breast cancer risk detectable on average 3 years prior to diagnosis [Citation29]. Furthermore, methylation within CNKSR1, IFI44L, and PENK in WBC DNA of prospective blood samples from HBV-positive HCC patients was demonstrated as a potential biomarker that predicts risk of HCC development [Citation30]. High methylation level within WNK2 was associated with higher HCC risk, whereas high methylation levels in TPO and MYT1L were predictive of low risk for HCC [Citation31,Citation32].
Studies on DNA methylation biomarkers in blood of prospective HCC samples as described above [Citation30–Citation32], used healthy individuals as control groups. Although in the nested case-control study by Kao et al. [Citation30] a control was selected from the population at risk at the point in time when a case was diagnosed in the cohort study, there is no information whether or not the control had liver cirrhosis. History of chronic liver disease is indicated just for several controls. Furthermore, all tested samples were from men only. These factors impede the clinical use of those proposed biomarkers in populations at risk such as cirrhotic individuals. Moreover, the studied samples were from China and Taiwan where majority of HCC cases are associated with HBV infection. In our present investigation, we study both men and women of Caucasian and African-American origins where HCC is associated with alcoholic and non-alcoholic fatty liver disease, and HCV infection (Supplementary Table S1). For the first time, we address blood DNA methylation differences in HBV-negative HCC. We compare DNA methylation profiles between cases and healthy controls as well as between cases and cirrhotic controls who stayed cancer free within the same follow up period as cases (). Thus, established differences in DNA methylation that distinguish cases from controls have high potential to be developed into HCC biomarkers in populations at risk, after validation in larger cohorts. Apart from pre-diagnostic samples, our study groups comprise blood samples collected from already diagnosed HCC patients (post-diagnostic group). Any differences present in pre-diagnostic samples vs. controls must also distinguish post-diagnostic samples from controls. Alterations that persist during the disease development have potential to serve as biomarkers of early detection.
Using the design strategy shown in , we delineated genome-wide DNA methylation profiles in blood samples collected from HCC cases after conventional diagnosis and from matched healthy controls (post-diagnostic Study Group #1). We found that blood DNA has different DNA methylation patterns specific to patients with HCC compared to individuals without cancer (). Out of 12 probes (genes) validated by pyrosequencing (Supplementary Figure S1(B)), 9 probes demonstrated differences in prospective cases (pre-diagnostic Study Group #2) ()). To discover more differences characteristic of pre-diagnostic stages of HCC, we mapped DNA methylation patterns in pre-diagnostic cases and matched healthy controls. Interestingly, we detected 7 times less differences in pre-diagnostic Study Group #2 than in HCC patients () and )). The majority of differentially methylated CpG sites were hypomethylated in cases vs. controls ()) and were located in gene regulatory regions ()). In both Study Groups, hypomethylated CpG sites were located in genes associated with regulation of transcription and signal transduction. Hypomethylation could be potentially linked to up-regulation of those genes suggesting that they might be functionally involved in immunological response of white blood cells to cancer. Furthermore, we found among hypomethylated genes in pre-diagnostic Study Group several candidates implicated in immunomodulation, including CSF2, IL9, and IFITM5. Indeed, differential methylation of growth factor genes such as FGF12 and IGF1, and immune-related genes such as CCL28, TLR2 and TGFBI, was previously reported in blood DNA upon exposure to aflatoxin B1, a risk factor of HCC [Citation18].
The genome-wide analysis of prospective blood samples led to discovery of 10 additional probes (genes) that distinguish pre-diagnostic cases from healthy controls as confirmed quantitatively by pyrosequencing (). Thus, we have established 19 probes in which altered DNA methylation patterns appear up to 4 years prior to the onset of symptoms and conventional diagnosis ( and ). However, these probes will be relevant in the clinic only if they can be used in populations at risk. Using samples from a cirrhotic Study Group #3, we found that 9 of the 19 validated probes located within regulatory regions of BARD1, MAGEB3, BRUNOL5, FXYD6, TET1, TSPAN5, DPPA5, KIAA1210, and LSP1 could potentially distinguish cirrhotic patients who will develop HCC within next 2 years from those who will stay cancer free within the same period of follow up (). They consistently separated pre-diagnostic HCC cases with underlying liver cirrhosis from cirrhotic controls () as well as post-diagnostic HCC cases in Study Group #1 from cirrhotic controls (Supplementary Figure S4(A)). Hence, the discriminative power of those probes persist when the disease progresses which ensures lack of false negative results where a patient with developed HCC could be assessed as a cancer free-control (). More importantly, AFP measurements that are currently recommended as HCC surveillance method [Citation33] performed in our groups of patients very poorly. In Study Group #2, AFP values were available for 15 patients. None of those patients had AFP values higher than 400–500 ng/ml that would be considered diagnostic for HCC (Supplementary Table S1B). Based on AFP values, we would be able to diagnose HCC only in 2 out of 13 patients in Study Group #3 (Supplementary Table S1C) and 2 out of 23 patients in post-diagnostic Study Group #1 (Supplementary Table S1A).
A detailed functional analysis of genes corresponding to the 9 probes showed associations with functions that are important for cells undergoing activation/transformation such as activated immune cells responding to insults in the body, e.g., inflammation or cancer development ()) [Citation42,Citation46,Citation49,Citation53,Citation58–Citation60,Citation62,Citation66–Citation69]. Recent studies by Zhang et al. [Citation63] also indicate immune and inflammatory pathways associated with differentially methylated genes found in blood samples of HCC patients. It would suggest that the observed changes in DNA methylation in blood cells are functionally important rather than stochastic which is strengthened by the location of changes in gene regulatory regions and by corresponding changes in expression observed in blood of the independent set of patients [Citation64,Citation65] (Supplementary Figure S5). Functions associated with the 9 genes also indicate a potential role of changes in the activation of the immune cells rather than their relation to HCC development. Lack of a significant overlap of differentially methylated 9 genes established in HBV-negative samples in our study with HBV-positive samples in the study by Zhang et al. [Citation63] also implies that different insults can produce a distinct immune response and thereby cause distinct changes in DNA methylation. Stage-dependent analysis performed by Zhang et al. [Citation63] also indicates progression of DNA methylation changes along with HCC development which might reflect changes in the immune response when the disease progresses.
Resemblance of the functional groups associated with the 9 genes established in our Study Groups to those previously described by us and others in cancer [Citation8] may be due to the fact that cancer cells similarly to activated immune cells proliferate at a high rate and go through functional changes. Using publicly available Illumina 450K data published by Wu et al. [Citation31] (GSE54503, GSE37988), we found that only KIAA1210, MAGEB3, and FXYD6 show the same pattern of changes in DNA methylation levels in HCC tumors vs. normal adjacent tissues as changes observed in the blood samples in our cohort of patients (data not shown). Although some studies report concordance between DNA methylation patterns in WBC and tumor tissue [Citation19], there is also strong evidence for lack of such an association. A meta-analysis of hypomethylation of repetitive elements LINE-1 shows that LINE-1 methylation levels do not correspond between cancer tissues and respective blood samples for most types of cancer [Citation70]. Zhang et al. [Citation63] also did not detect a correlation between changes in PBMC and T cells with previously characterized differentially methylated genes in HCC tumors. These intriguing observations require further future investigations in order to clarify if the changes in blood DNA methylation patterns are mechanistically important or serve just as biomarkers. Another future topic of interest implicates enzymes of the epigenetic machinery that would be responsible for altered DNA methylation patterns in immune cells, such as methylating DNMTs, demethylating TETs or histone modifying enzymes. A possibility arises in targeting these enzymes to change a response/activity of immune cells and achieve a therapeutic effect.
Importantly, probes located within TSPAN5, DPPA5, KIAA1210, and LSP1, which were discovered based on the microarray data in post-diagnostic Study Group #1, did not show statistically significant changes when 13 cirrhotic cases were compared with 23 matched cirrhotic controls (Study Group #3, P <0.1) ()). We reached statistical significance and observed consistent differences in DNA methylation levels after adding into the analysis additional 15 pre-diagnostic cases with underlying cirrhosis from Study Group #2 (Supplementary Figure S3(C)). This suggests that negative results might be due to a small samples size and all 19 probes that separate pre-diagnostic HCC cases from healthy controls should be tested in a larger cohort of cirrhotic populations in future studies.
Using blood as a minimally invasive material and pyrosequencing as a straightforward quantitative method, our present study establishes for the first time DNA regions corresponding to 9 genes in which methylation of blood DNA could potentially distinguish HCC cases from cirrhotic individuals at the time when cases are clinically considered free of cancer. Pre-diagnostic samples used in our investigation come from patients with HCC associated with alcoholic and non-alcoholic liver disease and HCV infection which is distinct from studied so far mostly HBV-associated HCC cases in Asian regions. Despite several limitations including small sample size, lack of investigation of clinical confounders and mechanisms that would explain associations of these genes with HCC, the identified probes have potential to be developed into a routine clinical test after validation in larger cohorts. Recent studies demonstrate that the successful implementation of biomarker discovery might be achieved by a combination of different markers in order to increase sensitivity and specificity [Citation3]. Such a combined set of specific alterations that could indicate by a simple blood test the presence of HCC before the onset of symptoms will accelerate progress to decrease HCC mortality by diagnosing cancer early, and thus achieving high cure rate.
Supplemental Material
Download Zip (3.3 MB)Disclosure statement
No potential conflict of interest was reported by the authors.
Supplementary material
Supplemental data for this article can be accessed here.
Additional information
Funding
Related Research Data
References
- Siegel RL, Miller KD, Jemal A. Cancer statistics, 2015. CA Cancer J Clin. 2015;65:5–29.
- Singh S, Singh PP, Roberts LR, et al. Chemopreventive strategies in hepatocellular carcinoma. Nat Rev Gastroenterol Hepatol. 2014;11:45–54.
- Lou J, Zhang L, Lv S, et al. Biomarkers for Hepatocellular Carcinoma. Biomark Cancer. 2017;9:1–9.
- Schutte K, Schulz C, Link A, et al. Current biomarkers for hepatocellular carcinoma: surveillance, diagnosis and prediction of prognosis. World J Hepatol. 2015;7:139–149.
- Tsuchiya N, Sawada Y, Endo I, et al. Biomarkers for the early diagnosis of hepatocellular carcinoma. World J Gastroenterol. 2015;21:10573–10583.
- Asada K, Kotake Y, Asada R, et al. LINE-1 hypomethylation in a choline-deficiency-induced liver cancer in rats: dependence on feeding period. J Biomed Biotechnol. 2006;2006:17142.
- Song Z, Zhou Z, Chen T, et al. S-adenosylmethionine (SAMe) protects against acute alcohol induced hepatotoxicity in mice. J Nutr Biochem. 2003;14:591–597.
- Stefanska B, Huang J, Bhattacharyya B, et al. Definition of the landscape of promoter DNA hypomethylation in liver cancer. Cancer Res. 2011;71:5891–5903.
- Stefanska B, Bouzelmat A, Huang J, et al. Discovery and validation of DNA hypomethylation biomarkers for liver cancer using HRM-specific probes. PLoS One. 2013;8:e68439.
- Stefanska B, Cheishvili D, Suderman M, et al. Genome-wide study of hypomethylated and induced genes in patients with liver cancer unravels novel anticancer targets. Clin Cancer Res. 2014;20:3118–3132.
- Stefanska B, Suderman M, Machnes Z, et al. Transcription onset of genes critical in liver carcinogenesis is epigenetically regulated by methylated DNA-binding protein MBD2. Carcinogenesis. 2013;34:2738–2749.
- Cheishvili D, Stefanska B, Yi C, et al. A common promoter hypomethylation signature in invasive breast, liver and prostate cancer cell lines reveals novel targets involved in cancer invasiveness. Oncotarget. 2015;6:33253–33268.
- Jones PA, Issa JP, Baylin S. Targeting the cancer epigenome for therapy. Nat Reviews Genet. 2016;17:630–641.
- Mayol G, Martin-Subero JI, Rios J, et al. DNA hypomethylation affects cancer-related biological functions and genes relevant in neuroblastoma pathogenesis. PLoS One. 2012;7:e48401.
- Lubecka K, Kurzava L, Flower K, et al. Stilbenoids remodel the DNA methylation patterns in breast cancer cells and inhibit oncogenic NOTCH signaling through epigenetic regulation of MAML2 transcriptional activity. Carcinogenesis. 2016;37:656–668.
- Cheishvili D, Boureau L, Szyf M. DNA demethylation and invasive cancer: implications for therapeutics. Br J Pharmacol. 2015;172:2705–2715.
- Pereira MA, Wang W, Kramer PM, et al. Prevention by methionine of dichloroacetic acid-induced liver cancer and DNA hypomethylation in mice. Toxicol Sci. 2004;77:243–248.
- Hernandez-Vargas H, Castelino J, Silver MJ, et al. Exposure to aflatoxin B1 in utero is associated with DNA methylation in white blood cells of infants in The Gambia. Int J Epidemiol. 2015;44:1238–1248.
- Al-Moghrabi N, Nofel A, Al-Yousef N, et al. The molecular significance of methylated BRCA1 promoter in white blood cells of cancer-free females. BMC Cancer. 2014;14:830.
- deVos T, Tetzner R, Model F, et al. Circulating methylated SEPT9 DNA in plasma is a biomarker for colorectal cancer. Clin Chem. 2009;55:1337–1346.
- Campan M, Moffitt M, Houshdaran S, et al. Genome-scale screen for DNA methylation-based detection markers for ovarian cancer. PLoS One. 2011;6:e28141.
- Mah WC, Lee CG. DNA methylation: potential biomarker in hepatocellular carcinoma. Biomark Res. 2014;2:5.
- Huang ZH, Hu Y, Hua D, et al. Quantitative analysis of multiple methylated genes in plasma for the diagnosis and prognosis of hepatocellular carcinoma. Exp Mol Pathol. 2011;91:702–707.
- Xu RH, Wei W, Krawczyk M, et al. Circulating tumour DNA methylation markers for diagnosis and prognosis of hepatocellular carcinoma. Nat Mater. 2017;16:1155–1161.
- Chalasani N, Guo X, Loomba R, et al. Genome-wide association study identifies variants associated with histologic features of nonalcoholic fatty liver disease. Gastroenterology. 2010;139:1567–76,76 e1-6.
- Friso S, Udali S, Guarini P, et al. Global DNA hypomethylation in peripheral blood mononuclear cells as a biomarker of cancer risk. Cancer Epidemiol Biomarkers Prev. 2013;22:348–355.
- Huang WY, Su LJ, Hayes RB, et al. Prospective study of genomic hypomethylation of leukocyte DNA and colorectal cancer risk. Cancer Epidemiol Biomarkers Prev. 2012;21:2014–2021.
- Ji HX, Zhao Q, Pan JH, et al. Association of BLCA-4 hypomethylation in blood leukocyte DNA and the risk of bladder cancer in a Chinese population. Pathol Oncol Res. 2013;19:205–210.
- Brennan K, Garcia-Closas M, Orr N, et al. Intragenic ATM methylation in peripheral blood DNA as a biomarker of breast cancer risk. Cancer Res. 2012;72:2304–2313.
- Kao WY, Yang SH, Liu WJ, et al. Genome-wide identification of blood DNA methylation patterns associated with early-onset hepatocellular carcinoma development in hepatitis B carriers. Mol Carcinog. 2017;56:425–435.
- Wu HC, Shen J, Yang HI, et al. Blood DNA methylation markers in prospectively identified hepatocellular carcinoma cases and controls from Taiwan. World J Hepatol. 2016;8:301–306.
- Liu Z, Yan H, Zhang J. Blood DNA methylation markers in potentially identified Chinese patients with hepatocellular carcinoma. Pak J Pharm Sci. 2016;29:1451–1456.
- Bruix J, Sherman M. American association for the study of liver D. Management of hepatocellular carcinoma: an update. Hepatology. 2011;53:1020–1022.
- Cheishvili D, Stefanska B, Yi C, et al. A common promoter hypomethylation signature in invasive breast, liver and prostate cancer cell lines reveals novel targets involved in cancer invasiveness. Oncotarget. 2015;6.
- Colella S, Shen L, Baggerly KA, et al. Sensitive and quantitative universal pyrosequencing methylation analysis of CpG sites. Biotechniques. 2003;35:146–150.
- Tost J, Gut IG. DNA methylation analysis by pyrosequencing. Nat Protoc. 2007;2:2265–2275.
- Adalsteinsson BT, Gudnason H, Aspelund T, et al. Heterogeneity in white blood cells has potential to confound DNA methylation measurements. PLoS One. 2012;7:e46705.
- Reinius LE, Acevedo N, Joerink M, et al. Differential DNA methylation in purified human blood cells: implications for cell lineage and studies on disease susceptibility. PLoS One. 2012;7:e41361.
- Houseman EA, Accomando WP, Koestler DC, et al. DNA methylation arrays as surrogate measures of cell mixture distribution. BMC Bioinformatics. 2012;13:86.
- Flanagan JM, Brook MN, Orr N, et al. Temporal stability and determinants of white blood cell DNA methylation in the breakthrough generations study. Cancer Epidemiol Biomarkers Prev. 2015;24:221–229.
- Zhang F, Fan YC, Mu NN, et al. Exportin 4 gene expression and DNA promoter methylation status in chronic hepatitis B virus infection. J Viral Hepat. 2014;21:241–250.
- Vandamme J, Volkel P, Rosnoblet C, et al. Interaction proteomics analysis of polycomb proteins defines distinct PRC1 complexes in mammalian cells. Mol Cell Proteomics. 2011;10:M110 002642.
- Tsukada Y, Fang J, Erdjument-Bromage H, et al. Histone demethylation by a family of JmjC domain-containing proteins. Nature. 2006;439:811–816.
- Xu XZ, Garcia MV, Li TY, et al. Cytoskeleton alterations in melanoma: aberrant expression of cortactin, an actin-binding adapter protein, correlates with melanocytic tumor progression. Mod Pathol. 2010;23:187–196.
- Bristow JM, Sellers MH, Majumdar D, et al. The Rho-family GEF Asef2 activates Rac to modulate adhesion and actin dynamics and thereby regulate cell migration. J Cell Sci. 2009;122:4535–4546.
- Detchokul S, Williams ED, Parker MW, et al. Tetraspanins as regulators of the tumour microenvironment: implications for metastasis and therapeutic strategies. Br J Pharmacol. 2014;171:5462–5490.
- Saint-Pol J, Billard M, Dornier E, et al. New insights into the tetraspanin Tspan5 using novel monoclonal antibodies. J Biol Chem. 2017;292:9551–9566.
- Heit C, Jackson BC, McAndrews M, et al. Update of the human and mouse SERPIN gene superfamily. Hum Genomics. 2013;7:22.
- Qian X, Kim JK, Tong W, et al. DPPA5 supports pluripotency and reprogramming by regulating NANOG turnover. Stem Cells. 2016;34:588–600.
- Lyukmanova EN, Shenkarev ZO, Shulepko MA, et al. NMR structure and action on nicotinic acetylcholine receptors of water-soluble domain of human LYNX1. J Biol Chem. 2011;286:10618–10627.
- Costa Mdo C, Teixeira-Castro A, Constante M, et al. Exclusion of mutations in the PRNP, JPH3, TBP, ATN1, CREBBP, POU3F2 and FTL genes as a cause of disease in Portuguese patients with a Huntington-like phenotype. J Hum Genet. 2006;51:645–651.
- Li YJ, Deng J, Mayhew GM, et al. Investigation of the PARK10 gene in Parkinson disease. Ann Hum Genet. 2007;71:639–647.
- Zhang H, Wang Y, Liu Z, et al. Lymphocyte-specific protein 1 inhibits the growth of hepatocellular carcinoma by suppressing ERK1/2 phosphorylation. FEBS Open Bio. 2016;6:1227–1237.
- van Veldhoven K, Polidoro S, Baglietto L, et al. Epigenome-wide association study reveals decreased average methylation levels years before breast cancer diagnosis. Clin Epigenetics. 2015;7:67.
- Cyr-Depauw C, Northey JJ, Tabaries S, et al. Chordin-like 1 suppresses bone morphogenetic protein 4-induced breast cancer cell migration and invasion. Mol Cell Biol. 2016;36:1509–1525.
- Ramirez-Valle F, Badura ML, Braunstein S, et al. Mitotic raptor promotes mTORC1 activity, G(2)/M cell cycle progression, and internal ribosome entry site-mediated mRNA translation. Mol Cell Biol. 2010;30:3151–3164.
- Berinstein NL. Carcinoembryonic antigen as a target for therapeutic anticancer vaccines: a review. J Clin Oncol. 2002;20:2197–2207.
- Ladd AN, Charlet N, Cooper TA. The CELF family of RNA binding proteins is implicated in cell-specific and developmentally regulated alternative splicing. Mol Cell Biol. 2001;21:1285–1296.
- Cimmino F, Formicola D, Capasso M. Dualistic role of BARD1 in cancer. Genes. 2017;8:375.
- Gao Q, Chen X, Duan H, et al. FXYD6: a novel therapeutic target toward hepatocellular carcinoma. Protein Cell. 2014;5:532–543.
- Futyma K, Miotla P, Rozynska K, et al. Expression of genes encoding extracellular matrix proteins: a macroarray study. Oncol Rep. 2014;32:2349–2353.
- Maeder ML, Angstman JF, Richardson ME, et al. Targeted DNA demethylation and activation of endogenous genes using programmable TALE-TET1 fusion proteins. Nat Biotechnol. 2013;31:1137–1142.
- Zhang Y, Petropoulos S, Liu J, et al. The signature of liver cancer in immune cells DNA methylation. Clin Epigenetics. 2018;10:8.
- Shi M, Chen MS, Sekar K, et al. A blood-based three-gene signature for the non-invasive detection of early human hepatocellular carcinoma. Eur J Cancer. 2014;50:928–936.
- Sakai Y, Honda M, Fujinaga H, et al. Common transcriptional signature of tumor-infiltrating mononuclear inflammatory cells and peripheral blood mononuclear cells in hepatocellular carcinoma patients. Cancer Res. 2008;68:10267–10279.
- Weon JL, Potts PR. The MAGE protein family and cancer. Curr Opin Cell Biol. 2015;37:1–8.
- Miharada K, Sigurdsson V, Karlsson S. Dppa5 improves hematopoietic stem cell activity by reducing endoplasmic reticulum stress. Cell Rep. 2014;7:1381–1392.
- Vanaja DK, Ballman KV, Morlan BW, et al. PDLIM4 repression by hypermethylation as a potential biomarker for prostate cancer. Clin Cancer Res. 2006;12:1128–1136.
- Iwamori T, Iwamori N, Matsumoto M, et al. Identification of KIAA1210 as a novel X-chromosome-linked protein that localizes to the acrosome and associates with the ectoplasmic specialization in testes. Biol Reprod. 2017;96:469–477.
- Barchitta M, Quattrocchi A, Maugeri A, et al. LINE-1 hypomethylation in blood and tissue samples as an epigenetic marker for cancer risk: a systematic review and meta-analysis. PLoS One. 2014;9:e109478.