
ABSTRACT
Molecular regulation of stem cell differentiation is exerted through both genetic and epigenetic determinants over distal regulatory or enhancer regions. Understanding the mechanistic action of active or poised enhancers is therefore imperative for control of stem cell differentiation. Based on the genome-wide co-occurrence of different epigenetic marks in committed proliferating myoblasts, we have previously generated a 14-state chromatin state model to profile rexinoid-responsive histone acetylation in early myoblast differentiation. Here, we delineate the functional mode of transcription regulators during early myogenic differentiation using genome-wide chromatin state association. We define a role of transcriptional coactivator p300, when recruited by muscle master regulator MyoD, in the establishment and regulation of myogenic loci at the onset of myoblast differentiation. In addition, we reveal an enrichment of loci-specific histone acetylation at p300 associated active or poised enhancers, particularly when enlisted by MyoD. We provide novel molecular insights into the regulation of myogenic enhancers by p300 in concert with MyoD. Our studies present a valuable aptitude for driving condition-specific chromatin state or enhancers pharmacologically to treat muscle-related diseases and for the identification of additional myogenic targets and molecular interactions for therapeutic development.
Abbreviations: MRF: Muscle regulatory factor; HAT: Histone acetyltransferase; CBP: CREB-binding protein; ES: Embryonic stem; ATCC: American type culture collection; DM: Differentiation medium; DMEM: Dulbecco’s Modified Eagle Medium; GM: Growth medium; GO: Gene ontology; GREAT: Genomic regions enrichment of annotations tool; FPKM: Fragments per kilobase of transcript per million; GEO: Gene expression omnibus; MACS: Model-based analysis for ChIP-seq
Introduction
Gene expression programs associated with stem cell differentiation are largely regulated through distal regulatory elements characterized as enhancers, which can be further defined as ‘active’ or ‘poised’ based on the combinations of condition-specific histone modification [Citation1,Citation2]. Studies in hematopoietic stem cells have demonstrated that poised enhancers are established in lineage progenitors before their activation and are involved in gene expression during lineage differentiation [Citation3]. In addition, poised enhancers marked bivalently by H3K4me1 and H3K27me3, are dynamically modified during terminal differentiation and myotube formation where H3K27me3 is replaced by H3K27ac [Citation1,Citation2,Citation4].
While histone acetylation events contribute to gene activation, the patterns of acetylation are diverse and distinct depending on the regulatory loci [Citation5–Citation7]. A comprehensive mapping of 18 histone acetylation marks in CD4+ T cells revealed that H3K9ac, H3K18ac, and H3K27ac are mainly located in regions surrounding the transcription start sites (TSS), whereas H4K8ac is elevated in promoter and transcribed regions of active genes [Citation8,Citation9]. Nonetheless, the correlation of intergenic H3K9ac sites with multiple promoter and enhancer marks has been used to infer that H3K9ac can denote active enhancers as well as bivalent promoters in stem cells [Citation10,Citation11]. Moreover, a combination of H3K4me1 and H3K27ac can serve as a readout of active enhancers [Citation1,Citation2,Citation12,Citation13]. The regulation of enhancer chromatin state thus interjects specific gene expression programs that govern the potential for cellular differentiation. As such, we have previously generated a 14-state chromatin state model based on genome-wide co-occurrence of different epigenetic marks in committed proliferating myoblasts to uncover rexinoid-responsive histone acetylation associated with distinct myogenic loci [Citation14].
The differentiation of skeletal muscle precursors is sequentially regulated by muscle regulatory factors (MRFs). MyoD is involved in the initial step of myoblast differentiation, while myogenin is required for terminal differentiation and formation of multinucleated myotubes [Citation15]. The regulatory networks underlying skeletal muscle development have been studied in detail and, thus, myoblast differentiation provides a well-defined model system to study mechanisms of transcriptional regulation. Remarkably, studies of histone acetylation in the context of terminal differentiation have observed a near-complete loss of H3K9ac in contrast to a high level of H3K18ac on genes activated in myotubes as compared to proliferating myoblasts [Citation4,Citation16]. Furthermore, the association of MyoD to distinct E-box motifs generally corresponds to enhancer assembly, marked by H3K27ac, and muscle-specific gene expression during myotube formation [Citation16,Citation17]. As a result, MyoD binding is an index of myogenic enhancers [Citation1], leading to the recruitment of histone acetyltransferases (HATs), which deposit the acetyl moiety required for enhancer activation [Citation16].
One group of HATs, p300 and CREB-binding protein (CBP), are global coactivators of a variety of transcription factors involved in cell proliferation and differentiation [Citation18–Citation21]. Nonetheless, genetic studies in mice and embryonic stem (ES) cells have clearly shown that the intrinsic HAT activity of p300, but not CBP, is specifically required for skeletal myogenesis and MyoD gene expression [Citation22,Citation23]. Interestingly, depletion of MyoD in myotubes leads to a reduction of H3K27ac, particularly, where the majority of myotube-specific enhancers bound by MyoD are co-occupied with p300 [Citation16]. While H2A and H2B can be acetylated by p300, H3K18 and H3K27 are the major in vivo acetylation targets of p300 [Citation24]. In addition, overexpression of p300 has been correlated to an increased H3K9 acetylation at distinct loci in primary hepatocytes [Citation25]. Therefore, p300 occupancy is known as the best chromatin signature of enhancers and has emerged as a valuable perception to identify novel regulatory elements for studies of transcriptional control, in addition to DNA sequence motifs [Citation2,Citation26–Citation32].
The importance of p300 for an array of cellular processes including skeletal myogenesis and myotube formation is well established [Citation16,Citation22,Citation33,Citation34]. However, the functional mode of transcriptional regulation involving p300 particularly at the early stage of myoblast differentiation remains less clear, given that lineage-specific enhancers and loci-specific acetylation play a pivotal role in the control of genes pertinent to differentiation. In this study, we explore the association of p300 and loci-specific histone acetylation with distinct chromatin states at the onset of myoblast differentiation to discern the concerted action of MyoD and p300 in regulating myogenic expression.
Results
Residue-specific histone acetylation associated with p300 in early myoblast differentiation
While maintaining a high correlation with transcriptional programs of primary myoblasts, C2C12 myoblasts are less prone to spontaneous differentiation [Citation4,Citation35], and thus they are a system of choice for genome-wide studies of histone modification and associated transcriptional regulators, including p300 in myotubes and proliferating myoblasts [Citation16]. To study the role of p300 in the early steps of differentiation, we performed p300 ChIP-seq analysis in C2C12 myoblasts differentiated for 24 hours in comparison to proliferating myoblasts. As a result, 2,060 and 5,405 high confidence p300 peaks were identified in differentiating and proliferating myoblasts, respectively, through model-based analysis for ChIP-seq (MACS) (, S1). Similar to a previous study with proliferating myoblasts [Citation16], the majority of p300 read signals had an average peak coverage of about 500 bp ()). In addition, a greater number of p300 peaks were found in proliferating myoblasts and approximately 58% of p300 peaks in differentiating myoblasts were shared with that in proliferating myoblasts ()), suggesting a role for p300 in the establishment and regulation of muscle-specific loci prior to the commencement of differentiation.
Figure 1. Histone acetylation at p300-associated loci in early myoblast differentiation.
(A) Union analysis of p300 peaks in proliferating C2C12 myoblasts (GM) and myoblasts differentiated for 24 hours (DM). (B) Correlation plot of p300 peak coverage in proliferating and differentiating myoblasts, where each dot represents the absolute length of a p300 peak shared between GM and DM conditions (n = 1190; R = Spearman’s correlation coefficient). (C) Western analysis of p300, myogenin, and the indicated histone marks with β-tubulin as a loading control. (D) Quantification of the blots in panel C is presented as fold change in relation to proliferating myoblasts (error bars: SD; n = 3; **, P <0.01). (E) Annotation of chromatin state association of the p300 peaks as categorized in Panel A. Shown are also the average read enrichment profiles of H4K8ac, H3K9ac, H3K18ac, and H3K27ac spanning 2 kb across the indicated p300 loci annotated above. (F) Boxplots present log2-fold change in signal enrichment at the p300 loci. The differential median between enrichment at p300 loci unique to differentiation or shared are displayed to the right (Wilcoxon signed-rank test, P <0.05).
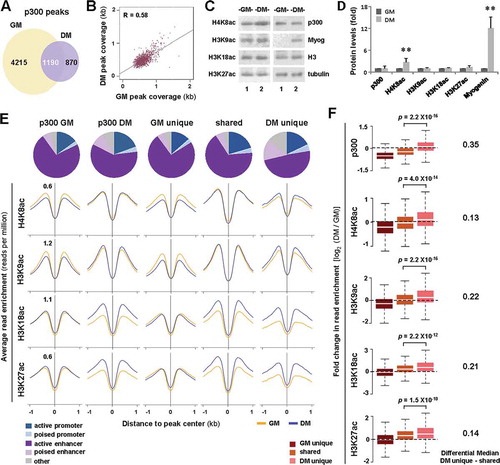
Since p300 HAT activity is critical for myogenic differentiation [Citation22,Citation23], we first used Western blot analysis to examine changes in the global levels of p300 and histone acetylation during early myoblast differentiation. As shown in ), the expression of myogenin, a specific marker of terminal differentiation, was induced (over 10-fold) by 24 hours of differentiation compared to proliferating myoblasts, but the level of p300 protein remained relatively steady. Interestingly, while there were no significant changes in the global levels of H3K9ac, H3K18ac, and H3K27ac by 24 hours of differentiation, the levels of H4K8ac increased by about 2-fold (). By and large, our analyses indicate that if there is a differentiation-dependent change in the levels of p300 and residue-specific histone acetylation, it may occur in a loci-specific manner rather than globally.
Utilizing our previously established chromatin state model based on the genome-wide co-occurrence of different epigenetic marks in proliferating myoblasts [Citation14], we next annotated different categories of p300 read signals through the progression of myoblast differentiation and found that p300 peaks are predominantly associated with active enhancers ()). Nevertheless, p300 signal density appeared increasingly enriched at poised enhancers during early differentiation, as the percentage of p300 peaks assigned to this state increased by about 3-fold, from approximately 5% in unique to proliferation to 15% in unique to differentiation ()), suggesting a role for p300 in the activation of muscle-specific loci during early differentiation.
We next used our previously generated residue-specific histone acetylation ChIP-seq data [Citation14] to profile loci-specific changes in histone acetylation during early myoblast differentiation. As shown in , a differentiation-dependent enrichment was not only observed for H3K18ac and H3K27ac, known acetylation targets of p300 [Citation24], but also for H3K9ac and H4K8ac, particularly at differentiation-unique p300 loci compared to those shared by proliferating and differentiating myoblasts. More importantly, the level of H3K9ac had the largest relative increase among the four acetylation marks examined, corresponding to a similar degree of increase in p300 signal enrichment (). Therefore, the level of p300 occupancy is intimately associated with loci-specific histone acetylation during early myoblast differentiation.
Connection of MRFs with p300 during early myoblast differentiation
To functionally understand the role of p300 in the regulation of early myogenic programs, we next performed GO analysis on shared or unique p300 peaks in relation to myoblast proliferation and differentiation. Interestingly, the GO terms most strongly connected to p300 peaks unique to proliferation were in a broad context of tissue and developmental processes, whereas differentiation-unique p300 peaks were more specifically associated with regulation of signal transduction, protein metabolism and modification ()), suggesting a distinct functional mode for p300 in the regulation of muscle development and maintenance processes.
Figure 2. Functional annotation of p300-associated loci.
(A) GO enrichment analysis of p300-associated loci. Bar graph represents an inversion of binomial ranking for each term as output by GREAT. (B) RT-qPCR analysis of gene expression levels for p300-dependent differentiation responsive targets is presented as fold change relative to proliferating myoblasts, after normalization to internal control (error bars: SEM; n = 3; *, P <0.05). (C) De novo motif analysis of p300 loci, where top-ranked motifs are displayed with P values for the motifs being equal to or lower than the one stated in each category. Percentages of p300 loci bound by the predicted transcription factor motifs are presented as a bar graph to the right.
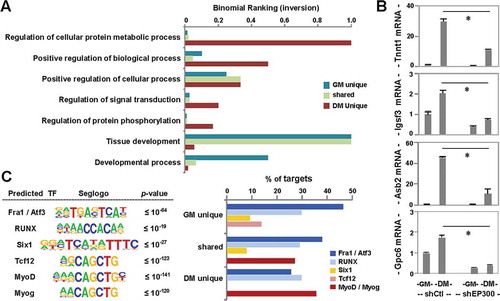
To determine the requirement of p300 for target gene expression, we employed previously established p300 shRNA knockdown myoblasts [Citation36]. As shown in ), the mRNA levels of selected genetic targets identified through our p300 ChIP-seq analysis increased markedly at the early stage of myoblast differentiation. In addition, the expression of these genes was impeded significantly following p300 shRNA knockdown, suggesting that p300 is required for the expression of these differentiation-dependent genes.
Moreover, de novo motif analysis of p300-associated loci revealed that Fra1 and RUNX binding sites were to some extent found amongst all loci examined ()). While Six1 motif [Citation37] was predicted for p300 loci shared or unique to proliferation ()), Tcf12 [Citation38,Citation39] was assigned for p300 loci unique to proliferation. More importantly, MyoD or myogenin binding motifs were found predominantly at p300 loci shared or unique to differentiation ()). Taken together, our analyses suggest that p300 may be recruited mainly by MRFs to muscle-specific targets to mediate, at least in part, histone acetylation necessary for switching from proliferation to differentiation.
Condition-dependent chromatin state distribution of MyoD during early differentiation
Since MyoD is a master regulator of myogenesis, plays a pivotal role in enhancer assembly [Citation16], and may cooperate with p300 to promote early myoblast differentiation ()), we thus also annotated publicly available genome-wide MyoD ChIP-seq data in proliferating C2C12 myoblasts and myoblasts differentiated for 24 hours [Citation40]. Union analysis of MyoD binding sites across the two conditions revealed twice as many MyoD peaks unique to differentiation compared to proliferation ()), highlighting the requirement of MyoD to control the transcriptional program pertinent to differentiation. Similar to p300, MyoD peak coverage had a relatively longer base pair length in proliferating myoblasts ()). Also similar to p300, the association of MyoD to poised enhancers increased substantially during the transition from proliferation to differentiation, from about 20% to 31%, which is more evident between MyoD peaks unique to proliferation and to differentiation, about 17% and 35%, respectively ()). Our analysis thus suggests a specific role for MyoD in the activation of poised enhancers to mediate myoblast differentiation.
Figure 3. Characterization of MyoD sites in early differentiation.
(A) Venn diagram depicts unique or maintained MyoD peaks in C2C12 proliferating myoblasts (GM) and myoblasts differentiated for 24 hours (DM). (B) Correlation plot of MyoD peak coverage, in which each dot represents the absolute length of a MyoD peak, shared between GM and DM conditions (n = 6445; R = Spearman’s correlation coefficient). (C) Chromatin state distribution of MyoD peaks as categorized in Panel A. The average read signal profiles for H4K8ac, H3K9ac, H3K18ac, and K3K27ac spanning 2 kb across MyoD binding sites are displayed below. (D) Boxplots present the quantification of log2-fold change in histone acetylation between differentiation and proliferation corresponding to the MyoD sites as categorized in Panel C. The difference in the median values of differentiation unique or maintained is displayed to the right. (E) The expression levels of ENSEMBL genes associated to the MyoD peaks is presented as FPKM measured by RNA-seq analysis (Wilcoxon signed-rank test, P <0.05).
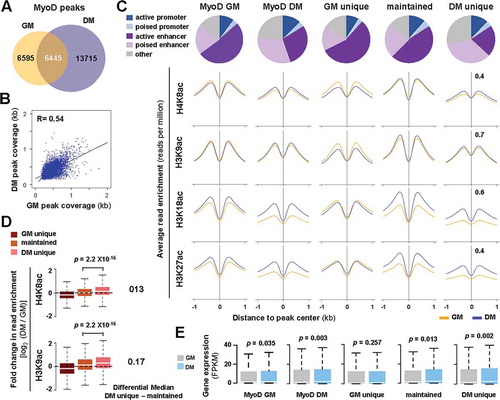
To delineate the mechanistic role of MyoD in early myoblast differentiation, we next quantified the change in residue-specific histone acetylation associated with MyoD peaks. As shown in , a significant increase in the enrichment of H4K8ac and H3K9ac in particular was detected at the MyoD sites by 24 hours of differentiation, in addition to H3K27ac and H3K18ac. Furthermore, target gene expression increased significantly, correlating directly to the differentiation-dependent MyoD association, as determined by condition matching RNA-seq analysis ()) [Citation14]. Interestingly, genes associated to MyoD peaks unique to proliferating myoblasts were the only group that did not exhibit an overall increase in expression during early differentiation. Taken together, our analyses revealed a residue-specific histone acetylation associated with MyoD, which acts as a master regulator to establish myogenic transcription program pertinent to early differentiation [Citation41,Citation42].
Co-localization of MyoD with p300 during early myoblast differentiation
Since both p300 and MyoD were found to increasingly associate with poised enhancers during early myoblast differentiation, we next examined in detail the genome-wide co-localization of p300 and MyoD. As shown in , p300 co-localized with MyoD to a comparable degree, about 32% and 38%, respectively, in proliferating and differentiating myoblasts, reflecting a multi-functional link of MyoD with p300 during myogenesis. Interestingly, an apparent increase in the occupancy of poised enhancers by p300 was observed when p300 co-localized with MyoD, particularly in differentiating myoblasts, from about 8% to 12% ()). Nevertheless, no such increase was found in proliferating myoblasts, in which about 5% of p300 peaks associated with poised enhancers regardless of MyoD co-localization ()). Moreover, when the distance of p300 peaks to the nearest TSS was analyzed, we found that the majority of p300 peaks located in the promoter regions (0 to −1 kb) lacked MyoD overlap ()). On the other hand, more p300 peaks co-localized with MyoD were found distal to the promoters (−1 to −50 kb), in regions which are more likely to be enhancers, active or poised ()). Thus, an increase in p300 recruitment to MyoD-bound poised enhancers may be important for the initiation of myoblast differentiation.
Figure 4. MyoD and p300 overlap in early myoblast differentiation.
(A) The magnitude of overlap between p300 and MyoD peaks in proliferating myoblasts (GM) and myoblasts differentiated for 24 hours (DM) is presented as a percentage of total p300 peaks in each condition. (B) Chromatin state distribution of p300 loci with or without a MyoD overlap. The average read density of histone acetylation spanning 2 kb across corresponding p300 loci is presented below. (C) The distance of p300 peaks with and without a MyoD overlap in relation to the closest TSS is presented as a bar graph. (D) Boxplots present log2-fold change in signal enrichment between differentiating and proliferating conditions at the indicated category of p300 loci. (E) GO analysis of p300 loci with or without a MyoD overlap is plotted as an inversion of binomial ranking as output by GREAT. (F) The expression levels of ENSEMBL genes associated to the indicated categories of p300 peaks are plotted as FPKM measured by RNA-seq analysis (Wilcoxon signed-rank test, P <0.05).
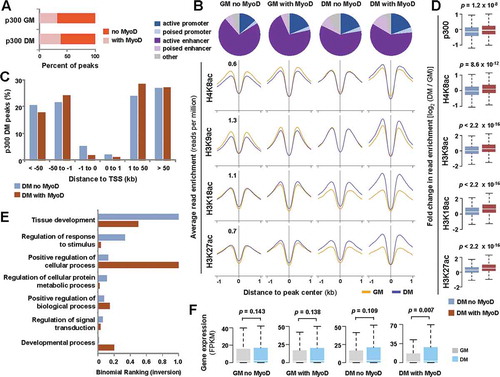
The effect of p300 recruitment by MyoD during differentiation was also signified by an increase in the enrichment of H4K8ac and H3K9ac, principally in the presence of MyoD (). In comparison, H3K18ac and H3K27ac are distinct in that their enrichments were correlated with p300 occupancy during differentiation in the absence of MyoD as well (). We next performed GO analysis to explore the functional differences of p300 occupancy with or without a MyoD overlap in differentiating myoblasts. As shown in ), loci occupied by p300 without MyoD were more connected to genes involved in overall fundamental processes, such as tissue development, while loci co-occupied by p300 and MyoD were mostly linked to genes that participate in positive regulation of cellular and developmental processes. More interestingly, quantification of condition matching RNA-seq data [Citation14] revealed a significant increase in the expression of genes associated with p300 in differentiating myoblasts, but only when co-localized with MyoD ()). Therefore, our data shed new light into the functional mode of p300 when recruited by MyoD at the early stage of myoblast differentiation, in that the changes in loci-specific histone acetylation correlate with differentiation-specific myogenic expression.
Regulation of myogenic enhancers by p300 and MyoD during early differentiation
Since it appears that p300 and MyoD function in concert to promote early myoblast differentiation and that enrichment of both regulators correlates to a specific chromatin state ()), we aimed to explore the dynamics of p300 co-localization with MyoD. By unravelling the profiles of histone acetylation at p300 loci with and without a MyoD overlap, we found that, in the absence of MyoD, an increase in the level of H4K8ac and H3K9ac was only observed at loci classified as poised enhancers between proliferation and differentiation ()). However, an increase in the levels of all histone acetylation marks examined was detected at p300 associated active enhancers in the presence of MyoD ()). Nevertheless, enrichment of these histone acetylation marks was more pronounced at poised enhancers compared to active enhancers, particularly H3K9ac and H4K8ac, the signal read density of which increased by about 2-fold (). Interestingly, at the regions surrounding the TSS, histone acetylation appeared to decline overall during early differentiation, with the exception of H3K18ac and H3K27ac at genes that were upregulated during differentiation (Fig. S2). Thus, H3K9ac and H4K8ac enrichment may be a specific signature of myogenic enhancers, since no such enrichment was observed at the TSS of myogenic programs.
Figure 5. Overlap of p300 and MyoD at distinct chromatin state.
(A) Normalized average H4K8ac, H3K9ac, H3K18ac, and H3K27ac read density in proliferating myoblasts (GM) and myoblasts differentiated for 24 hours (DM) was plotted 2 kb across p300 loci with or without a MyoD overlap at active or poised enhancers. (B) Quantification of log2-fold difference in histone acetylation between differentiation and proliferation as categorized in Panel A. The differential median for signal enrichment is displayed to the right. (C) Genome browser view of p300, MyoD and histone acetylation read density at Tnnt1, Igsf3, Asb2, and Gpc6 loci. Black bars show Refseq gene position and the colors of ChromHMM track below correspond to that designated to each chromatin state as illustrated in ). (D) ChIP-qPCR analysis was performed for identified target loci, using antibodies against p300 and MyoD. Normal IgG antiserum and a random locus (Ctl) were used as negative controls. Quantification is presented as the percentage of enrichment in relation to input chromatin DNA (error bars: SEM; n = 3; *, P <0.05).
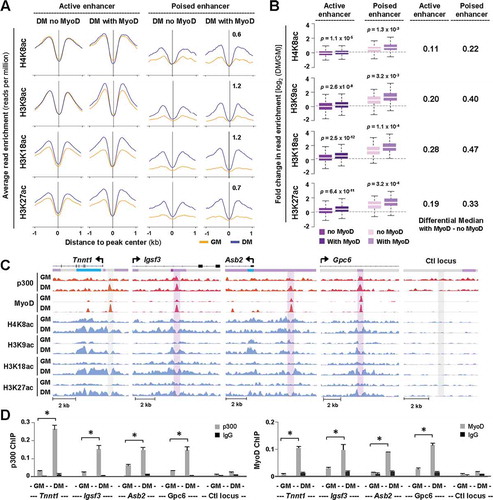
We next examined the association of p300 and MyoD to selected target loci based on the ChIP-seq read coverage and chromatin state association ()), using ChIP-qPCR analysis with normal IgG antiserum and a random locus used as negative controls. As shown in ), the occupancy of p300 to the putative regulatory loci of Tnnt1, Igsf3, Asb2, and Gpc6 was significantly enriched by 24 hours of differentiation, corresponding to a concurrent augmentation in MyoD binding, in addition to the differentiation- and p300-dependent expression pattern of these genes ()). As poised/inactive lineage-specific enhancers play a determinant role in stem cell differentiation [Citation43] and MyoD interacts with p300 [Citation44,Citation45], the recruitment of p300 by MyoD to target loci may thus be important for the expression of muscle-related genes. Therefore, examining the chromatin state associated with differentiation-specific regulators can be applied to delineate the molecular mechanisms by which gene expression is facilitated in a condition-specific manner.
Discussion
Differentiation signaling pathways are affected by both genetic and epigenetic determinants. Given the role of enhancers in driving cell-fate specific gene programs, it is imperative to understand the mechanistic action of enhancers that contribute to cellular differentiation. Here, we utilize genome-wide chromatin state association to delineate the functional mode of transcription regulators in early myogenic differentiation. We define a role for transcriptional coactivator p300, when recruited by MyoD, in the establishment and regulation of myogenic loci during early myoblast differentiation. In addition, we reveal a significant enrichment of loci-specific histone acetylation, particularly of H4K8 and H3K9, at p300-associated active enhancers, but only when enlisted by MyoD. Our studies provide novel mechanistic insights into the action of p300 as a coactivator in early differentiation and its functional mode in the regulation of myogenic enhancers.
Epigenetic modifications of histone tails can be considered an additional evolutionary tool to regulate gene programs. Transient cycles of acetylation and deacetylation of the genes primed by H3K4 methylation create a poised state equipped for future activation [Citation46]. Thus, acetylation of histone tails contributes to the determination of lineage specification and is regulated by several HATs, including p300 [Citation47]. Previous studies have examined the role of p300 in myotube formation by comparing global p300 occupancy and histone modification of mature myotubes generated from C2C12 myoblasts [Citation16]. Although an in vitro system, it mirrors the molecular processes of primary myoblasts; however, C2C12 myoblast are more synchronized to differentiate and fuse into post-mitotic myotubes [Citation4,Citation35]. Comprehensive gene expression analyses have also shown that myogenic differentiation ensues in a stepwise fashion, where sequential activation of a specific set of genes restructures the cells one step at a time toward the differentiated phenotype [Citation48]. Nonetheless, at the early stage of the differentiation, thousands of genes are differentially expressed [Citation14,Citation49,Citation50], mostly within 24 hours of differentiation. As a result, epigenetic changes reflecting the alteration of gene programs should occur. Therefore, the focus of our study is not only to examine the transient chromatin dynamics that initiate and drive early myoblast differentiation, but also to explore the functional mode of p300 in regulating gene expression coupled to specific chromatin states.
By mapping globally p300-associated loci, we show that a majority of p300 peaks are localized to enhancer regions (), in agreement with previous reports [Citation8,Citation16]. However, a substantial fraction of p300 peaks distribute specifically to the poised enhancer, accompanied particularly by loci-specific histone acetylation in early myoblast differentiation (). Binding of MyoD to myogenic enhancers in proliferating myoblasts leads to concomitant recruitment of p300 and deposition of H3K27ac [Citation16]. The recruitment of p300 principally by MyoD in early differentiation () suggests that enhancers identified through chromatin state association reflect the development of the skeletal lineage, which forms the rationale for us to explore the genome-wide presence of MyoD in proliferating and differentiating myoblasts. Interestingly, the number of MyoD binding sites increases significantly in early differentiation (), in line with previous studies [Citation51,Citation52]. Similar to p300, the MyoD peaks tend to be wider while switching from proliferation to differentiation ( and ), possibly due to a broader DNA coverage by MyoD in early differentiation or a simple reflection of the difference in chromatin organization between the two cell stages.
In addition, a greater number of MyoD sites localized to poised enhancers in early differentiation (). By comparing MyoD peaks specific to differentiation and proliferation, we reveal an increase in loci-specific histone acetylation, but H4K8 and H3K9 acetylation are distinct in that their enrichments are differentiation dependent (). We also show that the distance of p300 peaks to the nearest TSS increases with a MyoD overlap, implying that p300 recruited by MyoD occurs to distal regulatory regions, possibly for potential enhancer activities. Intriguingly, the average histone acetylation profiles spanning MyoD peaks between differentiation in general and unique to differentiation are rather similar, which may be due to the large number of differentiation unique peaks encapsulated within the total differentiation peaks, in addition to perhaps a differentiation related requirement for MyoD peaks maintained between differentiation and proliferation ().
More importantly, there is an apparent increase in the occupancy of poised enhancers by p300 in differentiating myoblasts coinciding with MyoD, whereas no such increase is found in the proliferating stage, suggesting a functional relationship between p300 and MyoD in the establishment or activation of poised enhancers during differentiation (). This relationship is further signified by an enrichment of H4K8ac and H3K9ac, largely in the presence of MyoD in contrast to H3K18ac and H3K27ac, which were enriched at p300 loci in the absence of MyoD as well. The augmentation of H4K8ac and H3K9ac persists at p300-associated active enhancers, but only when p300 overlaps with MyoD (). While H3K9ac has been correlated to active enhancers [Citation10], H4K8ac and H3K9ac are generally considered as global marks of promoter activity [Citation8]. Our study identifies these acetylation marks at both poised and active enhancers coupling with MyoD at the early stage of differentiation. Collectively, our data suggest a role for MyoD in p300 recruitment at lineage-specific enhancers to regulate muscle-related genes, as exemplified by the muscle-specific target Tnnt1 ( and ).
In this study, we have identified a key lineage-specific regulatory signature and present a blueprint to explore novel regulators of myogenic differentiation. We provide evidence for the enrichment of not only H3K27ac, but also H4K8ac and, specifically, H3K9ac at MyoD-associated enhancers specific to myoblast differentiation ()). While some parallels between our data and previous genome-wide studies in myotubes [Citation4,Citation16] exist, our studies present critical new findings. An example relates to the state of global histone acetylation of H3K9 and H3K18. The previous study comparing myotubes to proliferating myoblasts [Citation4] presents a decrease in global histone acetylation levels following 3 days of differentiation, whereas our studies show no significant change in global histone acetylation in myoblasts differentiated for 24 hours. We provide evidence that the differentiation process is mediated by transformations in residue-specific histone acetylation at lineage-specific loci, rather than global histone acetylation events. Our data compilation thus reflects the transformations required to move the proliferating myoblasts into differentiation and provide greater insights into epigenetic changes that govern myogenic differentiation.
Here, we offer a novel molecular insight into the modification of myogenic enhancers by loci-specific histone acetylation in concert with p300 and muscle master regulator MyoD. Our data suggest the intriguing possibility that cellular stage may be regulated through alteration of distinct chromatin states. It thus presents a valuable potential of driving chromatin state pharmacologically for the treatment of tissue-specific diseases. Future prospects will therefore determine the functional capacity of the myogenic enhancers identified in a specific physiological context. The model of p300-associated cellular stage-specific enhancers provides an excellent system to initiate the identification of additional myogenic targets and molecular interactions for therapeutic development towards muscle-related diseases.
Materials and methods
Cell culture and western blot analysis
C2C12 myoblasts (ATCC) and the p300 shRNA knockdown cells [Citation36] were maintained in proliferating conditions at a confluency lower than 70% in Dulbecco’s Modified Eagle Medium (DMEM) supplemented with 10% FBS (GM) at 37ºC with 5% CO2. Myoblasts were induced to differentiate at about 80% confluence using differentiation medium (DM, DMEM medium containing 2% horse serum). Whole cell extracts were prepared for protein immunoblotting, as described previously [Citation53]. Scion Image Software (Scion Corp.) was used for protein band quantification, where band intensities were measured and corrected for against the background of the images. The antibodies used in this study for H4K8ac, H3K9ac, H3K18ac, and H3K27ac were obtained from Abcam (ab15823, ab4441, ab1191, ab4729, respectively), while anti-p300 and anti-MyoD were from Santa Cruz (sc-584x, sc-32758x, respectively). Myogenin antibody was from hybridoma F5D and anti-tubulin from hybridoma E7 [Citation54].
ChIP-seq and data processing
Chromatin immunoprecipitation was performed by standard procedures, as previously described [Citation55], followed by sonication with a Covaris S220 Ultra-Sonicator system. Chromatin DNA was purified using the MinElute Spin Columns Kit (Qiagen). ChIP-seq library preparation and sequencing were performed by the McGill University Genome Quebec Innovation Centre with Illumina HiSeq 2000 as single-end 50 nucleotide reads, according to Illumina instructions with input chromatin DNA used as control. Sequencing data was mapped to the mm9 assembly of the mouse genome with BWA-MEM [Citation56], marking shorter split hits as secondary, and processed for visualization of ChIP-seq signals, as previously described [Citation14]. Peak detection was performed using the MACS software [Citation57], whereas de novo motif discovery was completed with Homer [Citation58] on the 100 base pairs surrounding the center of the peaks. Homer was employed to classify overlapping peaks that were defined as being co-localized within 100 bp of one another. Peak annotation followed by gene ontology (GO) was performed by GREAT v3.0.0 [Citation59], utilizing the whole genome as background and the single nearest gene association rule.
Quantification of histone acetylation profiles and transcription factor binding sites
The average ChIP-seq enrichment was calculated and visualized by ngs.plot [Citation60] with respect to specific genomic features or defined regions. The analysis tool calculates the coverage vectors for each alignment file followed by normalization and transformation to generate an average profile that displays the average number of reads normalized to the total number of mapped reads (in millions), centered at a specified region. Significance between conditions was calculated with the two-sided Wilcoxon signed-rank test.
Reverse transcription qPCR and qChIP analysis
For RT-qPCR, total RNA was isolated using the GeneJET RNA Purification Kit (ThermoFisher Scientific) and equal amounts of RNA were reverse-transcribed using a High Capacity cDNA Reverse Transcription Kit (Applied Biosystems). RT-PCR amplification was conducted using SYBR® Green PCR Master Mix and HotStarTaq DNA polymerase (Qiagen) on a CFX96 Touch Real-Time PCR Detection System (BioRad). Quantification of the targets, normalized to endogenous reference and relative to a calibrator control, was calculated using the formula 2–ΔΔCT. Data are presented as the mean ± S.E.M, where P values were determined using a student’s t-test. All relevant primers are listed in Table S2 [Citation61–Citation63]. For qChIP, purified chromatin DNA was amplified in triplicate real-time PCR reactions with locus-specific primers described in Table S2. A standard curve was created for each set of primers with input DNA, followed by quantification of the abundance of locus-specific DNA as a percentage of input DNA.
Availability of data
The ChIP-seq data generated and analyzed for this study (Table S1) are deposited in the Gene Expression Omnibus (GEO) database and are accessible through GEO Series accession number GSE109636. Supplemental data for this article can be accessed on the publisher’s website.
Supplemental Material
Download PDF (258.2 KB)Acknowledgments
We thank Mr. Yan Mach for his excellent assistance in data processing and our colleagues for a supportive research environment.
Disclosure statement
No potential conflict of interest was reported by the authors.
Supplementary Material
Supplemental data for this article can be accessed here.
Additional information
Funding
Related Research Data
References
- Creyghton MP, Cheng AW, Welstead GG, et al. Histone H3K27ac separates active from poised enhancers and predicts developmental state. Proc Natl Acad Sci. 2010;107:21931–21936.
- Rada-Iglesias A, Bajpai R, Swigut T, et al. A unique chromatin signature uncovers early developmental enhancers in humans. Nature. 2011;470:279–283.
- Lara-Astiaso D, Weiner A, Lorenzo-Vivas E, et al. Chromatin state dynamics during blood formation. Science. 2014;345(80):943-9.
- Asp P, Blum R, Vethantham V, et al. Genome-wide remodeling of the epigenetic landscape during myogenic differentiation. Proc Natl Acad Sci U S A. 2011;108:E149–58.
- Lee DY, Hayes JJ, Pruss D, et al. A positive role for histone acetylation in transcription factor access to nucleosomal DNA. Cell. 1993;72:73–84.
- Roh T-Y, Cuddapah S, Zhao K. Active chromatin domains are defined by acetylation islands revealed by genome-wide mapping. Genes Dev. 2005;19:542–552.
- Eberharter A, Becker PB. Histone acetylation: a switch between repressive and permissive chromatin. Second in review series on chromatin dynamics. EMBO Rep. 2002;3:224–229.
- Wang Z, Zang C, Rosenfeld JA, et al. Combinatorial patterns of histone acetylations and methylations in the human genome. Nat Genet. 2008;40:897–903.
- Halsall J, Gupta V, O’Neill LP, et al. Genes are often sheltered from the global histone hyperacetylation induced by HDAC inhibitors. Cotterill S, Editor. PLoS One. 2012;7:e33453.
- Karmodiya K, Krebs AR, Oulad-Abdelghani M, et al. H3K9 and H3K14 acetylation co-occur at many gene regulatory elements, while H3K14ac marks a subset of inactive inducible promoters in mouse embryonic stem cells. BMC Genomics. 2012;13:424.
- Azuara V, Perry P, Sauer S, et al. Chromatin signatures of pluripotent cell lines. Nat Cell Biol. 2006;8:532–538.
- Heintzman ND, Hon GC, Hawkins RD, et al. Histone modifications at human enhancers reflect global cell-type-specific gene expression. Nature. 2009;459:108–112.
- Zentner GE, Tesar PJ, Scacheri PC. Epigenetic signatures distinguish multiple classes of enhancers with distinct cellular functions. Genome Res. 2011;21:1273–1283.
- Hamed M, Khilji S, Dixon K, et al. Insights into interplay between rexinoid signaling and myogenic regulatory factor-associated chromatin state in myogenic differentiation. Nucleic Acids Res. 2017 ;45:11236-11248.
- Moncaut N, Rigby PWJ, Carvajal JJ. Dial M(RF) for myogenesis. FEBS J. 2013;280:3980–3990.
- Blum R, Vethantham V, Bowman C, et al. Genome-wide identification of enhancers in skeletal muscle: the role of MyoD1. Genes Dev. 2012;26:2763–2779.
- Fong AP, Yao Z, Zhong JW, et al. Genetic and epigenetic determinants of neurogenesis and myogenesis. Dev Cell. 2012;22:721–735.
- Chakravarti D, LaMorte VJ, Nelson MC, et al. Role of CBP/P300 in nuclear receptor signalling. Nature. 1996;383:99–103.
- Goodman RH, Smolik S. CBP/p300 in cell growth, transformation, and development. Genes Dev. 2000;14:1553–1577.
- Chen J, Li Q. Life and death of transcriptional co-activator p300. Epigenetics. 2011;6:957–961.
- Arany Z, Sellers WR, Livingston DM, et al. E1A-associated p300 and CREB-associated CBP belong to a conserved family of coactivators. Cell. 1994;77:799–800.
- Polesskaya A, Naguibneva I, Fritsch L, et al. CBP/p300 and muscle differentiation: no HAT, no muscle. EMBO J. 2001;20:6816–6825.
- Roth J-F, Shikama N, Henzen C, et al. Differential role of p300 and CBP acetyltransferase during myogenesis: p300 acts upstream of MyoD and Myf5. EMBO J. 2003;22:5186–5196.
- Jin Q, Yu L-R, Wang L, et al. Distinct roles of GCN5/PCAF-mediated H3K9ac and CBP/p300-mediated H3K18/27ac in nuclear receptor transactivation. EMBO J. 2011;30:249–262.
- Bricambert J, Miranda J, Benhamed F, et al. Salt-inducible kinase 2 links transcriptional coactivator p300 phosphorylation to the prevention of ChREBP-dependent hepatic steatosis in mice. J Clin Invest. 2010;120:4316–4331.
- Heintzman ND, Stuart RK, Hon G, et al. Distinct and predictive chromatin signatures of transcriptional promoters and enhancers in the human genome. Nat Genet. 2007;39:311–318.
- Blow MJ, McCulley DJ, Li Z, et al. ChIP-Seq identification of weakly conserved heart enhancers. Nat Genet. 2010;42:806–810.
- Visel A, Blow MJ, Li Z, et al. ChIP-seq accurately predicts tissue-specific activity of enhancers. Nature. 2009;457:854–858.
- May D, Blow MJ, Kaplan T, et al. Large-scale discovery of enhancers from human heart tissue. Nat Genet. 2011;44:89–93.
- Shen Y, Yue F, McCleary DF, et al. A map of the cis-regulatory sequences in the mouse genome. Nature. 2012;488:116–120.
- Schwaiger M, Schönauer A, Rendeiro AF, et al. Evolutionary conservation of the eumetazoan gene regulatory landscape. Genome Res. 2014;24:639–650.
- Nègre N, Brown CD, Ma L, et al. A cis-regulatory map of the drosophila genome. Nature. 2011;471:527–531.
- Vo N, Goodman RH. CREB-binding protein and p300 in transcriptional regulation. J Biol Chem. 2001;276:13505–13508.
- Chan HM, La Thangue NB. p300/CBP proteins: hATs for transcriptional bridges and scaffolds. J Cell Sci. 2001;114:2363–2373.
- Blais A, Tsikitis M, Acosta-Alvear D, et al. An initial blueprint for myogenic differentiation. Genes Dev. 2005;19:553–569.
- Chen J, Wang Y, Hamed M, et al. Molecular Basis for the Regulation of Transcriptional Coactivator p300 in Myogenic Differentiation. Sci Rep. 2015;5:13727.
- Laclef C, Hamard G, Demignon J, et al. Altered myogenesis in Six1-deficient mice. Development. 2003;130:2239–2252.
- Zhang Y, Babin J, Feldhaus AL, et al. HTF4: a new human helix-loop-helix protein. Nucleic Acids Res. 1991;19:4555.
- Hu JS, Olson EN, Kingston RE. HEB, a helix-loop-helix protein related to E2A and ITF2 that can modulate the DNA-binding ability of myogenic regulatory factors. Mol Cell Biol. 1992;12:1031–1042.
- Yue F, Cheng Y, Breschi A, et al. A comparative encyclopedia of DNA elements in the mouse genome. Nature. 2014;515:355–364.
- Bergstrom DA, Penn BH, Strand A, et al. Promoter-specific regulation of MyoD binding and signal transduction cooperate to pattern gene expression. Mol Cell. 2002;9:587–600.
- Tapscott SJ. The circuitry of a master switch: MyoD and the regulation of skeletal muscle gene transcription. Development. 2005;132:2685–2695.
- Xu J, Watts JA, Pope SD, et al. Transcriptional competence and the active marking of tissue-specific enhancers by defined transcription factors in embryonic and induced pluripotent stem cells. Genes Dev. 2009;23:2824–2838.
- Puri PL, Sartorelli V, Yang XJ, et al. Differential roles of p300 and PCAF acetyltransferases in muscle differentiation. Mol Cell. 1997;1:35–45.
- Sartorelli V, Huang J, Hamamori Y, et al. Molecular mechanisms of myogenic coactivation by p300: direct interaction with the activation domain of MyoD and with the MADS box of MEF2C. Mol Cell Biol. 1997;17:1010–1026.
- Wang Z, Zang C, Cui K, et al. Genome-wide mapping of HATs and HDACs reveals distinct functions in active and inactive genes. Cell. 2009;138:1019–1031.
- Gan Q, Yoshida T, McDonald OG, et al. Concise review: epigenetic mechanisms contribute to pluripotency and cell lineage determination of embryonic stem cells. Stem Cells. 2007;25:2–9.
- Delgado I, Huang X, Jones S, et al. Dynamic gene expression during the onset of myoblast differentiation in vitro. Genomics. 2003;82:109–121.
- Trapnell C, Williams BA, Pertea G, et al. Transcript assembly and quantification by RNA-Seq reveals unannotated transcripts and isoform switching during cell differentiation. Nat Biotechnol. 2010;28:511–515.
- Doynova MD, Markworth JF, Cameron-Smith D, et al. Linkages between changes in the 3D organization of the genome and transcription during myotube differentiation in vitro. Skelet Muscle. 2017;7:5.
- Cao Y, Yao Z, Sarkar D, et al. Genome-wide MyoD binding in skeletal muscle cells: a potential for broad cellular reprogramming. Dev Cell. 2010;18:662–674.
- Cui H, Bansal V, Grunert M, et al. Muscle-relevant genes marked by stable H3K4me2/3 profiles and enriched MyoD binding during myogenic differentiation. Mantovani R, editor. PLoS One. 2017;12:e0179464.
- Chen J, St-Germain JR, Li Q. B56 Regulatory subunit of protein phosphatase 2A mediates valproic acid-induced p300 degradation B56 regulatory subunit of protein phosphatase 2A mediates valproic acid-induced p300 degradation. Mol Cell Biol. 2005;25:525–532.
- Le May M, Mach H, Lacroix N, et al. Contribution of retinoid X receptor signaling to the specification of skeletal muscle lineage. J Biol Chem. 2011;286:26806–26812.
- Hamed M, Khilji S, Chen J, et al. Stepwise acetyltransferase association and histone acetylation at the Myod1 locus during myogenic differentiation. Sci Rep. 2013;3:2390.
- Li H, Durbin R. Fast and accurate short read alignment with Burrows-Wheeler transform. Bioinformatics. 2009;25:1754–1760.
- Zhang Y, Liu T, Meyer CA, et al. Model-based analysis of ChIP-Seq (MACS). Genome Biol. 2008;9:R137.
- Heinz S, Benner C, Spann N, et al. Simple combinations of lineage-determining transcription factors prime cis-regulatory elements required for macrophage and B cell identities. Mol Cell. 2010;38:576–589.
- McLean CY, Bristor D, Hiller M, et al. GREAT improves functional interpretation of cis-regulatory regions. Nat Biotechnol. 2010;28:495–501.
- Shen L, Shao N, Liu X, et al. ngs.plot: quick mining and visualization of next-generation sequencing data by integrating genomic databases. BMC Genomics. 2014;15:284.
- Di Padova M, Caretti G, Zhao P, et al. MyoD acetylation influences temporal patterns of skeletal muscle gene expression. J Biol Chem. 2007;282:37650–37659.
- Usardi A, Iyer K, Sigoillot SM, et al. The immunoglobulin-like superfamily member IGSF3 is a developmentally regulated protein that controls neuronal morphogenesis. Dev Neurobiol. 2017;77:75–92.
- D’Angelo MA, Gomez-Cavazos JS, Mei A, et al. A change in nuclear pore complex composition regulates cell differentiation. Dev Cell. 2012;22:446–458.