
 ?Mathematical formulae have been encoded as MathML and are displayed in this HTML version using MathJax in order to improve their display. Uncheck the box to turn MathJax off. This feature requires Javascript. Click on a formula to zoom.
ABSTRACT
The relationship between CpG content and DNA methylation has attracted considerable interest in recent years. Direct or indirect methods have been developed to investigate their regulatory functions based on various hypotheses, large cohort studies, and meta-analyses. However, all of these analyses were performed at units of CpG blocks and, thus, the influence of finer genome structure has been neglected. Herein, we present a novel algorithm of base-pair resolution to systematically investigate the relationship between CpG contents and DNA methylation. By introducing the concept of ‘complementary index’ we examined the methylomes of 34 adult and 7 embryonic tissues and successfully fitted the relationship of DNA methylation and CpG density into a nonlinear mathematical model. A further algorithm was developed to locate the regions where CpG density does not match expectations from the model, termed ‘conflict of gap’ (COG) regions. Interestingly, COGs are highly concordant in human and mouse and their distributions display a tissue-specific pattern. Based on COG methylation patterns we correctly classified tissues according to their function or origin. We demonstrate that COGs based on our method can reveal more and deeper information than traditional differential methylation region (DMR) approaches. We also found that when COGs are located near to transcription start site (TSS), these regions can determine which promoters will be utilized for initiating gene transcription. Furthermore, COGs located far from the TSS perform as enhancers in terms of histone modification, sequence conservation, transcription factor binding, and DNase I-hypersensitivity.
Introduction
Vertebrate genomes have a global CpG-poor landscape that is interspersed with stands of CpG islands (CGI) [Citation1,Citation2]. DNA methylation, which occurs almost exclusively at 5-cytosine of CpG context in most tissues, is greatly modulated by such CpG landscape [Citation3]. CpG-poor regions often exhibit hypermethylation, while CpG-dense regions often exhibit hypomethylation [Citation4]. The inverse correlation between DNA methylation and CpG density has been demonstrated by numerous studies using various traditional methylation-investigating approaches [Citation4], and was recently further validated by large-scale sequencing studies [Citation5–Citation7]. In addition to a large cohort surveys and meta-analyses, examination of the relationship between CpG content and DNA methylation is well documented in the literature, including many recent works testing direct regulatory mechanisms [Citation8] or combining CpG content with motifs [Citation9,Citation10]. Analysis of 580,427 CpG sites in more than 28,000 subclones, found that about half of the low-CpG density amplicons were highly methylated, while only 10% high-CpG density amplicons showed the same level of methylation. This suggests that CpG density is a better indicator than G + C content for the methylation states of amplicons [Citation5]. Methylation profiling of more than 275 million CpG sites in human and mouse tissues also found that methylation levels fell sharply at high CpG densities [Citation7].
DNA methylation patterns are thought to be established during embryonic development and are then faithfully inherited in somatic cells by the so called ‘maintenance mechanism’ [Citation11,Citation12]. DNA methyltransferase 1 (DNMT1), the maintenance DNMT, can preferentially recognize the unmethylated cytosine on the nascent strand in a methylated CpG context during DNA replication [Citation13]. The de novo DNMTs, i.e., DNMT3a and DNMT3b, are responsible for establishing the proper methylation patterns during early embryonic development on the genome recently contributed to by both parents, which had become almost devoid of methylation due to the rapid and extensive demethylation process prior to implantation [Citation14,Citation15]. This classical model has served us well for many years. However, experimental observations have been accumulating that do not fit with this model [Citation16,Citation17], including the measurable proportion of hemimethylated CpG sites [Citation18], active removal of methyl groups by demethylation pathways [Citation19,Citation20], low methylation fidelity [Citation21,Citation22], and group behavior of methylation that is not predictable from a model where CpG sites are independent [Citation16]. More complex models have been proposed [Citation16,Citation17] that require the cooperativity of different DNMT enzymes, as well as other proteins such as ubiquitin-like plant homeodomain and RING finger domain-containing protein 1 (UHRF1), proliferating cell nuclear antigen (PCNA), euchromatic histone lysine methyltransferase 2 (EHMT2), or even demethylases [Citation16]. These new observations and models suggest that maintaining the methylation landscape is an intricate and costly process.
The landscape of CpG dinucleotide is believed to be molded, at least partially, by DNA methylation [Citation1,Citation4]. In vertebrates, CpG is the only dinucleotide context that exhibits abundant methylation [Citation3,Citation14]. The spontaneous deamination of 5mC to thymine creates C to T mismatches, whose removal by thymine DNA glycosylase is insufficiently effective [Citation23], thereby leading to overall underrepresentation of CpG dinucleotide by generating many long-run CpG depleted regions [Citation1]. Invertebrate DNA displays almost no methylation and, as a result, CpG occurs at an expected frequency throughout the genome [Citation4]. The CpG methylated sites and the regions without CpG depletion probably have been preserved by selective pressure in vertebrate genomes throughout evolution, which eventually generated the inversely correlated landscape of DNA methylation and CpG density [Citation1,Citation2,Citation4,Citation16]. Actually, such arrangement of the CpG and methylation landscape has important biological significance [Citation14,Citation24]. The typical CpG-dense regions, CGIs, are present in approximately 70% of annotated gene promoters, including virtually all housekeeping genes and a great proportion of tissue-specific genes and developmental regulator genes [Citation25]. Vacancy of methylation at CGIs ensures the unimpeded transcription of physiologically important genes [Citation14]. Global hypermethylation at CpG-poor regions is involved in various key biological processes, such as X chromosome inactivation, imprinting, the silencing of germline-specific genes, suppressing repetitive elements transposition, and inhibiting promiscuous promoter initiation [Citation6,Citation14,Citation23].
A deviation in these methylation landscapes could lead to severe biological consequences [Citation12,Citation24,Citation26–Citation28]. This was shown in a mice study with disrupted DNMT1, in which DNA methylation was globally decreased and the inverse correlation between DNA methylation and CpG density was notably blurred. The authors of this study reported that the disrupted DNMT1 mice did not survive past mid-gestation [Citation13]. Embryonic or postnatal lethality was also reported in mice with disrupted DNMT3A or 3B due to aberrant methylation pattern [Citation15]. Disrupted correlation of DNA methylation and CpG density has been reported in various cancers [Citation29], characterized by hypermethylation in transcription start site (TSS) associated CGIs, which have high CpG density and usually low methylation in normal tissues [Citation26,Citation30]. Furthermore, in cancer, hypomethylation occurs globally across the genome, which mostly has low CpG density and high methylation in normal tissues [Citation27,Citation31].
Although the inverse correlation between DNA methylation and CpG distribution has been observed in various species [Citation4,Citation14,Citation24], and a deviation of such a correlation would lead to severe disorders [Citation24,Citation27,Citation28,Citation32], no approach is currently available to quantitatively describe this inverse correlation or to locate the aberrant regions that deviate from such a correlation. In this study, by exploiting the methylomes from over forty tissues, we developed an algorithm to mathematically describe the pattern of DNA methylation and CpG density to allow the detection of deviated regions. We also report that the deviated regions may dictate the expression of genes that are important for tissue specification, irrespective of their distance to the transcription start.
Results
The distribution of CpG dinucleotides changes with evolutionary diversification
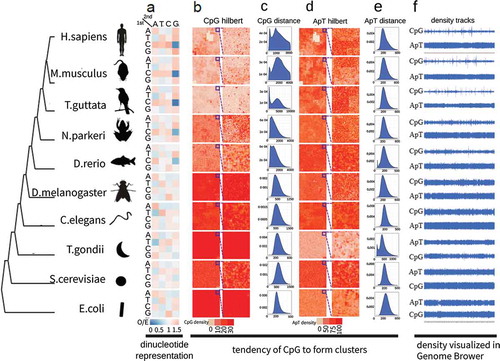
To investigate the representation of CpG dinucleotide in evolutionarily divergent organisms, the observed-to-expected ratios (O/E) of all 16 dinucleotide combinations were calculated for the genomes of 10 species ranging from E. coli to human. The O/E of CpG dinucleotide progressively diminishes from 1.2 in E. coli to 0.2 in human, while other dinucleotides remain stable at around 1.0 (, S1, and Supplementary Table 1). Furthermore, the distribution of CpG dinucleotide is also changed throughout the evolutionarily pathway, as illustrated by the Hilbert curves which are two-dimensional representations of one-dimensional data while keeping local features of the data (see methods) ()). CpG sites tend to form clusters and this tendency becomes more and more obvious along the lineage to higher vertebrates, as shown by the spots on Hilbert curves, which are fairly clear in T. guttata, mice, and human, yet become obscure in D. rerio and N. parkeri, and are almost invisible in other species () and S2). The phenomenon of forming two peaks in the inter-distance distributions of CpG sites provides extra evidence. The tendency of forming two separate peaks becomes more and more clear along vertebrate evolution, suggesting that some CpG sites cluster together with short distance apart, while others spread out with longer distance apart () and S3). On the contrary, no cluster forming tendencies were observed for the other dinucleotides (, S4 and S5). The density tracks on ) and S6 show the formation of sharp peaks intervened with a long range of flatten valleys, while other dinucleotides appear as even plateaus.
Figure 1. Clustering tendency of CpG dinucleotide changes with evolutionary divergence. (a) O/E heat maps of all 16 dinucleotides in ten species representing an evolutionary progression towards higher vertebrates. The 1st and 2nd base of dinucleotides are shown at left and top respectively. The color denotes O/E values. (b) 2D Hilbert curves of CpG dinucleotide. CpG density is denoted by red color. Chromosome 1 is used here except E. coli for which whole genome is used. A blowout at the right to show the details of a part of the whole chromosome/genome. (c) Histograms of the distances (bp) between a CpG site and its following 25th CpG site along genome. The first peaks indicate the existence of clustered CpGs whose distances are short, while the major peaks represent the average distances between CpGs in the genome. (d) 2D Hilbert curves of ApT dinucleotides. (e) Histograms of the distances (bp) between an ApT site and its following 25th ApT site along genome. (f) Tracks of CpG density and ApT density in UCSC genome browser. CpG and ApT densities were calculated as the occurrences in 2500 bp sliding windows.
The altered distribution of CpG dinucleotide complementarily matches DNA methylation
CpG density is inversely correlated with DNA methylation, as shown by CpG islands with dense CpGs that usually possess low DNA methylation levels while genomic regions with sparse CpGs usually have high DNA methylation levels [Citation1,Citation6,Citation16]. To systematically investigate the correlation between CpG dinucleotide and DNA methylation, we applied, to the whole-genome bisulphite sequencing (WGBS) data from mouse cerebellum, the sliding window approach that shifted one base each time and calculated CpG density and methylation level in each window. Most windows had CpG density lower than 50 and DNA methylation levels higher than 80% (Figure 2(a)). Some windows with CpG density greater than 100 had low methylation levels of less than 10%, which together led to a correlation coefficient of −0.726 ()). The same trend was also observed in other mouse and human tissues, as well as at different mice developmental stages (Figure S7). To take a closer look at the inverse correlation between CpG density and DNA methylation, we cut CpG density into more than 300 levels and the average DNA methylation was calculated for each level. Clear inverse correlations were observed in 18 human tissues and 16 mouse tissues, and at 6 developmental stages in the mouse () and S8). Such inverse correlation was also observed along the gene body from transcription start site (TSS) to transcription end site (TES) ()). The gene groups with higher CpG density exhibited overall lower DNA methylation. Along the gene body, CpG density gradually went down, meanwhile DNA methylation went up at almost the same pace as CpG density, making them become mirror images of each other, irrespective of whether the human ()) or mouse genome was observed (Figure S9). The window size used in the above analyses was 2500 bp and it was of note that, in this sliding window analysis, the inverse correlation between CpG density and DNA methylation was independent of window size used (Figure S10).
Figure 2. Negative correlation and complementary matching between CpG density and DNA methylation. (a) Density map of CpG density and DNA methylation. The scatter plot between CpG density and DNA methylation was converted to density map via two-dimension kernel density estimation to avoid overploting. Chromosome 18 in mouse cerebellum tissue was used here. CpG density was calculated as the occurrences of CpG sites in each 2500 bp sliding window. DNA methylation was calculated using the grand method in each 2500 bp sliding window. The histograms of DNA methylation and CpG density are at the top and right respectively. Cor denotes Pearson correlation coefficient. (b) The inverse correlation of DNA methylation for binned CpG density. Data were from chromosome 15 of each of the 18 human tissues. Shown at upper right corner is the mean ± SD of Pearson correlation coefficient of 18 tissues. (c) The inverse correlation of DNA methylation and CpG density along gene body. All mouse known genes (n = 32,595) were divided into 10 groups according to CpG density height of promoter regions, and each gene was further divided into 40 bins along gene body from transcription start site to transcription end site. In each bin of each group, the average CpG density and DNA methylation were calculated (d) Overall complementary matches in UCSC genome browser. DNA methylation (mouse bone marrow tissue) and CpG density were shown separately for Watson (above the baseline) and Crick (below the baseline) strands. (e) Complementary matches under one unified scale. Scales of DNA methylation and CpG density were unified to the range of 0 to 1 by modified Min-Max rescaling and plotted in one graph. (f) Histograms of Complementary index. Data were from chromosome 19 of aorta tissue and bone marrow tissue for human and mouse respectively. (g) Percentage of complementary (complementary index >70%) and uncomplimentary (complementary index <70%) sites in promoter, intergenic and gene body regions in human and mouse genome.
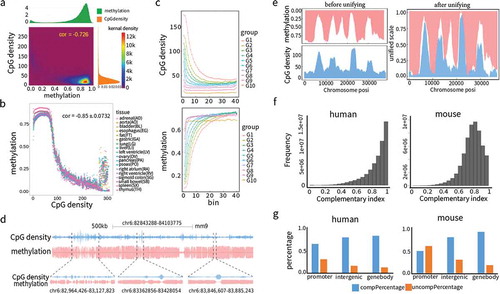
The sliding window approach is able not only to globally reveal the inverse correlation between CpG density and DNA methylation, but also to quantitatively measure the degree of such an inverse correlation. CpG density exhibited a pattern of long low-lying area occasionally intervened with sharp peaks, which matched well with the pattern of DNA methylation of vast plateaus occasionally intervened with deep valleys (), S11 and S12). Putting them together after unifying their scales, the peaks of CpG density just wedged into the valleys of DNA methylation ()). We introduced the term ‘complementary index’ (CI) to systematically assess how well CpG density matched with DNA methylation. Most CpG sites showed high complementarity, with an average CI of 0.864 in human adrenal tissue and 0.8273 in mouse lung tissue, with about 85.8% and 78.1% CpG sites having CIs of no less than 70% in human aorta and mouse bone marrow tissues ()). Interestingly, most non-complimentary CpG sites were in gene promoter regions, particularly in the mouse ()), indicating the existence of some forces deviating promoter DNA methylation from the expected pattern.
A genome-partitioning algorithm was developed based on the complementarity between CpG density and DNA methylation
Given the high complementarity between CpG density and DNA methylation in most genome regions, we conjectured that genome regions enriched with uncomplimentary CpG sites might have been specially preserved during evolution and had important biological significance. To locate potential regions, we developed a ‘complementarity-based genome partitioning algorithm’ (CGPA) that employed exponential function (see methods) to fit the overall trend of CpG density and DNA methylation. Then, we utilized the deviation from the fitted exponential curve (in Figure 3(a)) along with the relative differences of DNA methylation and CpG density (
in )) to assign each CpG site into four categories, Conflicts of Gap (COG), Conflicts of Overlap (COO), Harmony with Medium Values (HMV), and Harmony with Extreme Values (HEV) ()). Here, harmony denotes that CpG density and DNA methylation get along well with one’s valley matching complementarily with another’s peaks or vice versa (Figure S13(a-b)), while, conversely, conflict denotes that CpG density and DNA methylation does not get along so well, for example, valleys (COG, Figure S13(c)) or peaks (COO, Figure S13(d)) appear simultaneously for CpG density and DNA methylation. The genome was partitioned by searching for the consecutive appearance of CpG sites of the same category with a tolerance of two out-of-category CpG sites ()). Most of the genome was assigned to harmonious regions, with HMV and HEV regions occupying around 90% of the genome in most tissues (Figure S14(a), Supplementary Table 2). This is consistent with the fact that high complementarity exists between CpG density and DNA methylation across the whole genome (). Furthermore, the numbers of each type of region detected in human and mouse were consistent. Of the eight tissues available in both species, thymus had the least number of COGs (13,782 and 9,796 for human and mouse, respectively), but the most number of COOs (18,703 and 24,834). In contrast, pancreas had the most number of COGs (75,589 and 89,122), but the least number of COOs (14,207 and 17,535) (Supplementary Table 2). Pearson correlation coefficients of the number of COG, COO, HEV between human and mouse tissues reached 78.52%, 72.17%, and 52.83%, respectively ()), demonstrating that the CGPA approach based on complementarity of CpG density and DNA methylation was robust and species-independent.
We compared the distribution of COG and COO in different genomic feature regions, such as 3'UTRs, 5'UTRs, promoters, exons, introns, and other regions. A high degree of variation of COG distribution among 18 human tissues was observed, especially in 5'UTR and promoter regions ()). On the contrary, COO distribution remained stable across different tissues ()). The coefficient of variation (CV) for COG reached 28.3% and 22.3% for 5'UTRs and gene promoters, respectively, while the highest CV for COO was only 3.7% ()). A similar result was also observed in 16 mouse tissues (Figure S15). This finding indicated that COG might play an important role in regulating tissue-specific gene expression, while COO may partake in general roles in all tissues. Considering the higher prevalence of COO in all 18 human tissues and 16 mouse tissues in short interspersed nuclear element (SINE) regions (Figure S14(b)), we speculate that COO is involved in suppressing SINE jumping.
To further investigate the variability of COGs among different tissues, unsupervised hierarchical clustering analysis was performed according to DNA methylation level of COG regions. Since COGs are tissue dependent and were called separately for each of the 16 mouse tissues, clustering was also performed separately for each tissue () and S16). The clustering results for the 16 mouse tissues displayed high concordance. In most cases, tissues with similar biological origins were clustered together, such as blood-producing tissues (spleen, thymus and bone marrow), ectoderm-derived tissues (cerebellum, cortex, and olfactory bulb), mesoderm-derived tissues (heart, lung, kidney, uterus and skin), and endoderm-derived tissues (colon, intestine, pancreas, stomach and liver) () and S16). Interestingly, similar clustering results were also obtained according to 286,652 differential methylated regions (DMRs) derived from the publication of Hon et al. [Citation33] () and S16). Clustering analysis also shows high concordance among 18 human tissues and similar results were obtained between COGs and DMRs (1,198,132, from Schultz et al. [Citation6]) () and S17). This denotes that although COG regions were ten times less frequent than those of DMRs, their identification captured the majority of the tissue methylation variations that would be detected by several orders of magnitude more DMRs.
We then calculated Pearson correlation coefficient (PCC) between each pair of 16 mouse tissues (a total of 120 combination pairs) according to methylation level at COG or DMR regions (Supplementary Table 3). The tissue pairs from the same germ layers, such as spleen vs. thymus, cortex vs. olfactory bulb, colon vs. intestine, and heart vs. lung, showed the highest correlation for both COGs and DMRs (Figure S18). The tissue similarities determined by DMRs and COGs were highly concordant for all the 120 combinations of tissue pairs (Figure S19). Even higher concordance was observed in human DMRs and COGs (Supplementary Table 4, Figures S18 and S19). These together demonstrate that although COG regions were determined by the complementarity of CpG density and DNA methylation, they could achieve a similar level of tissue methylation differentiation as DMR regions that were intentionally located for the most varied CpGs.
Transcription start site-proximal COGs might be involved in selective promoter usage
COGs exhibit high variabilities among different tissues, indicated not only by their coincidence with regulatory genomic elements ()), but also by their ability to correctly classify tissues (), S16 and S17), suggesting that COGs play important roles in regulating tissue-specific gene expression. To find out the COGs with the highest potential of tissue-specific gene expression regulation, we separated COGs into two groups, variable COGs with methylation standard deviation (SD) greater than 0.15 and stable COGs with SD < 0.15 (Figure s4(a) and S20). The variable COGs were further separated into TSS-proximal COGs (tpCOGs) that may have direct effects on gene expression and TSS-distal COGs (tdCOGs) that may exert their effects in an indirect way (), Supplementary Table 5). Human and mouse had similar number of stable COGs (36,611 ± 3,293 for 18 human tissues and 36,921 ± 5,388 for 16 mouse tissues). However, the number of variable COGs was significantly higher (P = 0.0042, t-test) in human (3,974 ± 1387) than in mouse (2,739 ± 739), especially for tpCOGs (P = 4.55 × 10⁻¹¹, t-test) (Figure S21). This observation was consistent with the whole-body epigenome analysis that identified more DMRs in human (1,198,132) than in mouse (286,652). These results may infer a more biologically relevant role of DNA methylation variations in humans, as previously suggested by DNA methyltransferase (DNMT) knockout experiments in human embryonic stem cells [Citation34]. Mouse embryonic cells with simultaneous disruption of three DNMTs have no detectable growth defects while human embryonic cells with the disruption of only DNMT1 leads to rapid cell death [Citation13]. Although the number of various COGs were significantly different between human and mouse tissues, their distribution showed high concordance. In the 8 common human and mouse tissues, the PCC reached 0.7902 for stable COGs, 0.7711 for variable COGs and 0.7746 for tdCOGs (Figure S22), suggesting a high evolutionary conservation of CpG density and DNA methylation complementarity and the species-independent robustness of our algorithm.
Figure 3. Nonlinear modelling and algorithm development based on complementarity between CpG density and DNA methylation. (a) Genome partition algorithm (see methods) by modelling the relationship between CpG density and DNA methylation with nonlinear function. Complementary coefficient and differential coefficient
were divided into three categories high (H,
> 70% quantile,
> 70% quantile), medium (M, 20% quantile<
< 70% quantile, 20% quantile<
< 70% quantile) and low (L,
< 20% quantile,
< 20% quantile) according to their distributions. Combining
and
, genome was partitioned into four types of regions: Conflict of Gap (COG) regions, Conflict of Overlap (COO) regions, Harmony with Medium Value (HMV) regions, and Harmony with Extreme Value (HEV) regions. (b) Partitioned regions snapshot from UCSC genome browser. Both single site and sliding window representations are presented. In single site view, CpG sites are marked out by blue bars, methylation is the fraction of methylated reads in total covered reads for each CpG site on Crick (above baseline) and Watson (below baseline) strands. In sliding window view, CpG and methylation refer to CpG density and average methylation in each window on both strands. The four region types, COG (green), COO (blue), HMV (cyan), and HEV (red) are labelled at the top. (c) The proportions in 18 human tissues of COO and COG that coincided with various genome feature regions (3’UTR, 5’UTR, promoter, exon, intron). Coefficient of variations were calculated as the ratio of standard deviation to mean in 18 tissues. (d) Positive correlations of the amount of HMV, COG and COO regions in the eight tissues shared by human and mouse. (e) Unsupervised hierarchical clustering analysis of human and mouse tissues based on DNA methylation level in COG and DMR regions. Tissues were colored to reflect the similarities of their normal functional or developmental origins. Human and mouse DMRs were from the studies[Citation6,Citation34].
![Figure 3. Nonlinear modelling and algorithm development based on complementarity between CpG density and DNA methylation. (a) Genome partition algorithm (see methods) by modelling the relationship between CpG density and DNA methylation with nonlinear function. Complementary coefficient pcand differential coefficient pd were divided into three categories high (H, pd> 70% quantile, pc> 70% quantile), medium (M, 20% quantile< pd < 70% quantile, 20% quantile< pc < 70% quantile) and low (L, pc< 20% quantile,pd < 20% quantile) according to their distributions. Combining pc andpd, genome was partitioned into four types of regions: Conflict of Gap (COG) regions, Conflict of Overlap (COO) regions, Harmony with Medium Value (HMV) regions, and Harmony with Extreme Value (HEV) regions. (b) Partitioned regions snapshot from UCSC genome browser. Both single site and sliding window representations are presented. In single site view, CpG sites are marked out by blue bars, methylation is the fraction of methylated reads in total covered reads for each CpG site on Crick (above baseline) and Watson (below baseline) strands. In sliding window view, CpG and methylation refer to CpG density and average methylation in each window on both strands. The four region types, COG (green), COO (blue), HMV (cyan), and HEV (red) are labelled at the top. (c) The proportions in 18 human tissues of COO and COG that coincided with various genome feature regions (3’UTR, 5’UTR, promoter, exon, intron). Coefficient of variations were calculated as the ratio of standard deviation to mean in 18 tissues. (d) Positive correlations of the amount of HMV, COG and COO regions in the eight tissues shared by human and mouse. (e) Unsupervised hierarchical clustering analysis of human and mouse tissues based on DNA methylation level in COG and DMR regions. Tissues were colored to reflect the similarities of their normal functional or developmental origins. Human and mouse DMRs were from the studies[Citation6,Citation34].](/cms/asset/59da055a-2dad-447a-a61f-f3e52eb14bea/kepi_a_1500057_f0003_oc.jpg)
Figure 4. Selective promoter usage determined by tpCOGs. (a) Heatmap of DNA methylation in COGs of human aorta. The heatmap was vertically ranked by standard deviation (SD) across 18 tissues and horizontally clustered by Euclidean distance. Shown on the top is methylation mean of each tissue, on the right is SD of variable (red, SD > 0.15) and stable (green, SD < 0.15) COGs, on the top right corner is the histogram of SD. (b) The amount of tpCOGs and tdCOGs in all human tissues. (c) Snapshot of the mouse TAOK3 gene in UCSC genome browser. H3K4me3 and PolII data were generated by ChIP-seq [Citation34]. Cap analysis gene expression (CAGE) data were obtained from the FANTOM research projects [Citation45]. TSS-I, TSS-II, and TSS-III denote the 1st, 2nd, and 3rd transcription start site. TSS-II and TSS-III (light blue colored) were identified as TCPs in bone marrow and spleen, or cerebellum and cortex, respectively. See S23 Fig for more thorough data. (d) Heat map of DNA methylation and the corresponding H3K4me3 in tpCOG-coincident promoters (TCPs) and tpCOG-incoincident promoters (TICPs). The heatmap was vertically ranked by CpG number in promoter regions (500 bp up- and down-stream of transcription start site). Maxdiff denotes the maximum difference of methylation among 18 human tissues. The smooth blue lines are the trend lines fitted by LOESS method. H3K4me3 signal refers to the number of ChIP-seq reads falling in promoter regions.
![Figure 4. Selective promoter usage determined by tpCOGs. (a) Heatmap of DNA methylation in COGs of human aorta. The heatmap was vertically ranked by standard deviation (SD) across 18 tissues and horizontally clustered by Euclidean distance. Shown on the top is methylation mean of each tissue, on the right is SD of variable (red, SD > 0.15) and stable (green, SD < 0.15) COGs, on the top right corner is the histogram of SD. (b) The amount of tpCOGs and tdCOGs in all human tissues. (c) Snapshot of the mouse TAOK3 gene in UCSC genome browser. H3K4me3 and PolII data were generated by ChIP-seq [Citation34]. Cap analysis gene expression (CAGE) data were obtained from the FANTOM research projects [Citation45]. TSS-I, TSS-II, and TSS-III denote the 1st, 2nd, and 3rd transcription start site. TSS-II and TSS-III (light blue colored) were identified as TCPs in bone marrow and spleen, or cerebellum and cortex, respectively. See S23 Fig for more thorough data. (d) Heat map of DNA methylation and the corresponding H3K4me3 in tpCOG-coincident promoters (TCPs) and tpCOG-incoincident promoters (TICPs). The heatmap was vertically ranked by CpG number in promoter regions (500 bp up- and down-stream of transcription start site). Maxdiff denotes the maximum difference of methylation among 18 human tissues. The smooth blue lines are the trend lines fitted by LOESS method. H3K4me3 signal refers to the number of ChIP-seq reads falling in promoter regions.](/cms/asset/051e7ffc-a277-4f0d-988c-632e6284a170/kepi_a_1500057_f0004_oc.jpg)
tpCOGs are located close to TSSs and exhibit high variations among tissues (), and S20), indicating they may affect tissue-specific promoter usage. This speculation was supported by multiple layer epigenetic data, including histone modification, RNA polymerase II binding, and CAGE-measured 5'-end mRNA transcription () and S23-25). Toak3 is a gene with three TSSs in the mouse genome () and S23). TSS-I is located in a CpG island and demonstrates high CpG density and low methylation in all tissues, indicating that it is constitutively expressed, which is consistent with the enrichments of H3K4me3 and RNA polymerase II (polII) signal, and the relative amount of 5' mRNA transcription determined by CAGE. TSS-II was identified as COGs in three immune tissues, bone marrow, spleen, and thymus. Consistently, TSS-II has intermediate CpG density, low methylation in three immune tissues, high methylation in other tissues, and the enrichment of H3K4me3, RNA polII, and CAGE signal, specifically in three immune tissues. In contrast, TSS-III was identified as having COGs in nervous system-related tissues, including cerebellum, cortex, and olfactory bulb, and exhibited similar features in these tissues as did TSS-II in immune tissues () and S23). Similar results were also observed in other genes, such as mouse gene Elmo1 (Figure S24) and human gene RORC (Figure S25).
To systematically study the role of tpCOGs in tissue-specific TSS usage, genes with at least one of their promoters overlapping with tpCOGs were identified (Supplementary Table 6). In total, 1,067 genes were identified, most of which (851, 79.8%) possess more than 2 promoters. These genes possess, in total, 5,567 distinct promoters, of which 30% coincided with tpCOGs (Figure S26). Each of the 216 single-promoter genes showed coincidence with tpCOGs in one or multiple tissues. For the genes with multiple promoters, the fraction of tpCOGs-coincident promoters exhibited high variations. Among the 73 seven-promoter genes, the fraction of genes having one, two, three, four, six, or seven promoters coinciding with tpCOGs were 55%, 23%, 14%, 4%, 1%, and 3%, respectively. Similar results were obtained among the 39 ten-promoter genes (Figure S27). Genes with lower numbers of promoters usually displayed a wider span for the fraction of tpCOG-coincident promoters, ranging from around 10% to 100% (Supplementary Table 6), and the different fractions were discernible as distinct peaks on density plots (Figure S28). However, peaks became obscure and shifted to the lower fraction part in the plots in genes possessing higher numbers of promoters. (Figure S28).
The promoters coincident with tpCOGs often displayed different behaviour from those not coincident with tpCOGs. TGFB3 is a five-promoter gene with one promoter (promoter 4) coinciding with tpCOG in aorta tissue (Figure S29). The tpCOG-coincident promoters (TCPs) showed the lowest methylation in aorta tissue and exhibited various methylation levels among the other 17 tissues. In contrast, methylation of tpCOG-incoincident promoters (TICPs) were stable, regardless of the presence of high (promoter 1–3) or low (promoter 5) methylation levels (Figure S29). The TCP had relative low number of CpGs, while the number of CpGs in TICPs had a bimodal distribution, with hypermethylated promoters (promoter 1–3) having extremely low numbers of CpGs, and hypomethylated promoters (promoter 5) having notably high numbers of CpGs (Figure S29). Similar results were also observed in other genes (Figure S29). Systematic analysis confirmed these observations. TICPs exhibited either extreme high or extreme low methylation, while TCPs had an even distribution among tissues (Figure S30(a-b)). Consistently, the active histone modification H3K4me3 exhibited a bimodal distribution for TICPs but a single peak for TCPs (Figure S30(c-d)). At the same time, TCPs exhibited much higher methylation variations (methylation difference reaching 0.667 on average), than TICPs (methylation difference was 0.269) (Figure S30(e)). CpG number of TCPs (mean = 24) were close to hypomethylated TICPs (mean = 16), but much lower than hypermethylated TICPs (mean = 76) (Figure S30(f)). These findings indicated that while tpCOG-coincident promoters displayed tissue-specific methylation and histone modification, the promoters not coincident with tpCOGs remained constant among tissues. Similar results were obtained for mouse data, suggesting these findings are species-independent.
To more thoroughly compare the behaviors of TCPs and TICPs, we constructed a heatmap to show the methylation of all TCPs (1,616) and TICPs (3,951) in 18 tissues. The promoters were sorted by CpG number and tissues were clustered by Pearson correlation ()). As expected, methylation was low at high CpG density. However, different from the consistent low methylation across all tissues for TICPs, some tissues existed that displayed relative high methylation for TCP at high CpG density, as indicated by the tissues of pancreas, esophagus, aorta, and adrenal ()). Promoter methylation increased progressively with the decreasing of CpG number and had high methylation at low CpG density. Similarly, different from the consistent high methylation across all tissues for TICPs, some tissues displayed low methylation for TCPs at low CpG density ()). This divergence was further confirmed by the maximum difference of promoter methylation among the 18 human tissues. While the maximum difference was only around 0.269 for TICPs, it reached over 0.667 for most TCPs, consistent with the larger tissue-dependent variations of TCPs ()). Such variation reflects the overall methylation fluctuations, considering that COG-derived tissue clustering patterns is highly concordant with the ones generated from all human DMRs (1,198,132) ()). To rule out the possible impacts of genes on their promoters, we selected the two-promoter genes with one promoter belonging to TCP and another to TICPs, and juxtaposed their methylations. The results were similar to the case where all multiple-promoter genes were considered, indicating that despite coming from the same genes, TCPs and TICPs still show different behaviors (Figure S31). The high variation of TCPs reflected the high variation of promoter activity among tissues. H3K4me3, an indicator of promoter activities, showed inverse correlation with DNA methylation, gradually becoming weaker with decreasing CpG density. The maximum differences of H3K4me3 among tissues were obviously higher in TCPs than in TICPs ()). Similar results were obtained in mouse (Figures S32 and S33). These data together indicate that tpCOGs play crucial roles in regulating tissue-specific gene expressions.
tdCOGs exhibit the characteristics of regulatory elements
Although tpCOGs play important roles in determining selective promoter usage (), tdCOGs comprise the major portion of variable COGs in human and mouse tissues () and S21). To determine the functionality of tdCOGs, we compared different layers of genomic and epigenetic features between tdCOGs, enhancers, and promoters. The enrichment of transcription factor binding sites is usually a prominent indicator of potential regulatory elements. Examination of 243 transcription factor binding motifs showed that tdCOG, promoter, and enhancer have similar and significantly higher transcription factor binding potentials than random genomic regions in human adrenal (P < 1 x 10−100, t-test) (Figure 5(a)). High transcription factor binding potentials of tdCOGs were consistently observed in all 18 human tissues ()). DNase I accessibility is indicative of chromosome states and its enrichment is an important indicator of potential regulatory elements. The DNase I-hypersensitive site (DHS) is highly enriched in tdCOGs compared with random genomic regions and reaches the same level of that observed for enhancers and promoters in human adrenal tissue ()). Furthermore, we also observed the high enrichment of DHS in tdCOGs, enhancers, and promoters in the other 17 human tissues ()). Sequence conservation represents the ability of a sequence to survive the selective pressure exerted by the evolutionary process. Generally speaking, the higher the conservation, the more fundamental a role the product or function this sequence has in the maintenance of the organism. Conservation analysis among 30 species showed that the conservation level of tpCOGs is similar to that of promoters, which, in turn, is higher than that of enhancers (). To get a genome-wide view of all these signals, Circos plots were created for human and mouse tissues. Generally, COGs exhibited CpG density at the similar level with, or lower than, HMVs, which is consistent with our algorithm for detecting COGs () and S34). As expected, the overall methylation level in COGs is lower than in HMVs () and S34). On the contrary, conservation signals, transcription factor binding motif, and DNase I hypersensitivity in COGs are higher than in HMVs. This indicates that tdCOGs are more likely to be at open chromosome areas, are favorable for transcription factor binding, and are evolutionary conserved, which together confer tdCOGs a high gene-regulating potential. Similar results were obtained in mouse tissues (Figures S35 and S36), further confirming this conclusion.
Figure 5. tdCOGs are potential gene regulatory elements. (a-b) The significant enrichment of transcription factor binding motif in tdCOGs. We obtained transcription factor motif (n = 243) from the HOMER database and (a) counted their overlapping with tdCOGs, promoters, enhancers, and random genomic regions in human adrenal tissue. (b) P values (t-test) between tdCOGs and random genomic regions were calculated in each of the 18 human tissues and shown in empirical cumulative distribution plot. (c-d) The significant enrichment of DNaseI hypersensitivity in tdCOGs. We downloaded DNaseI hypersensitivity sites from UCSC genome browser and (c) counted their overlapping with tdCOGs, promoters, enhancers, and random genomic regions in human adrenal tissue. (d) P values (t-test) between tdCOGs and random genomic regions were calculated in each of the 18 human tissues and shown in empirical cumulative distribution plot. (e-f) Higher sequence conservations in tdCOGs. We downloaded sequence conservation data from UCSC genome browser and (e) calculated the mean conservation scores in tdCOGs, promoters, enhancers, and random genomic regions in human adrenal tissue. (f) P values (t-test) between tdCOGs and random genomic regions were calculated in each of the 18 human tissues and shown in empirical cumulative distribution plot. The vertical dashed lines in (b, d, f) mark the x-axis value of P = 0.01. Random genomic regions were selected for multiple times with the same number of tdCOGs (n = 769). (g) Genome wide comparison of CpG density, DNA methylation, sequence conservation, transcription factor bind motif and DnaseI hypersensitivity sites between tdCOGs (G) and HMVs (H) for human adrenal tissue in circos plot. The outmost circle indicates the cytobands of 24 head-to-tail connected chromosomes. Bar height in each circle denotes signal intensity of the corresponding chromosome features. (h) Genome wide comparison of histone modification signals between tdCOGs and HVMs for human adrenal tissue in circos plot. (i-k) Enrichment of histone modifications in tdCOGs, promoters, and enhancers in human adrenal tissue. The regions, after expanding half of their length upstream and downstream, were divided into 100 equal bins. ChIP-seq reads falling in each bin were averaged. (l) Comparison of histone modifications between tdCOGs and enhancers in 18 human tissues. Using promoters as standard, we calculated the fold changes of H3K4me1, H3K4me3, and H3K27ac signals in tdCOGs and enhancers in all 18 human tissues and presented them after log2-transformation.
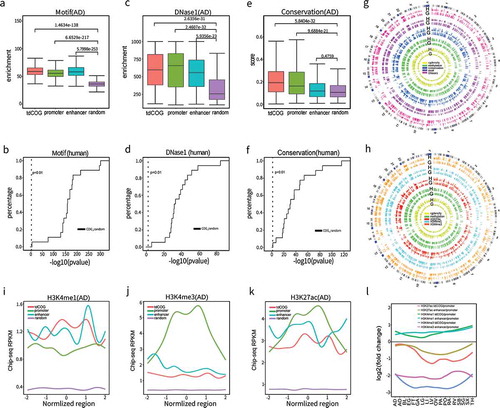
Histone modification signals in tdCOGs provide extra evidence strengthening the concept that tdCOGs are regulatory elements. As shown in ), tdCOGs display coherently stronger H3K4me1, H3K4me3, and H3K27ac signals than HMVs in human adrenal and the 17 other tissues (Figure S37). Comparative analysis indicated that tdCOGs has more similar histone modification patterns with enhancers, rather than promoters (-l)). H3K4me1 is a typical histone modification marker for enhancers. As shown in ), tdCOGs exhibited similar levels of H3K4me1 to enhancers in the human adrenal, which was higher than in promoters and much higher than random genomic regions. H3K4me3 is a typical histone modification marker for gene promoters. Consistently, promoters displayed a stronger H3K4me3 signal than tdCOG or enhancers, while these two elements had similar signal intensity ()). H3K27ac is a modification marker present both in gene promoters and enhancers. As shown in ), this modification displayed the strongest signal on gene promoters, followed by tdCOGs and enhancers. To systematically investigate the similarity of tdCOGs and enhancers in different human tissues, we calculated fold changes of the mean histone modification signals of tdCOGs and enhancers relative to promoters ()). For H3K4me1, tdCOGs and enhancers were similar in all tissues, but consistently displayed elevated signal compared to promoters; for H3K4me3, tdCOGs, and enhancers had much lower signal than that of the promoters, with enhancers being a slightly stronger than tdCOGs; for H3K27ac, tdCOGs and enhancers had relative lower signals than promoters. The signal distribution in enhancers and promoters of H3K4me1, H3K4me3, and H3K27ac signal is consistent with the specific roles that each histone modification plays. The high similarity of tdCOGs and enhancers suggest that tdCOGs may act as enhancers in the regulation of gene expression. We further analyzed histone modifications in 16 mouse tissues (Figures S38 and S39). Again, tdCOGs acted similarly as enhancers, but not promoters, indicating the likeness of tdCOGs and enhancers are species-independent. Similar analyses were also conducted with tpCOGs (Figure S40). In contrast to tdCOGs, tpCOGs acted similar as promoters, but not enhancers.
tdCOGs regulate the expression of genes crucial for tissue functioning
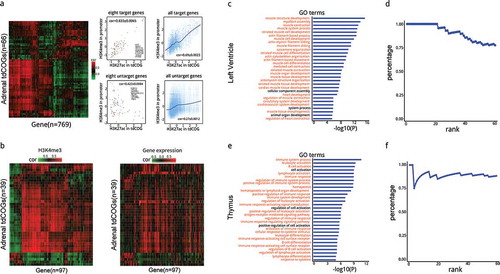
To find out the target genes regulated by tdCOGs, we evaluated the correlation between H3K27ac signals in tdCOGs and H3K4me3 signals in gene promoters across 18 human tissues (Supplementary Table 7). This target gene-determination approach is built upon the assumption that distal regulatory elements should possess similar chromatin states to their target genes. In this study, H3K27ac signals were used for distal regulatory elements and H3K4me3 signals were used for gene promoters. This approach has been proven to be superior to the nearest gene-assigning method which assumes that regulatory element regulates the nearest genes or CTCF-defined chromatin domain method which assumes that regulatory elements and their genes are in the same chromatin domain defined by CTCF-binding sites [Citation35,Citation36]. H3K27ac signals and H3K4me1 signals were highly concordant in tdCOGs, while the intensity of H3K27ac signals were consistently higher than H3K4me1 signals (Figure S41). In human adrenal tissue, 769 genes were identified as the target genes of 66 tdCOGs in chromosome 1 (Figure 6(a)). High correlations of histone modification existed between tdCOGs and their target genes (PCC = 0.883 ± 0.0065 for eight representative target genes, and 0.69 ± 0.0023 for all target genes), while only weak correlation existed between tdCOGs and untargeted genes (PCC = −0.423 ± 0.0084 for eight representative untargeted genes, and 0.27 ± 0.0012 for all untargeted genes) ()). tdCOGs and target genes usually existed in a multiple-to-multiple manner, i.e., one tdCOGs could target multiple genes (mean = 17.8 ± 0.21) and one gene could be targeted by multiple tdCOGs (mean = 1.07 ± 0.002). In total, 91.5% (15,718) of tdCOGs targeted more than one gene, and 27.2% (55,777) genes were targeted by more than one tdCOGs (Figure S42).
Figure 6. Prediction and analysis of tdCOG targeted genes. (a) Heatmap of the correlation coefficient between human adrenal-derived tdCOGs and their target genes. Correlation coefficients were calculated using H3K27ac signals in each tdCOG and H3K4me3 signals in each promoter across 18 human tissues. Genes with high correlation (> 0.6, shown in red in the heatmap) were considered as the targets of tdCOGs, and with low correlation (shown as green) were considered as non-targets. Signal intensities of histone modifications are shown in scatter plots for the 8 typical target and untargeted genes, or for all the target and untargeted genes. Cor denotes the mean ± SD of correlation coefficients of the eight genes or all the genes. Only tdCOGs on chromosome 1 are shown. (b) Comparison of histone-derived correlation and transcription-derived correlation. Heatmaps were generated as in (a). tdCOGs were also from human adrenal tissue and confined to chromosome 1. Only genes with detectable expression levels were considered, which led to less genes than (a). Histone modification heatmap (left) was clustered, and gene expression heatmap (right) is shown in the same order. (c and e) Functional annotation of target genes in left ventricle and thymus. Gene ontology (GO) terms associated with target genes were retrieved from DAVID database. The terms were ranked by P values (Fisher Exact test). Terms marked in red denote direct functional association with the corresponding tissue. The top 30th terms are shown. (d and f) Percentage of the GO terms directly associated with the corresponding tissues in the top 60 terms. Percentages refer to the fractions of directly associated terms, i.e., red colored terms in (c or e), in total terms at each rank.
To systemically determine whether the high correlation of histone modification between tdCOG and its target genes led to high transcription of these genes, we compared the PCC between tdCOG H3K27ac vs. promoter H3K4me3, and tdCOG H3K27ac vs. target gene transcription ()). It can be clearly seen that active tdCOGs marked by H3K27ac are often associated with higher levels of gene expressions ()). The topologically associating domain (TAD) identified by Hi-C technology also provides extra evidence for the targeting relationship between tdCOG and the corresponding target genes. As shown in Figure S43 a, a tdCOG locates in the same TAD as its target gene LINC01133. The tdCOGs exhibit typical features of regulatory elements with low CpG density, low DNA methylation, and abundant H3K27ac signals. PCC between H3K4me3 signals in LINC01133 promoter and H3K27ac signals in tdCOGs among 18 human tissues reached 0.7746 (Figure S43(b)), which strongly suggests a regulatory relationship.
To check whether target genes are associated with the normal functioning of the corresponding tissues, we explored the biological process terms from gene ontology (GO) present in The Database for Annotation, Visualization, and Integrated Discovery (DAVID). In the left ventricle, the 225 target genes were highly enriched in the GO terms associated with muscle, myofibril, and heart functions, such as muscle structure development, myofibril assembly, sarcomere organization, heart development, and more ()). Twenty-eight of the top 30 terms were clearly related to cardiovascular system ()). Furthermore, over 75% of the GO terms displayed clear association with the function of the tissue of origin, even tracking down to the 60th term on the list ()). Similar levels of association were observed in other human and mouse tissues (Figure S44). These observations support the hypothesis that tdCOGs play important roles in regulating both distal gene expression and the normal functioning of the respective tissues where tdCOGs are located.
Discussion
The underrepresentation and distribution unevenness of CpG dinucleotides have been previously documented in various vertebrate genomes [Citation1,Citation2,Citation4,Citation37,Citation38]. Both traits of CpG dinucleotides have close connections with DNA methylation. In contrast from the conventional methods that are merely able to interrogate the methylation status of a few CpG sites, or at most thousands of CpG sites, WGBS provides unprecedented throughputs that enable us to address the methylation status of the whole genome at base resolution [Citation6,Citation7,Citation29,Citation33]. This technique offers us a new opportunity to extensively explore the interactions between DNA methylation and CpG distributions. Meanwhile, the vast amount of data brings up new challenges in developing high-efficient data-mining algorithms to discover the underlying biological significances. In this study, we developed a CGPA algorithm that employs a sliding window approach. This algorithm summarizes the methylation and density of nearby CpG sites (), utilizes exponential function to fit the correlation of DNA methylation and CpG density ()), and takes advantage of the deviation to the fitted curve for locating the ‘aberrant regions’, i.e., the COGs with deficient complementarity and COO with excessive complementarity (), S14 and Supplementary Table 2). By combining different layers of epigenetic datasets, we demonstrated herein that COGs could play important roles in regulating both proximally or distally tissue-specific gene expression (, ,S23-25).
Interestingly, although both belonging to non-complementary regions, COG and COO display distinct behaviors (). The coincidence of COG with genome feature elements vary among tissues, especially in 5'UTR and gene promoters. However, COO remains stable () and S15). Although it cannot be completely ruled out that the higher variability of COG results from tissue-specific somatic DNA mutations, this observation is consistent with the biological functions each of them performed. While COO might be crucial for suppressing the promiscuous translocation of SINE repetitive elements (Figure S14(b)), COGs were involved in regulating the expression of tissue-specific genes ( and ). Impressively, COGs, despite being present in lower amounts than DMRs, could reach similar levels of tissue discrimination as DMRs ()). Given that COGs were identified based merely on the complementarity between CpG density and DNA methylation, while DMRs were intentionally identified by methylation differences among tissues [Citation6,Citation33], this finding indicates that important biological information is carried by the complementarity of CpG density and DNA methylation. In fact, in early vertebrate evolution, such complementarity might have resulted from selective pressure to deliver a desirable gene regulatory profile. DNA methylation primarily occurs in the CpG context, and the methylated cytosines are known to be prone to spontaneously mutate to thymine via deamination, finally leading to global CpG paucity in vertebrate genomes. The CpG sites that stay highly methylated and are also exempt from deamination may have important biological implications. These CpG sites were usually identified as harmony regions in this study () and S13). However, in some tissues, probably due to the demands of relieving tissue-specific promoters or regulatory elements, DNA methylation was cleared or reduced, leading to the appearance of COGs. This may explain why COGs have important gene regulatory functions ( and ), are highly variable among tissues () and S15), and possess a similar capability to differentiate tissues as do DMRs ()).
Robustness is a necessary property for an algorithm that is used to mine large biomedical datasets, otherwise, perturbations among tissues or across species would generate unstable results, and may therefore lead to erroneous conclusions. The CGPA algorithm we developed herein would appear to possess high robustness. In the eight tissues common between human and mouse, the quantity of regions identified by the CGPA algorithm, including COG, COO, and HMV, show high consistency ()). Furthermore, the subcategory of COGs, such as stable COGs, variable COGs, and tdCOGs, also showed high concordance among the shared tissues (Figure S22). These findings suggested the CGPA algorithm has high tolerance for the variations between human and mouse methylome data.
Our analysis further indicates that human and mouse may have different reliance on DNA methylation for modulating gene expression. Although comparable quantities of stable COGs were identified in human and mouse, variable COGs, as well as tpCOGs and tdCOGs, were more abundant in human than in mouse (Figure S21). In line with our findings, more DMRs were found among human than mouse tissues [Citation6,Citation33]. Supporting the theory that human cells depend more on DNA methylation for gene regulation, recent gene knockout experiments in embryonic cells, using CRISPR/Cas9 genome editing technology, demonstrated that deletion of DNMT1 resulted in rapid cell death of human ESCs, while corresponding mouse DNMT1−/- ESCs exhibited no obvious defects [Citation13,Citation34].
Previous methylome studies principally focused on DMR genomic regions [Citation3,Citation7,Citation28,Citation29]. Many algorithms have been published for detecting DMRs between two methylomes, such as tissue A vs. tissue B, or cancer vs. normal [Citation39–Citation43]. However, it is extremely challenging to locate DMRs, especially to precisely define boundaries, in situations where multiple methylomes are being analyzed [Citation39,Citation41]. DNA methylation has the default pattern of hypermethylation in CpG-poor regions and hypomethylation in CpG-dense regions. In this study, we systematically investigated this pattern in different human and mouse adult tissues and across different developmental stages (, S8 and S9). We introduced a ‘complementary index’ to quantitatively assess the matching degree between DNA methylation and CpG density ()), and developed the CGPA algorithm to locate the deviated genomic regions (). The key concept behind our analysis is that we regarded CpG density as the reference for different methylomes. As a consequence, each methylome can be compared with the reference methylome separately, and then the results are summarized to find the target regions across multiple methylomes. The advantage of this strategy in biological significance mining has been demonstrated by the identification of tpCOGs and tdCOGs and the confirmation in this study of their gene regulating functions.
The CpG density-centered approach in this study is different from the traditional CGI-centered approach. The CpG density-centered approach takes into account every single CpG site, no matter whether it is located in CpG-dense or CpG-sparse region, thus making it possible to conduct continuous analysis along the genome. In contrast, CGI-centered approach is block-wise, attracting most of the attention to CpG-dense regions while neglecting the vast genome areas with low or intermediate CpG densities. Giving that latest sequencing technology can determine the methylation level of all CpG sites, such neglect is obviously not advisable.
Materials and methods
Datasets obtained from online resources
For mouse tissues, the WGBS methylome data were downloaded from GEO accession GSE42836, the ChIP-seq data and RNA-seq data were downloaded from GSE29184. For human tissues, the WGBS methylome data along with the corresponding ChIP-seq data and RNA-seq data were downloaded from GEO accession GSE16256 (SRA SRP000941). The mouse dataset contains 16 different tissues (GSM1051150 for bone marrow, GSM1051151 for cerebellum, GSM1051152 for colon, GSM1051153 for cortex, GSM1051154 for heart, GSM1051155 for intestine, GSM1051156 for kidney, GSM1051157 for liver, GSM1051158 for lung, GSM1051159 olfactory for bulb, GSM1051160 for pancreas, GSM1051161 for placenta, GSM1051162 for skin, GSM1051163 for spleen, GSM1051164 for stomach, GSM1051165 for thymus, GSM1051166 for uterus) [Citation34] and the human dataset contains 18 different tissues (SRX388739 aorta, SRX388738 adrenal, SRX263874, SRX213279 bladder, SRX388732 fat, SRX190156, SRX263888, SRX263889 gastric, SRX388734 Lung, SRX213280 liver, SRX263876, SRX263875 left-ventricle, SRX263879, SRX190152 ovary, SRX388743 pancreas, SRX388735 psoas, SRX263891, SRX263890, SRX190159 right-atrlum, SRX388736 right-ventricle, SRX388747 small-bowel, SRX388737 spleen, SRX190151, SRX263878 thymus) [Citation6]. Cap analysis of gene expression (CAGE) signals [Citation44] and the predicted promoters are also incorporated during our analysis. CAGE allows measuring the expression of eukaryotic capped RNAs and simultaneously map the promoter regions All the CAGE data were obtained from FATOM5 database (http://fantom.gsc.riken.jp/5/). The dataset for motif analysis came from HOMER [Citation45] database (http://homer.ucsd.edu/homer/). To perform DNase1 hypersensitivity analysis and sequence conservation analysis, the corresponding datasets were extracted and downloaded from UCSC genome browser [Citation46] using the Table Browser data retrieval tool [Citation47].
WGBS data processing
WGBS data were processed by Methylation Table of Base Resolution (MTBR) pipeline, an inhouse-developed tool available at https://github.com/DMU-lilab/mtbr-pipeline. MTBR utilizes segemehl [Citation48] as the core to perform bisulfite-treated short read mapping followed by automatically removing of the wrong mapping reads and extracting of DNA methylation information. Here, we used mouse (mm9) and human (hg38) as reference genomes that were downloaded from UCSC genome browser.
Observed-to-expected ratio (O/E) of dinucleotides
Given a dinucleotide where, the observed-to-expected ratio [Citation49] was calculated by dividing the proportion of the
dinucleotide in the genome by what is expected by chance when
and
bases are assumed to be independent outcomes of a multinomial distribution. The formula used was
where,
,
,
are the number of
dinucleotide, number of
base, number of
base and total number of bases in the segment of consideration. In this study,
referred to the whole genome length of various species.
2D visualization of dinucleotide distribution with Hilbert curve
2D visualization of the genome-wide distribution of dinucleotides, such as CpG and ApT, was performed using Hilbert method [Citation50,Citation51]. 1D occurrence vectors of dinucleotides on genomes of different species or its partial segments were extracted, and were used as inputs to produce 2D Hilbert visualization maps. All these steps were done within the package HilbertCurve [Citation51] of R, a language and environment for statistical computing and graphics.
Dinucleotide distance distribution
We calculated the distances (bp) between a dinucleotide site and its nearest k-th dinucleotide site of the same type. For example, if k = 25 and dinucleotide is CpG, the distance refers to the number of nucleobase pairs between a CpG and its following 25th CpG. Histograms of these distances were generated to illustrate the evenness of dinucleotide distribution along the genome.
CpG density
CpG density is defined as the number of CpG sites within a sliding window
. Sliding window was done by moving one base pair each time along the chromosome from start to end. The
sizes of 2500 bp was used in this study unless otherwise indicated.
DNA methylation level
Methylation level of each CpG site is represented by the fraction of methylated reads in total covered reads, and was calculated by
where is the number of Cytosine bases and
is the number of Thymine bases at the site of interest. Cytosine base here stands for methylated cytosine, since it remains as cytosine after bisulfite treatment; Thymine base stands for unmethylated cytosine, since it was converted to thymine by bisulfite treatment. The methylation levels of a genomic region, including COGs, promoters, exons, introns, sliding windows, were calculated by the grand method:
CpG density and DNA methylation rescaling
Modified Min-Max rescaling method was applied to make CpG density and DNA methylation levels comparable. Rather than using the maximum value as the rescale upper limit, 90% quantile was adopted to eliminate the side effects of outliers originating from sequencing and mapping errors. Herein, methylation is not confined to CpG sites, but extended to every site in the genome by the use of the sliding window approach. The methylation of a site refers to the grand methylation level (see equation 3) of the window centered at that site.
The rescaling formula used in our study is
where x is the value to be rescaled.
Complementary index
Rescaled CpG density and methylation level
shows some sort of mirror symmetry. We introduced complementary index (CI) to quantitatively measure this relationship. CI was calculated as
Genome partition algorithm (CGPA)
CpG density and DNA methylation level
are negatively correlated. However,
and
do not have a simple linear relationship but rather a very complicated one. To precisely describe the relationship between CpG density and DNA methylation level, a nonlinear model is proposed to fit the relationship between CpG density and DNA methylation level
where and
are parameters that should be determined during data fittings.
Generally, most of the data points are located around the fitted curve. Data points far away from the fitted curve are the most relevant to this study. To assign each genome site to one of the four categories, COG, COO, HMV and HEV, we introduced the concepts of complementary coefficient and differential coefficient
. Complementary coefficient is used to describe the distance between CpG sites and the nonlinear curve in
vector space, and differential coefficient is used to describe the relative difference between
and
. The formulas used to calculate
and
are
where
and
respectively.
Searching for the regions of COG, COO, HMV, and HEV
The whole genome was partitioned into COG, COO, HMV and HEV regions according to the and
values. In this study, genome partition was systematically established by first assigning each nucleotide site a label of one of the four categories (COG, COO, HMV, and HEV) and then applying Run-length encoding (RLE) algorithm to find the regions. Category of each site was determined by the levels of
and
which were partition into high (H), medium (M) and low (L) by the 20% and 80% quantiles of their distributions. Rules of how each kind of category were assigned is shown in the attached table in .
To limit the false positives and decrease the computation costs in our analysis, COGs and COOs were further filtered with the methylation level of COGs being lower than 0.65 and COOs being higher than 0.75.
ChIP-seq and RNA-seq data processing
Mouse and human ChIP-Seq reads were aligned to the reference genome mm9 and hg38 with Bowtie2 respectively [Citation52]. Peaks were called using MACS software [Citation53]. RNA-Seq data were aligned to the reference genome mm9 and hg38 with TopHat software [Citation54]. Expression value for Refseq gene was calculated with Cufflinks software [Citation55].
Predicting the target genes of tdCOGs
Target genes of tdCOGs were predicted according to the correlation between dynamic regulatory activity and gene expression across multiple tissues. Both prediction and validation steps were adopted in this study. In the predication step, H3K27ac signals and H3K4me3 signals were used to represent regulatory element activity and gene expression activity, and in the validation step H3K27ac signals and RNA-seq derived FPKM values were used, respectively, for human tissues. Due to the unavailability of some datasets in mouse tissues, we substituted H3K4me1 for H3K27ac and ChIP-seq derived PolII for FPKM. To make the results more reliable, H3K27ac signals greater than 50 and H3K4me1 greater than 30 were kept in our analysis. Genes are thought to be regulated by tdCOGs when the corresponding correlation coefficient is greater than 0.6. According to the latest research on 3D genome, regulatory elements and their target genes are usually located in the same topologically associated domain (TAD) [Citation56–Citation58]. In our study the distances between tdCOGs and their target genes were confined to be less than 5 Mbp, which is within the anticipated range for TAD.
Supplemental Material
Download Zip (22.6 MB)Supplemental Material
Download MS Word (18.9 MB)Disclosure statement
No potential conflict of interest was reported by the authors.
Supplementary material
Supplemental data for this article can be accessed here.
Additional information
Funding
Related Research Data
References
- Illingworth RS, Bird AP. CpG islands–’a rough guide’. FEBS Lett. 2009 Jun 5;583(11):1713–1720. PubMed PMID: 19376112.
- Gardiner-Garden M, Frommer M. CpG islands in vertebrate genomes. J Mol Biol. 1987 Jul 20;196(2):261–282. PubMed PMID: 3656447.
- Lister R, Pelizzola M, Kida YS, et al. Hotspots of aberrant epigenomic reprogramming in human induced pluripotent stem cells. Nature. 2011 Mar 3;471(7336):68–73. PubMed PMID: 21289626; PubMed Central PMCID: PMC3100360.
- Deaton AM, Bird A. CpG islands and the regulation of transcription. Genes Dev. 2011 May 15;25(10):1010–1022. PubMed PMID: 21576262; PubMed Central PMCID: PMC3093116.
- Zhang Y, Rohde C, Tierling S, et al. DNA methylation analysis of chromosome 21 gene promoters at single base pair and single allele resolution. PLoS Genet. 2009 Mar;5(3):e1000438. PubMed PMID: 19325872; PubMed Central PMCID: PMC2653639.
- Schultz MD, He Y, Whitaker JW, et al. Human body epigenome maps reveal noncanonical DNA methylation variation. Nature. 2015 Jul 9;523(7559):212–216. PubMed PMID: 26030523; PubMed Central PMCID: PMC4499021.
- Edwards JR, O’Donnell AH, Rollins RA, et al. Chromatin and sequence features that define the fine and gross structure of genomic methylation patterns. Genome Res. 2010 Jul;20(7):972–980. PubMed PMID: 20488932; PubMed Central PMCID: PMC2892098.
- Krebs AR, Dessus-Babus S, Burger L, et al. High-throughput engineering of a mammalian genome reveals building principles of methylation states at CG rich regions. eLife. 2014 Sep 26;(3):e04094. PubMed PMID: 25259795; PubMed Central PMCID: PMC4381937.
- Kribelbauer JF, Laptenko O, Chen S, et al. Quantitative analysis of the DNA methylation sensitivity of transcription factor complexes. Cell Rep. 2017 Jun 13;19(11):2383–2395. PubMed PMID: 28614722; PubMed Central PMCID: PMC5533174.
- Yin Y, Morgunova E, Jolma A, et al. Impact of cytosine methylation on DNA binding specificities of human transcription factors. Science. 2017 May 5;356(6337):eaaj2239. PubMed PMID: 28473536.
- Riggs AD. X inactivation, differentiation, and DNA methylation. Cytogenet Cell Genet. 1975;14(1):9–25. PubMed PMID: 1093816.
- Holliday R, Pugh JE. DNA modification mechanisms and gene activity during development. Science. 1975 Jan 24;187(4173):226–232. PubMed PMID: 1111098.
- Li E, Bestor TH, Jaenisch R. Targeted mutation of the DNA methyltransferase gene results in embryonic lethality. Cell. 1992 Jun 12;69(6):915–926. PubMed PMID: 1606615.
- Smith ZD, Meissner A. DNA methylation: roles in mammalian development. Nat Reviews Genet. 2013 Mar;14(3):204–220. PubMed PMID: 23400093.
- Okano M, Bell DW, Haber DA, et al. DNA methyltransferases Dnmt3a and Dnmt3b are essential for de novo methylation and mammalian development. Cell. 1999 Oct 29;99(3):247–257. PubMed PMID: 10555141.
- Lovkvist C, Dodd IB, Sneppen K, et al. DNA methylation in human epigenomes depends on local topology of CpG sites. Nucleic Acids Res. 2016 Jun 20;44(11):5123–5132. PubMed PMID: 26932361; PubMed Central PMCID: PMC4914085.
- Jones PA, Liang G. Rethinking how DNA methylation patterns are maintained. Nat Reviews Genet. 2009 Nov;10(11):805–811. PubMed PMID: 19789556; PubMed Central PMCID: PMC2848124.
- Liang G, Chan MF, Tomigahara Y, et al. Cooperativity between DNA methyltransferases in the maintenance methylation of repetitive elements. Mol Cell Biol. 2002 Jan;22(2):480–491. PubMed PMID: 11756544; PubMed Central PMCID: PMC139739.
- He YF, Li BZ, Li Z, et al. Tet-mediated formation of 5-carboxylcytosine and its excision by TDG in mammalian DNA. Science. 2011 Sep 2;333(6047):1303–1307. PubMed PMID: 21817016; PubMed Central PMCID: PMC3462231.
- Williams K, Christensen J, Pedersen MT, et al. TET1 and hydroxymethylcytosine in transcription and DNA methylation fidelity. Nature. 2011 May 19;473(7347):343–348. PubMed PMID: 21490601; PubMed Central PMCID: PMC3408592.
- Riggs AD, Xiong Z. Methylation and epigenetic fidelity. Proc Natl Acad Sci USA. 2004 Jan 6;101(1):4–5. PubMed PMID: 14695893; PubMed Central PMCID: PMC314126.
- Turker MS, Swisshelm K, Smith AC, et al. A partial methylation profile for a CpG site is stably maintained in mammalian tissues and cultured cell lines. J Biol Chem. 1989 Jul 15;264(20):11632–11636. PubMed PMID: 2545677.
- Cooper DN, Mort M, Stenson PD, et al. Methylation-mediated deamination of 5-methylcytosine appears to give rise to mutations causing human inherited disease in CpNpG trinucleotides, as well as in CpG dinucleotides. Hum Genomics. 2010 Aug;4(6):406–410. PubMed PMID: 20846930; PubMed Central PMCID: PMC3525222.
- Portela A, Esteller M. Epigenetic modifications and human disease. Nat Biotechnol. 2010 Oct;28(10):1057–1068. PubMed PMID: 20944598.
- Zhu J, He F, Hu S, et al. On the nature of human housekeeping genes. Trends Genet. 2008 Oct;24(10):481–484. PubMed PMID: 18786740.
- Esteller M. Epigenetic gene silencing in cancer: the DNA hypermethylome. Hum Mol Genet. 2007 Apr 15;16(Spec No 1):R50–9. PubMed PMID: 17613547.
- Wilson AS, Power BE, Molloy PL. DNA hypomethylation and human diseases. Biochim Biophys Acta. 2007 Jan;1775(1):138–162. PubMed PMID: 17045745.
- Hattori N, Ushijima T. Compendium of aberrant DNA methylation and histone modifications in cancer. Biochem Biophys Res Commun. 2014 Dec 5;455(1–2):3–9. PubMed PMID: 25194808.
- Heyn H, Vidal E, Ferreira HJ, et al. Epigenomic analysis detects aberrant super-enhancer DNA methylation in human cancer. Genome Biol. 2016 Jan 26;17:11. PubMed PMID: 26813288; PubMed Central PMCID: PMC4728783.
- Li M, Chen WD, Papadopoulos N, et al. Sensitive digital quantification of DNA methylation in clinical samples. Nat Biotechnol. 2009 Sep;27(9):858–863. PubMed PMID: 19684580; PubMed Central PMCID: PMC2847606.
- Goelz SE, Vogelstein B, Hamilton SR, et al. Hypomethylation of DNA from benign and malignant human colon neoplasms. Science. 1985 Apr 12;228(4696):187–190. PubMed PMID: 2579435.
- Gaudet F, Hodgson JG, Eden A, et al. Induction of tumors in mice by genomic hypomethylation. Science. 2003 Apr 18;300(5618):489–492. PubMed PMID: 12702876.
- Hon GC, Rajagopal N, Shen Y, et al. Epigenetic memory at embryonic enhancers identified in DNA methylation maps from adult mouse tissues. Nat Genet. 2013 Oct;45(10):1198–1206. PubMed PMID: 23995138; PubMed Central PMCID: PMC4095776.
- Liao J, Karnik R, Gu H, et al. Targeted disruption of DNMT1, DNMT3A and DNMT3B in human embryonic stem cells. Nat Genet. 2015 May;47(5):469–478. PubMed PMID: 25822089; PubMed Central PMCID: PMC4414868.
- Shen Y, Yue F, McCleary DF, et al. A map of the cis-regulatory sequences in the mouse genome. Nature. 2012 Aug 2;488(7409):116–120. PubMed PMID: 22763441; PubMed Central PMCID: PMC4041622.
- Heintzman ND, Hon GC, Hawkins RD, et al. Histone modifications at human enhancers reflect global cell-type-specific gene expression. Nature. 2009 May 7;459(7243):108–112. PubMed PMID: 19295514; PubMed Central PMCID: PMC2910248.
- Illingworth R, Kerr A, Desousa D, et al. A novel CpG island set identifies tissue-specific methylation at developmental gene loci. PLoS Biol. 2008 Jan;6(1):e22. PubMed PMID: 18232738; PubMed Central PMCID: PMC2214817.
- Takai D, Jones PA. Comprehensive analysis of CpG islands in human chromosomes 21 and 22. Proc Natl Acad Sci USA. 2002 Mar 19;99(6):3740–3745. PubMed PMID: 11891299; PubMed Central PMCID: PMC122594.
- Saito Y, Tsuji J, Mituyama T. Bisulfighter: accurate detection of methylated cytosines and differentially methylated regions. Nucleic Acids Res. 2014 Apr;42(6):e45. PubMed PMID: 24423865; PubMed Central PMCID: PMC3973284.
- Hansen KD, Langmead B, Irizarry RA. BSmooth: from whole genome bisulfite sequencing reads to differentially methylated regions. Genome Biol. 2012 Oct 3;13(10):R83. PubMed PMID: 23034175; PubMed Central PMCID: PMC3491411.
- Wen Y, Chen F, Zhang Q, et al. Detection of differentially methylated regions in whole genome bisulfite sequencing data using local Getis-Ord statistics. Bioinformatics. 2016 Nov 15;32(22):3396–3404. PubMed PMID: 27493194.
- Akalin A, Kormaksson M, Li S, et al. methylKit: a comprehensive R package for the analysis of genome-wide DNA methylation profiles. Genome Biol. 2012 Oct 3;13(10):R87. PubMed PMID: 23034086; PubMed Central PMCID: PMC3491415.
- Dolzhenko E, Smith AD. Using beta-binomial regression for high-precision differential methylation analysis in multifactor whole-genome bisulfite sequencing experiments. BMC Bioinformatics. 2014 Jun 24;15:215. PubMed PMID: 24962134; PubMed Central PMCID: PMC4230021.
- Forrest AR, Kawaji H, Rehli M, et al. A promoter-level mammalian expression atlas. Nature. 2014 Mar 27;507(7493):462–470. PubMed PMID: 24670764; PubMed Central PMCID: PMC4529748.
- Heinz S, Benner C, Spann N, et al. Simple combinations of lineage-determining transcription factors prime cis-regulatory elements required for macrophage and B cell identities. Mol Cell. 2010 May 28;38(4):576–589. PubMed PMID: 20513432; PubMed Central PMCID: PMC2898526.
- Kent WJ, Sugnet CW, Furey TS, et al. The human genome browser at UCSC. Genome Res. 2002 Jun;12(6):996–1006. PubMed PMID: 12045153; PubMed Central PMCID: PMC186604.
- Karolchik D, Hinrichs AS, Furey TS, et al. The UCSC Table Browser data retrieval tool. Nucleic Acids Res. 2004 Jan 1;32(Database issue):D493–6. PubMed PMID: 14681465; PubMed Central PMCID: PMC308837.
- Otto C, Stadler PF, Hoffmann S. Fast and sensitive mapping of bisulfite-treated sequencing data. Bioinformatics. 2012 Jul 1;28(13):1698–1704. PubMed PMID: 22581174.
- Wu H, Caffo B, Jaffee HA, et al. Redefining CpG islands using hidden Markov models. Biostatistics. 2010 Jul;11(3):499–514. PubMed PMID: 20212320; PubMed Central PMCID: PMC2883304.
- Anders S. Visualization of genomic data with the Hilbert curve. Bioinformatics. 2009 May 15;25(10):1231–1235. PubMed PMID: 19297348; PubMed Central PMCID: PMC2677744.
- Gu Z, Eils R, Schlesner M. HilbertCurve: an R/Bioconductor package for high-resolution visualization of genomic data. Bioinformatics. 2016 Aug 1;32(15):2372–2374. PubMed PMID: 27153599.
- Langmead B, Salzberg SL. Fast gapped-read alignment with Bowtie 2. Nat Methods. 2012 Mar 4;9(4):357–359. PubMed PMID 22388286; PubMed Central PMCID: PMC3322381.
- Zhang Y, Liu T, Meyer CA, et al. Model-based analysis of ChIP-Seq (MACS). Genome Biol. 2008;9(9):R137. . PubMed PMID: 18798982; PubMed Central PMCID: PMC2592715
- Trapnell C, Pachter L, Salzberg SL. TopHat: discovering splice junctions with RNA-Seq. Bioinformatics. 2009 May 1;25(9):1105–1111. PubMed PMID: 19289445; PubMed Central PMCID: PMC2672628.
- Trapnell C, Williams BA, Pertea G, et al. Transcript assembly and quantification by RNA-Seq reveals unannotated transcripts and isoform switching during cell differentiation. Nat Biotechnol. 2010 May;28(5):511–515. PubMed PMID: 20436464; PubMed Central PMCID:PMC3146043.
- Jin F, Li Y, Dixon JR, et al. A high-resolution map of the three-dimensional chromatin interactome in human cells. Nature. 2013 Nov 14;503(7475):290–294. PubMed PMID: 24141950; PubMed Central PMCID: PMC3838900.
- Dekker J, Marti-Renom MA, Mirny LA. Exploring the three-dimensional organization of genomes: interpreting chromatin interaction data. Nat Reviews Genet. 2013 Jun;14(6):390–403. PubMed PMID: 23657480; PubMed Central PMCID: PMC3874835.
- Pope BD, Ryba T, Dileep V, et al. Topologically associating domains are stable units of replication-timing regulation. Nature. 2014 Nov 20;515(7527):402–405. PubMed PMID: 25409831; PubMed Central PMCID: PMC4251741.