
ABSTRACT
Recent studies have revealed an unexpected role of DNA methylation at promoter regions in transcription activation. However, whether DNA methylation at enhancer regions activates gene expression and influences cellular functions remains to be determined. In this study, by employing the transcription factor krÜppel-like factor 4 (KLF4) that binds to methylated CpGs (mCpGs), we investigated the molecular outcomes of the recruitment of KLF4 to mCpGs at enhancer regions in human glioblastoma cells. First, by integrating KLF4 ChIP-seq, whole-genome bisulfite sequence, and H3K27ac ChIP-seq datasets, we found 1,299 highly methylated (β >0.5) KLF4 binding sites, three-quarters of which were located at putative enhancer regions, including gene bodies and intergenic regions. In the meantime, by proteomics, we identified 16 proteins as putative targets upregulated by KLF4-mCpG binding at enhancer regions. By chromosome conformation capture (3C) analysis, we demonstrated that KLF4 bound to methylated CpGs at the enhancer regions of the B-cell lymphocyte kinase (BLK) and Lim domain only protein 7 (LMO7) genes, and activated their expression via 3D chromatin loop formation with their promoter regions. Expression of mutant KLF4, which lacks KLF4 ability to bind methylated DNA, or removal of DNA methylation in enhancer regions by a DNA methyltransferase inhibitor abolished chromatin loop formation and gene expression, suggesting the essential role of DNA methylation in enhancer-promoter interactions. Finally, we performed functional assays and showed that BLK was involved in glioblastoma cell migration. Together, our study established the concept that DNA methylation at enhancer regions interacts with transcription factors to activate gene expression and influence cellular functions.
Introduction
The Cancer Genome Atlas (TCGA) shows many cancer driver genes that have been found to encode epigenetic modulators that directly regulate chromatin through modifications of DNA or histones [Citation1]. Functional analysis of how cancer driver genes and cancer epigenetics contribute to tumorigenesis and tumor progression will help us identify novel therapeutic targets for a variety of cancers, including malignant brain tumors. The grade IV glioma, glioblastoma (GBM), is the most aggressive and lethal adult brain tumor with ~15 months median survival, despite modern treatments. Both genetic and epigenetic alterations have been shown to drive GBM malignancy; however, a mechanistic understanding of how epigenetic systems regulate gene transcription and GBM progression is still largely unknown [Citation2].
In higher eukaryotes, DNA methylation mostly occurs on a cytosine that is adjacent to a guanine in what is called a CpG dinucleotide. These CpGs are spread all over the genome and ~70% of genomic CpGs are methylated [Citation3]. Cytosine methylation at CpG dinucleotides (mCpG) in the promoter regions has been widely associated with downstream transcriptional repression, and the negative correlation between DNA methylation and gene repression has been well documented [Citation4]. The mechanisms by which DNA methylation perturbs gene transcription include the physical obstruction of transcription factors (TF) to their consensus binding sites, or recruitment of methyl-CpG binding proteins to establish silent chromatin [Citation5]. However, this traditional view has been challenged by several recent studies. First, a handful of TFs, especially C2H2 zinc finger proteins, were anecdotally identified to specifically bind to methylated DNA sequences [Citation6]. Second, Mann et al. employed a methylated-CpG microarray and discovered that two of twelve tested basic leucine zipper TFs could bind to mCpG-containing DNAs [Citation7]. Third, in early 2013, using mass spectrometry analysis and methylated DNA sequences as baits, Spruijt et al. found 19 proteins from mouse embryonic stem cell nuclear extracts could specifically bind to methylated DNA [Citation8]. Recently, Yin et al. [Citation9] identified a number of TFs that can bind to methylated DNA using methylation-sensitive systematic evolution of ligands by exponential enrichment. Finally, we have employed a protein microarray-based approach and found that 42 human TFs, including krÜppel-like factor 4 (KLF4), recognize mCpG-containing DNA motifs [Citation10]. Moreover, specific mCpG-dependent TF-DNA interactions were found to transactivate downstream gene expression. All these findings point out that some TFs might serve as ‘epigenetic readers’ and regulate gene expression and cell phenotypes in a methylation-dependent manner.
Using zinc finger TF KLF4 as the first candidate, we investigated the biological function of KLF4’s mCpG-dependent binding activity in human brain tumor cells [Citation10,Citation11]. By using a site specific KLF4 mutant named KLF4 R458A that lacks binding ability to mCpG but retains KLF4’s binding to its canonical, non-methylated motif, we discovered that KLF4-mCpG interactions could activate gene expression [Citation10]. In a follow-up study we found that KLF4 promoted brain tumor cell adhesion and migration via binding to mCpGs in the promoter regions of cell motility genes, including RHOC and RAC1 [Citation11]. However, the function of KLF4-mCpG interactions at enhancer regions remains elusive.
We also identified many other direct targets of KLF4-mCpG binding such as B-cell lymphocyte kinase (BLK), a member of the Src tyrosine kinase family. The Src family consists of non-receptor tyrosine kinases, such as Lyn, Lck, Hck, and Blk. Src kinases mediate the signal transduction of multiple cellular processes including migration, adhesion, invasion, angiogenesis, proliferation, and differentiation. BLK is primarily expressed by B lineage cells but it is also expressed in non B-lineage cell types such as pancreatic β cells and human thymocytes [Citation12]. BLK is activated upon B-cell receptor (BCR) stimulation and phosphorylates downstream targets in the BCR signaling pathway [Citation13]. Besides a role in B-cell receptor signaling and B-cell development, BLK has been implicated in GTPase RhoA signaling and cell invasion [Citation14].
In the current study, we focused our studies on methylation-dependent TF-enhancer interactions in gene regulation and cellular function. Through chromosome conformation capture (3C) analysis, we found BLK was activated by KLF4 binding to mCpGs at enhancer regions. In addition, we found that on a genome-wide scale, KLF4 bound to methylated enhancers and activated gene transcription.
Materials and methods
Reagents and cell cultures
All reagents were purchased from Sigma-Aldrich (St. Louis, MO) unless otherwise stated. Doxycline (Dox) was diluted to a concentration of 1 μg/ml in cell culture medium as a working concentration. The human glioblastoma (GBM) cell line U87 was originally purchased from ATCC (Manassas, VA). It is free from mycoplasma and authenticated with short tandem repeat (STR) profiling by Johns Hopkins Genetic Resources Core facility using Promega GenePrint 10 system (Madison, WI). U87 cells were cultured in Minimum Essential Media (MEM, Thermo Fisher Scientific, Grand Island, NY) supplemented with sodium pyruvate (1%), sodium bicarbonate (2%), non-essential amino acid (1%) and 10% fetal calf serum (FCS, Gemini Bio-products, West Sacramento, CA) [Citation15]. Cells were incubated in a humidified incubator containing 5% CO2/95% air at 37°C, and passaged every 4–5 days.
Proteomics and quantitative mass spectrometry statistical analysis
Total cellular proteins from KLF4 wide type (KLF4 WT)- and KLF4 R458A-expressing U87 cells were extracted with radioimmunoprecipitation assay buffer containing protease and phosphatase inhibitors (Calbiochem, Billerica, MA). Quantitative mass spectrometry performed at Johns Hopkins Mass Spectrometry Core to identify proteins in these cells [Citation16]. The protein extracts (100 μg each) were trichloroacetic acid (TCA)/acetone precipitated and re-suspended in 20 μL 500 mM triethyl ammonium bicarbonate (TEAB) and 1 μL 2% SDS. Each sample was reduced by adding 2 μL 50 mM tris-(2-carboxyethyl) phosphine (TCEP) for 1 h at 60°C, alkylated by 1 μL 200 mM methyl methanethiosuphonate (MMTS) for 15 min at room temperature, then digested at 37°C overnight with trypsin (Promega, Madison, WI) using a 1:10 enzyme to protein ratio. Samples were labeled by adding 100 μL of an iTRAQ reagent (dissolved in 50 μL isopropanol) and incubating at room temperature for 2 h. All samples were combined and 90 μL (equivalent to 100 μg) of the combined peptide sample was dissolved in 4 mL of loading buffer (25% v/v acetonitrile, 10 mM KH2PO4, pH 2.8). The sample was then fractionated by strong cation exchange (SCX) chromatography on an Agilent 1200 Capillary HPLC system using a PolySulfoethyl A column (2.1 x 100mm, 5 μm, 300 Å, PolyLC, Columbia, MD). The sample was loaded and washed isocratically with 25% v/v acetonitrile, 10 mM KH2PO4, pH 2.8 for 40 min at 250 μL/min. Peptides were eluted and collected in 1min fractions using a 0–350 mM KCl gradient in 25% v/v acetonitrile, 10 mM KH2PO4, pH 2.8, over 40 min at 250 μL/min, monitoring elution at 214 nm. The SCX fractions were dried, re-suspended in 200 μL 0.05% trifluoroacetic acid (TFA). Fractions 1–12 and 35–40 were combined based on low absorbance at 214 nm, resulting in 24 fractions, which were then desalted using an Oasis HLB uElution plate (Waters, Milford, MA).
For liquid chromatography–mass spectrometry (LC-MS) analysis, desalted peptides were loaded for 15 min at 750 nl/min directly on to a 75 μm x 10 cm PicoFrit (PF3360-75–15-N-5, New Objective, Woburn, MA) column with a 15 μm emitter in-house packed with Magic C18AQ (5 μm, 120 Å, Michrom Bioresources, Auburn, CA). Peptides were eluted using 90% acetonitrile in 0.1% formic acid over 120 min at 300 nl/min. Eluting peptides were sprayed directly into an LTQ Orbitrap Velos mass spectrometer (Thermo Scientific, Grand Island, NY) at 2.0 kV. Survey scans were acquired from 350–1800 m/z with up to 10 peptide masses (precursor ions) individually isolated with a 1.2 Da window and fragmented (MS/MS) using a collision energy of 38 and 30 s dynamic exclusion. Precursor and the fragment ions were analyzed at 30,000 and 7,500 resolutions, respectively.
For protein quantification and identification, isotopically resolved masses in MS and MS/MS spectra were extracted with and without de-convolution using Thermo Scientific Xtract software. Deconvoluting spectra facilitates database searches of high (>+4) charge state precursor masses and their fragments. Both data sets were searched against the RefSeq 40 database using Mascot (Matrix Science, www.matrixscience.com) through Proteome Discoverer software (v1.3, Thermo Scientific) specifying samples species, trypsin as the enzyme allowing one missed cleavage, fixed cysteine methylthiolation and 8-plex-iTRAQ labeling of N-termini, and variable methionine oxidation and 8-plex-iTRAQ labeling of lysine and tyrosine. Peptide identifications from Mascot searches were processed within the Proteome Discoverer to identify peptides with a confidence threshold 1% False Discovery Rate (FDR), based on a concatenated decoy database search. PD1.3 uses only the peptide identification with the highest mascot score from the same peptide matched spectrum before and after deconvolution by the Xtract function.
For statistical analysis, only spectra with a false discovery rate smaller than 1% and mass isolation interference smaller than 30%, in which all reporter ions were detected, were included for downstream analyses. Individual protein relative abundances were calculated by a robust median-sweep algorithm as described in detail in [Citation17,Citation18]. Briefly, reporter ion intensities were log2-transformed, spectrum medians of the log2 transformed reporter ion intensities were subtracted (median-polishing), and all reporter ion intensities that belong to the same protein were summarized by their median value. In a final step, the channel medians across all proteins were subtracted to correct for potential loading differences. Only proteins quantified by reporter ion spectra from more than one peptide were included for statistical downstream analyses. Relative protein abundances were compared between KLF4 WT+/- Dox as well as between KLF4 R458A+/- Dox. Statistical inference between two groups of interest was assessed by moderated t-test statistics [Citation18,Citation19]. Proteins were declared as differentially expressed proteins (DEPs) if their P values were smaller than 0.01 and absolute values of fold change (FC) were larger than 0.5 between different groups.
Lentiviral transduction
KLF4 WT and R458A constructs were engineered as previously described [Citation11]. Briefly, KLF4 WT and R458A constructs were inserted into a doxycycline-inducible TripZ viral vector (Thermo Fisher Scientific) [Citation20]. BLK shRNA lentiviral vectors and control non-silencing shRNA were purchased from Johns Hopkins. Virus was packaged using the Viral Power Packaging system (Thermo Fisher Scientific) according to the manufacturer’s forward transduction instructions. Virus were collected by centrifuging at 3,000 rpm for 15 min. GBM cells were transduced with virus containing control or BLK shRNA for 48 h prior to puromycin selection (1 μg/ml).
Quantitative real-time PCR
Total RNA was extracted using RNeasy Mini Kit (Qiagen, Mansfield, MA). After reverse transcription using MuLV reverse transcriptase (Applied Biosystems, Carlsbad, CA) and Oligo(dT) primer, quantitative real-time PCR (qRT-PCR) was performed using SYBR Green PCR Mix (Applied Biosystems) and IQ5 detection system (Bio-Rad, Hercules, CA). Primer sequences are listed in . Relative gene was normalized to 18S rRNA [Citation21].
Table 1. Primer sequences used in the work.
Immunoblot and immunocytochemistry
Total cellular protein was extracted as described elsewhere [Citation22]. SDS-PAGE was performed with 30 μg total proteins using 4% to 12% gradient Tris-glycine gels (Lonza, Williamsport, PA). Western blot analysis was performed using the Quantitative Western Blot System, with secondary antibodies labeled by IRDye infrared dyes (LI-COR Biosciences) [Citation15,Citation23]. Antibodies were purchased from: Santa-Cruz, Dallas, TX (anti-KLF4) and Cell signaling, Danvers, MA (anti-BLK).
Chromatin immunoprecipitation PCR (ChIP)-PCR
A commercial ChIP-grade anti-KLF4 antibody (H180; Santa Cruz) recognizing the N-terminal region of KLF4 was used for ChIP (DNA-binding domains of KLF4 are located to the C-terminus). Tet-on KLF4 WT and R458A cells were treated with Dox for 48 h followed by ChIP using the anti-KLF4 antibody and Dynabeads Protein A/G (Thermo Fisher Scientific) according to a protocol described previously [Citation10,Citation11]. Primers targeting KLF4 binding sites were identified from previous ChIP-seq analysis [Citation11].
Assessment of CpG methylation status by bisulfite sequencing
Sanger bisulfite sequencing was performed as previously described [Citation10]. Purified genomic DNA from GBM cells were treated by EZ DNA Methylation-Direct Kit (Zymo Research, Irvine, CA). After bisulfite conversion, regions of interest were PCR-amplified using Taq polymerase. The primers used for bisulfite sequencing were listed in . PCR products were gel-purified and cloned into a TA vector (Thermo Fisher Scientific). Individual clones were sequenced (Genewiz, Cambridge, MA) and aligned with the reference sequence.
Chromosome conformation capture (3C)
Chromosome conformation capture (3C) experiments were performed as described in Splinter et al. [Citation24] with some modifications. Cultured cells were made single‐cell suspension and fixed by adding formaldehyde to a final concentration of 2% followed by incubation for 10 min at room temperature. Cross‐linking was stopped by adding glycine to a final concentration of 1 M, and the samples were put on ice immediately to quench the cross-linking reaction. The cell pellets were then collected by centrifugation, re-suspended in 1 mL cold lysis buffer (50 mM Tris–HCl pH 7.5, 150 mM NaCl, 5 mM EDTA, 0.5% NP-40, 1% Triton X-100) with 1x complete protease inhibitors, and incubated 10 min on ice. After centrifugation, the pellets were dissolved in 600 µl restriction buffer (containing 60 µL 10x restriction buffer and 0.25% SDS), incubated for 1 h at 37°C with shaking at 900 RPM, followed by incubated in 2.5% Triton X‐100 for another hour. Restriction enzyme HindIII (600 U) was used to digest the genome DNA by incubating at 37°C overnight with shaking at 900 RPM. The reaction was inactivated by incubation at 65°C for 20 min. The DNA fragments were end‐repaired by incubation with T4 DNA ligase overnight at 16°C. For reverse cross-linking, the reaction was incubated with 30 µL proteinase K (10 mg/ml) overnight at 65°C, followed by 30 µL RNase A (10 mg/ml) at 37°C for 45 min. DNA fragments were precipitated by phenol–chloroform extraction. Finally, the air-dried samples were dissolved in 150 µL 10 mM Tris–HCl pH 7.5 and purified with the QIAquick PCR purification kit (Qiagen). During the 3C experiments, we quality controlled each step of the 3C procedure by electrophoresis and detected a smear band of ~6–12 kb from the undigested samples, a large smear band of 300 bp-5 kb from the digested samples, and a single band of >10 kb from ligated sample.
The 3C templates were ready for PCR amplification. The sequences of primers used in 3C assays are shown in . To ensure amplification and quantification were in the linear range, we analyzed the PCR linearity by serial titration experiment to optimize the amount of 3C products used for PCR. We selected the template concentration from the middle of a linear region of the amplification curve to avoid both saturation of a signal and loss of a signal. For quantification, generally, the interaction frequency of two fragments (chromosome proximities) was calculated by dividing the amount of PCR product obtained from the 3C ligation product library by the amount of PCR product obtained from a control library. For our 3C studies, we were interested in the relative frequency of chromosome proximity of two fragments in control and Dox treated cells, therefore, we did not use a control library.
Adhesion and transwell migration assay
For adhesion assay, cells were plated at a density of 4 × 10⁵ cells/well in 24 well plates. After 2 h incubation at 37°C, plates were shaken at 2000 rpm for 15 seconds, washed twice with pre-warmed PBS, and the number of remaining adherent cells were measured with MTT assays
Cell migration assays were performed using transwell chambers as we previously described [Citation25]. The upper chamber was filled with U87 culture media without FBS, and the lower chamber medium DMEM with 10% FBS. After 8–24 h, cells that had migrated through the filter were fixed with Diff-Quick kit (Thermo Fisher Scientific). Cells on the upper side of the transwells were gently wiped off with Q-tips. Cells migrating through the filter were stained with 4ʹ-6-Diamidino-2-phenylindole (DAPI). Migration was quantified by counting cells on five selected fields of view (middle, upper, lower, left, and right) per transwell in at least three independent experiments [Citation25].
Scratch assay
GBM cells were grown under 10% FCS medium in 35 mm dishes until confluency. Several scratches were created using a 10 μl pipette tip through the confluent cells. Dishes were washed with phosphate buffered saline (PBS) for 3 times and cells were grown in 0.1% FCS medium for 24–48 h. Phase contrast pictures were taken at different time points. The width of the scratch was measured and areas of wound healing were measured and quantified using ImageJ (NIH).
Statistical analysis
Statistical analysis was performed using Prism software (GraphPad, La Jolla, CA). Post hoc tests included the Students t-test and Tukey multiple comparison tests as appropriate. All data are represented as mean value ± standard error of mean (S.E.): significance was set at P <0.05.
Bioinformatics analysis
We integrated three whole-genome datasets to identify potential enhancer regions associated with KLF4 methylation-dependent binding activities. The large-scale data include KLF4 Chromatin immunoprecipitation-sequencing (ChIP-seq), whole-genome bisulfite sequencing (WGBS) and histone H3K27ac ChIP-seq data generated in Wan et al. [Citation11]. All the raw data for our large-scale studies have been deposited in GEO (GSE97632). The link is:
https://www.ncbi.nlm.nih.gov/geo/query/acc.cgi?token=wjydoqaqxzgnxwz&acc=GSE97632.
The methods to generate this data have been described in detail in Wan et al. [Citation11].
Results
Global analysis of KLF4-mCpG interactions at enhancer regions
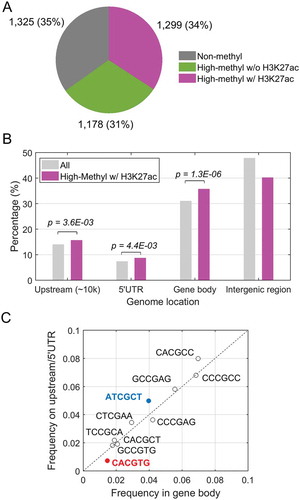
In our previous studies [Citation10,Citation11], we established human glioblastoma (GBM) U87 cell lines expressing doxycycline (Dox)-inducible KLF4 wild type (KLF4 WT). We set to identify KLF4 binding sites at highly methylated enhancer regions by integrating our published genome-wide analysis including KLF4 ChIP-seq, whole-genome bisulfite sequencing and the histone mark H3K27ac ChIP-seq data in U87 cells [Citation11]. A total of 3,802 KLF4 binding fragments were identified in U87 cells [Citation11]. To identify mCpG-dependent KLF4 binding sequences, we overlapped KLF4 binding sites derived from our ChIP-seq data with whole genome bisulfite sequencing data [Citation11], and identified highly methylated KLF4 binding seq. Among them, 2,477 had at least one highly methylated CpG site (β >0.5) based on whole genome bisulfite sequencing data [Citation11]. Considering the histone mark H3K27ac as a gene activation mark, we identified 1,299 KLF4 binding fragments as putative methylated enhancer/promoter regions in U87 cells (). Of these 1,299 KLF4 binding peaks, 15.6% were found at gene upstream region (10 kb upstream of the transcription starting site), while 8.6% within 5ʹUTR region (from transcription starting site to translational start site). The other three quarters of the KLF4-mCpG binding sites tends to occur at putative enhancer regions, about half of which were found in gene bodies (35.7%), and the rest in intergenic regions (). Compared with all KLF4 binding peaks at these four regions, the occurrence of highly methylated KLF4 binding sites associated with H3K27ac at gene bodies was significantly higher (35.7% vs 30.9%, P = 1.3 × 10⁻⁶), consistent with their putative role as an enhancer. We used the previously identified [Citation11] ten 6-mer KLF4-mCpG binding motifs (5ʹ- CCCGCC/CTCGGC/ATCGCT/CTCGAA/CACGTG/CACGCT/CACGCC/CCCGAG/CACGGC/TCCGCA-3ʹ) and compared their occurrences at gene bodies and gene upstream/5ʹUTR regions to determine whether these 6-mer motifs have any preference to enhancer regions. KLF4 binding to some of these motifs, such as CCmCGCC, has already been validated in our previous study [Citation10]. Among the 10 methyl-CpG containing motifs, those around the zero effect line (diagnose line) did not have location preference in regard to gene body and gene upstream/5ʹUTR. Only two highlighted motifs (5ʹ-CACGTG, P = 6.6 × 10⁻⁴ and 5ʹ-ATCGCT, P = 7.5 × 10⁻³) tend to locate at either gene body or gene upstream/5ʹUTR, respectively (). Our data analyses suggest that DNA methylation at enhancer regions dictates transcription factor binding on the genome-wide scale.
Figure 1. Global analysis of KLF4 binding to mCpGs at enhancer regions. A. Integration of KLF4 ChIP-seq, whole-genome bisulfite sequencing and H3K27ac ChIP-seq data in human glioblastoma U87 cells. A total of 1,299 highly methylated KLF4 binding sites were found to be occupied by enhancer marks as well. B. Distribution of the 1,299 KLF4 binding sites at 10 kb upstream, 5ʹUTR, gene body, and intergenic region. Compared with all KLF4 binding sites, KLF4-mCpG binding sites associated with the H3K27ac mark were significantly enriched in gene bodies. C. Motif analysis of the KLF4-mCpG binding sequences showing location preference at either gene body or upstream/5ʹUTR region.
Identification of protein expression regulated by KLF4-mCpG binding
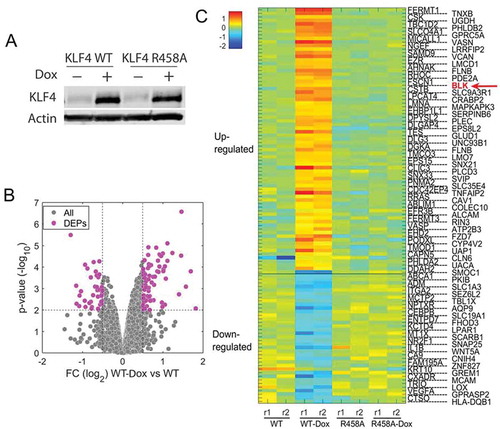
To narrow down our candidate list regulated by KLF4-mCpG binding at enhancer regions, we examined the expression of KLF4-mCpG regulated targets at the protein level. By using U87 cells expressing KLF4 R458A mutant, which lacks KLF4 binding to methylated CpGs, we performed proteomics analysis to identify proteins altered by KLF4 WT or KLF4 R458A. The differentially expressed proteins would be putative KLF4-mCpG targets. Cells were treated with Dox for 48 h to induce KLF4 protein expression (). Global protein expression profiles were obtained under four conditions: U87 KLF4 WT +/- Dox and U87 KLF4 R458R +/- Dox. In total, we detected 6875 proteins (or 7008 isoforms) under all four conditions from our proteomics analysis, among which 73 and 37 were significantly up- or down-regulated by KLF4 WT, with a fold change larger than 0.5 or smaller than −0.5 (in base – log2 scale), respectively (, P <0.01). Since these proteins had no remarkable alteration after KLF4 R458A expression, they were determined as differentially expressed proteins (DEPs) and, therefore, putative KLF4-mCpG targets. The expression levels of differentially expressed proteins (DEPs) are shown in . We found that some proteins were increased by KLF4 WT but not KLF4 R458A at the protein level, consistent with our previous studies [Citation11], e.g., the small GTPase Ras Homolog Family Member C (RHOC), B lymphocyte kinase (BLK), LIM Domain 7 (LMO7), and Neuronal Guanine Nucleotide Exchange Factor (NGEF). Another validated KLF4-mCpG target, UDP-glucose-6-dehydrogenase (UGDH), was also found upregulated by KLF4 in our proteomics studies [Citation26].
Figure 2. Proteins regulated by KLF4-mCpG interactions in U87 cells. A. U87 KLF4 WT and U87 KLF4 R458A cells were treated with Dox (1 µg/ml) for 48 h. Western blot analysis verified the induction of KLF4 WT and KLF4 R458A proteins. B. Volcano plot of differentially expressed proteins (DEPs) regulated by KLF4 WT. Protein samples were collected from untreated (WT) and Dox treated U87 KLF4 WT (Dox) cells, and subjected to mass spectrometry for protein analysis. C. Heatmap of differentially expressed proteins regulated by KLF4 WT and KLF4 R458A. In total, expression of 110 proteins was altered by KLF4 WT, but not by KLF4 R458A, out of which 73 proteins were upregulated and 37 were downregulated by KLF4 WT.
Although we have previously reported that methylation-dependent KLF4 binding at promoter regions activated gene expression, this gene regulation mechanism only accounted for a small portion of the upregulated proteins discovered in our proteomics analysis. In fact, a closer examination of the KLF4 binding sites revealed that only 27% of the 73 KLF4-upregulated targets were bound by KLF4 to gene upstream or 5ʹUTR regions.
Chromosome conformation capture (3C) showed that KLF4-mCpG interactions promoted chromatin loop formation at the BLK locus
This observation prompted us to hypothesize that KLF4 might bind to methylated motifs at enhancers, located in either remote regions or in the gene bodies, to activate target gene expression by forming a 3-dimentional (3D) chromatin loop with promoter regions. To test this hypothesis, we overlapped our global analysis of KLF4-mCpG binding at enhancer regions () with our proteomics analysis (), and found 16 genes in both datasets, most of which were involved in cytoskeleton organization and cell motility (). We decided to focus on genes that were bound by KLF4 WT at multiple regions within the gene bodies, as 3D chromatin loops would be likely to form between these KLF4 binding sites. BLK was noted to be upregulated by KLF4 WT at both the protein () and mRNA levels. This was consistent with our previous RNA-seq studies in U87 cells [Citation11] that showed that BLK was upregulated by KLF4 WT at the mRNA level (). We further validated our global RNA-seq studies by quantitative real-time PCR (RT-PCR), which showed that BLK mRNA level was increased ~2.2-fold upon KLF4 WT expression, but not affected by KLF4 R458A expression (, P <0.05). Western blot analysis further confirmed that BLK protein level was significantly increased, ~3.9-fold by KLF4 WT but not KLF4 R458A (, P <0.001). The differential expression of BLK in KLF4 WT and KLF4 R458A cells suggested that BLK was activated by KLF4 binding to methylated CpGs in cis-regulatory elements.
Table 2. Proteins up-regulated by KLF4-mCpG binding at the enhancer regions of the gene in human glioblastoma cells.
Figure 3. BLK was activated by KLF4 WT, not by KLF4 R458A. A. RNA-sequencing data showing that the BLK gene was only upregulated by KLF4 WT, but not by KLF4 R458A. B. Real time-PCR verified that BLK mRNA level was increased by ~2.2-fold in KLF4 WT expressing cells (P <0.05). C. Western blot analysis showed that BLK was upregulated ~3.9-fold by KLF4 WT (P <0.001), but was not changed by KLF4 R458A. Independent experiments were repeated at least three times.
To identify KLF4 binding sites, we queried our KLF4 ChIP-seq data in KLF4 WT expressing U87 cells [Citation18]. We found two possible highly methylated CpG binding sites for KLF4 WT at the BLK locus, one at the 5ʹUTR site and the other at the 3ʹUTR site (). We speculated that the 3ʹUTR KLF4 binding site could serve as an enhancer to facilitate chromatin loop formation between the two KLF4 binding sites, thereby activating gene expression (). Chromosome conformation capture (3C) technique was carried out to test this hypothesis. Experiments were performed in U87 KLF4 WT cells +/- Dox. Genomic DNA from these cells were cross-linked and fragmented by enzymatic digestion. The digested DNA fragments were ligated and served as templates for PCR. Two primers were designed: one annealed to the end of the KLF4 binding site at the 5ʹUTR of the BLK gene, and the other to the beginning of KLF4 binding site at the 3ʹUTR of the BLK gene. The distance between the two primer sites is ~37 kb, according to the linear structure of the BLK gene. A fragment of 298 bp PCR product was predicted if our hypothesized 3D model of BLK activation in was correct. As we expected, a PCR product with the correct size was detected in U87 cells before Dox treatment, and dramatically increased after KLF4 WT induction (). qRT-PCR revealed a ~9.2-fold increase in the PCR product from U87 KLF4 WT expressing cells in comparison with those from non-Dox-treated cells (, P <0.001). Sanger sequencing showed that the sequence of the PCR fragment was a 100% match to our predicted sequence with the linker sequence as 5ʹ-AATAAGCTTGC to span both KLF4 binding sites at the 5ʹUTR and 3ʹUTR of the BLK gene (, e showing the linked sequence). All these data indicated that a 3D structure was formed by KLF4 binding to the enhancer region at the 3ʹUTR and the promoter region at the 5ʹUTR of the BLK locus, thereby activating BLK gene transcription.
Figure 4. Chromosome conformation capture (3C) showed that KLF4 facilitated 3D chromatin loop formation. A. Hypothesized 3D structure of the BLK gene locus activation showing KLF4 binds to the 5ʹUTR and 3ʹUTR fragments of the BLK gene through a chromatin loop to activate gene expression. Primers were designed to match the 5ʹUTR and 3ʹUTR KLF4 binding sites, respectively. A PCR fragment with the size of 298 bp was predicted based on our model, even though these two binding sites are ~37 kb apart. B. 3C was performed under four conditions: U87 KLF4 WT +/- Dox and U87 KLF4 R458R +/- Dox. Cross-linked genomic DNA was fragmented by digesting with HindIII followed by ligation of adjacent fragments. Same amount of template was used for PCR to amplify the putative linked site. PCR fragment with the predicted size of 298 bp was enriched in KLF4 expressing cells. C. Quantification of the enrichment of the PCR product in U87 KLF4 WT and KLF4 R458A cells indicated a 9.2-fold increase in KLF4 WT expressing cells. D, E. Sanger sequencing confirmed that the PCR fragment 100% matched our predicted linker sequencing as shown in D. F. 5-Aza treatment in U87 KLF4 WT expressing cells prevented loop formation, and no enrichment of PCR product was detected. G. Luciferase assay of the binding activity of KLF4 to the 3ʹUTR region of the BLK locus showing ~4-fold increase in luciferase activity upon Dox treatment. For panel B, C, F, and G, independent experiments were repeated at least three times. ***: P <0.001.
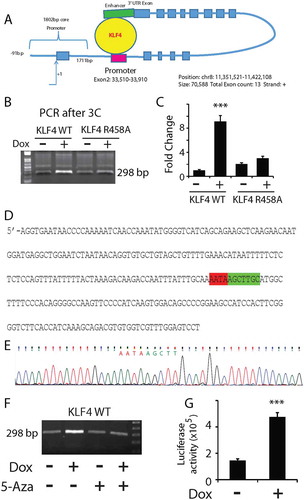
To verify the role of DNA methylation in loop formation, we also performed the 3C analysis in U87 KLF4 R458A cells +/- Dox and found that the mutant did not increase the PCR production of the ligated fragment from our predicted loop structure (), indicating that methylation-dependent KLF4 binding to the 3ʹUTR of the BLK gene was responsible for the enhancement of the loop formation. Furthermore, we treated the cells with the DNA methyltransferase inhibitor 5-aza-2′-deoxycytidine (5-Aza), which has been previously proven to significantly decrease genome wide methylation [Citation26] and reverse gene expression induced by KLF4-mCpG binding in U87 cells [Citation11]. KLF4 WT cells were treated with 5-Aza before adding Dox, followed by 3C procedure and PCR. We could no longer amplify the linker fragment from the predicted 3D chromatin loop in U87 KLF4 WT expressing cell under this condition (), supporting our hypothesis that methylation-dependent KLF4 binding to the 3ʹUTR enhancer region of BLK was involved in gene activation. Finally, to demonstrate the binding activity of KLF4 to the 3ʹUTR region of the BLK locus, we constructed a reporter and transiently transfected it into U87 KLF4 WT cells. Upon Dox treatment, we observed ~4-fold increase in luciferase activity, indicating binding of KLF4 to this site to activate gene expression ().
BLK was activated by KLF4 binding to methylated enhancer region
To determine if KLF4 indeed bound to the 3ʹUTR site of the BLK gene in vivo via a mCpG-dependent mechanism, we performed ChIP-PCR using an antibody against KLF4 to precipitate cross-linked genomic DNA from KLF4 WT and KLF4 R458A expressing cells. This antibody recognizes N-terminal of KLF4 and equally precipitate KLF4 WT and KLF4 R458A, because the mutated site in KLF4 R458A is at the C-terminal of KLF4 [Citation11]. We found the KLF4 binding site at the 3ʹUTR of the BLK gene was enriched in KLF4 WT expressing cells, but not in KLF4 R458A expressing cells, suggesting a mCpG-dependent binding activity at this site (). To confirm this binding region was methylated, bisulfite sequencing was performed in U87 cells. The KLF4 binding site at the 3ʹUTR of the BLK locus was highly methylated (65%-100%) at ~ 12 CpG sites as shown in . To corroborate that methylation at the 3ʹUTR of BLK was responsible for KLF4 binding and gene activation, we treated the cells with 5-Aza, which abolished the hypermethylation at these tested CpG sites (). ChIP-PCR indicated that 5-Aza completely blocked KLF4 WT binding to the 3ʹUTR of the BLK gene (). RT-PCR revealed that 5-Aza blocked BLK upregulation by KLF4 WT (). All these suggested that the upregulated BLK expression was as a result of KLF4 binding to the methylated CpG sites at the enhancer region located at the 3ʹUTR of the BLK gene.
Figure 5. KLF4 bound to the enhancer region of BLK in a methylation-dependent manner to activate gene expression. A. Genomic DNA from U87 KLF4 WT and KLF4 R458A cells were immunoprecipitated by a KLF4 antibody and served as templates for PCR. The 3ʹUTR binding site of the BLK gene was only enriched in KLF4 WT-expressing cells, and not in KLF4 R458A-expressing cells. Input genomic DNA served as positive control and isogenic IgG precipitated sample as negative control. B. Bisulfite sequencing analysis indicated highly methylated CpG sites of the putative KLF4 binding region at the 3ʹUTR of the BLK gene. C. 5-Aza abolished the methyl group of the tested CpG sites at the 3ʹUTR region of the BLK gene. D. ChIP-PCR of the same 3ʹUTR region in U87 KLF4 WT cells after 5-Aza treatment. 5-Aza abolished KLF4 WT binding to this fragment. E. RT-PCR indicated that 5-Aza blocked BLK upregulation in KLF4 WT expressing cells (*: P <0.05). For panels A, D, and E, experiments were repeated at least three times.
KLF4 bound to methylated enhancer regions to activate LMO7 expression
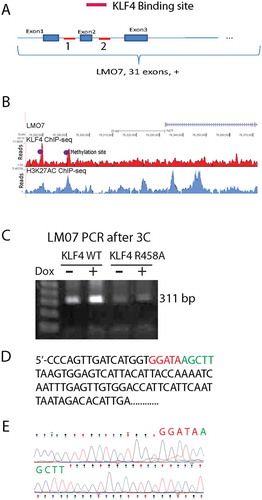
In addition to BLK, we performed 3C analysis to determine whether other gene targets were activated by KLF4-mCpG interactions at enhancer regions. Among three additional targets (LMO7, UGDH, and NGEF) that we surveyed, LMO7 was also upregulated by KLF4 binding to methylated mCpGs at an enhancer via 3D chromatin loop formation. Both KLF4 binding sites at the LMO7 gene are at the 5ʹUTR region but they are 10 kb apart from each other (). Integration of KLF4 ChIP-seq, H3K27ac ChIP-seq, and the whole-genome bisulfite sequencing datasets indicates that both KLF4 binding sites are highly methylated and enriched in H3K27ac mark (). We designed primers to span the two KLF4 binding sites and performed 3C analysis. A predicted PCR product that linked the two KLF4 binding sites was enriched in KLF4 WT expressing cells, indicating a 3D chromatin loop was formed between the two KLF4 binding sites of the LMO7 gene (). In contrast, KLF4 R458A expression did not show enrichment of the predicted PCR product when compared with untreated cells (). Sanger sequencing showed that the sequence of the PCR fragment was a 100% match to our predicted sequence with the linker as 5ʹ-GGATAAGCTT to span the two KLF4 binding sites (, showing the linked sequence).
Figure 6. KLF4 bound to mCpGs at enhancer regions to activate LMO7 expression A. Schematic structure of the LMO7 gene locus showing KLF4 binding sites at the 5ʹUTR flanking exon 2 with ~10 kb apart. B. H3K27ac ChIP-seq analysis indicated the enrichment of the enhancer mark at the two KLF4 binding sites of the LMO7 gene, which are also highly methylated according to our whole-genome bisulfite sequencing data analysis (dotted). C. Primers were designed to span the two KLF4 binding sites of the LMO7 gene and to amplify the predicted linker site of the 3D loop. A predicated PCR fragments with the size of 311 bp was enriched in KLF4 WT expressing cells, but not in KLF4 R458A expressing cells. D, E. Sanger sequencing confirmed that the PCR fragment completely matched our putative loop with the linker sequencing as shown in D.
BLK knockdown decreased cell migration
To determine the biological function of BLK in GBM biology and the implication of this novel gene regulation mechanism, we studied the loss-of-function of BLK in U87 cells using shRNAs to knockdown BLK expression. Two distinct shRNA constructs reduced BLK expression by more than 80% in U87 GBM cells (). Cell proliferation and cell migration were analyzed in these cells. We found that BLK knockdown did not change cell proliferation or colony formation ability (). In contrast, BLK knockdown significantly increased cell adhesion (, P <0.01), and reduced cell migration in transwell assays and wound healing assays (). Thus, our work revealed a methylated enhancer-dependent gene regulation mechanism of BLK, which is involved in brain tumor adhesion and migration.
Figure 7. Biological function of BLK in GBM cells. A. GBM cells were transduced with virus containing non-silencing shRNA (Control) or BLK shRNAs. BLK was knocked down by ~80% in U87 cells with two distinct constructs of BLK shRNA (sh#1 and sh#2). B, C. BLK knockdown did not change U87 cell proliferation (B) and colony formation ability in soft agar (C). D. BLK knockdown significantly increased cell adhesion. E, F. BLK downregulation decreased cell migration in transwell assays (E) and scratch wound healing assays (F). G. BLK was knocked down in U87 KLF4 WT cells. Cells were transduced with control shRNA or BLK shRNA #1. H. Cell migration assay in U87 KLF4 WT cells with or without BLK knock down. KLF4 expression was induced by Dox. ***: P <0.001; **: P <0.01; *:P <0.05.
Finally, we investigated the involvement of BLK in cellular phenotype changes induced by KLF4. In U87 cells expressing tet-on KLF4 WT, we knocked down BLK expression with shRNA to generate stable cells lines. KLF4 expression increased BLK protein expression in the control shRNA transduced U87 cells, as we have shown before, but failed to do so in the BLK knockdown cell models (). We examined the effects of BLK knockdown on KLF4-mediated GBM cell migration. KLF4 WT increased cell migration in transwell assays, whereas BLK knockdown blocked these changes (). These results support that BLK is required for cell migration mediated via KLF4 binding.
Discussion
In the current work, we studied the biological function of KLF4-mCpG binding at enhancer regions in human glioblastoma (GBM) cells. By employing chromosome conformation capture (3C) and using a KLF4 site-specific mutant that lacks KLF4 binding to mCpGs, we found that mCpG-dependent KLF4 binding at enhancer regions facilitates the formation of 3D structure of chromatin loop with promoters, thereby activating gene expression and influencing cellular functions. Our work, with an emphasis on 3D structure formation during individual gene activation, including BLK and LM07, support our genome-wide studies showing that mCpG at enhancer regions positively correlates with gene expression, which has only been sparsely reported until now [Citation27]. Furthermore, our functional study revealed that BLK is involved in tumor cell migration. Thus, together with other work indicating a role of DNA methylation in gene activation [Citation6,Citation8–Citation11,Citation28–Citation32], our study further supports the notion that DNA methylation at enhancer regions plays an active role in gene transcription to promote cancer cell migration.
Our current study is a logical extension of our previous study utilizing the unique KLF4 site-specific mutagenesis to dissect the biological function of mCpG-dependent KLF4 function in GBM cells. There are several technique issues that warrant discussion. First, using our Dox-inducible system, the expression level of KLF4 protein is within the physiological range of KLF4 in cancer cells. For example, we have reported that KLF4 is upregulated by ~25-fold during growth factor-induced GBM cell reprogramming [Citation33]. Second, in our previous study, our whole-genome bisulfite sequencing in U87 cells has unambiguously proven that KLF4 R458A is indeed defective in binding to mCpG motifs in vivo [Citation11], corroborating our early studies showing that KLF4 R458R only binds to non-mCpG motifs in vitro [Citation10]. Thus, the differences we observed in our 3C analysis between KLF4 WT and KLF4 R458A are attributed to KLF4-mCpG interactions. Third, we are confident that the differential binding of KLF4 WT and KLF4 R458A in our ChIP-PCR studies represents mCpG-mediated KLF4 binding activity. The mutated site in KLF4 R458A is at the C-terminal of KLF4; therefore, it does not interfere with precipitation by the KLF4 antibody, which recognizes the N-terminal of KLF4. In our previous ChIP-PCR studies, using a positive control, we have shown that this antibody was able to equally precipitate both KLF4 WT and KLF4 R458A [Citation10,Citation11]. To avoid redundancy, we did not include those results in the present work. Finally, in our 3C analysis of BLK gene activation, we detected the 3D chromatin loop formation in non-Dox treated U87 cells. Several scenarios can explain the observation: (a) random or stochastic chromatin interactions may promote baseline loop formation; (b) endogenous low level of KLF4 protein expression may mediate the baseline chromatin loop formation; (c) chromatin loop is formed in a small population of cells, mediated either by stochastic chromatin interactions or by endogenous KLF4 expression. Nevertheless, forced KLF4 WT expression facilitated the chromatin loop formation between the enhancer region and the promoter region, indicating that TF binding is critical for the 3D chromatin structure and gene activation. Our KLF4 R458A mutant failed to promote 3D chromatin loop formation, supporting a methylation-dependent mechanism in this process. Furthermore, when DNA methylation at the enhancer region (3ʹUTR) was abolished by 5-Aza, we were no longer able to detect the chromatin loop and increased BLK expression. All these results support our conclusion that DNA methylation at enhancer regions mediates KLF4 binding, chromatin loop formation, and gene activation. However, it is worthy to mention that even though we demonstrated the loop formation after KLF4 WT expression, we did rule out the possibility that KLF4 acts as an activator of BLK directly or indirectly by activating other enhancer-binding factors.
The mechanism adopted by brain tumor migration/invasion is an intricate program that recalls what takes place in carcinoma cells during metastasis initiation. Yet, no cancer driver genes have been implicated in tumor metastasis [Citation1], suggesting that other mechanisms, including epigenetic regulation, play a role in tumor metastasis. DNA methylation-mediated gene silencing has been shown to regulate tumor cell migration and invasion [Citation34–Citation36]. In our previous study, we dissected mCpG-dependent activation of cell motility genes, including RHOC, RAC1, and UGDH, in GBM cells [Citation11]. RHOC and RAC1 were activated by KLF4 binding to mCpG at promoter regions [Citation11]. In the current studies, we found that other validated KLF4-mCpG targets, BLK and LMO7, could also be activated by KLF4 via binding of mCpG at enhancer regions. Both BLK and LMO7 have been implicated in cell migration [Citation14,Citation37]. Our findings that KLF4 promotes GBM cell migration via mCpG-dependent mechanism at both promoter and enhancer regions add another layer of complexity in brain tumor cell migration and invasion.
In our system, we identified ten CpG-containing 6-mers as KLF4 binding motifs, including 5ʹ-CCmCGCC. It is important to notice that Liu et al. [Citation38] reported another sequence motif and binding constants. In general, KLF4 interacts with GC-rich elements with a core of C(A/G)CCC on target genes. Others suggested that KLF4 prefers to bind a RRGGYGY sequence (where R = A/G and Y = C/T) [Citation39]. It is conceivable that in different model systems KLF4 may have different preference of binding sequences. In our current study, we placed a higher priority on KLF4-mCpG-mediated gene transactivating effect. Yet, KLF4 is a bi-functional transcription factor with both transactive and repressive functions [Citation40]. Recent findings from Serra et al. [Citation30] indicate that mCpG-TF interactions mediate gene silencing. In our proteomics analysis, we also found 1/3 of the differentially expressed protein were downregulated by KLF4-mCpG binding. Future detailed analysis of how KLF4-mCpG interactions affect these gene targets and their biological function in GBM cells will shed light on how epigenetic changes contribute to tumor progression.
In summary, our studies promise to significantly advance our understanding of epigenetic mechanisms in tumor biology, which will greatly expand the epigenetic landscape in a novel direction. Determining DNA methylation-mediated gene transactivation mechanism at promoter and enhancer regions and their impact on GBM migration/invasion would create an entirely new dimension for interpreting current genome-wide methylation data in cancer. Our work will provide a roadmap to characterize other mCpG-binding TFs identified in our previous work [Citation10], and to study this unconventional gene regulatory mechanism in other cancer subtypes.
Acknowledgments
The bioinformatics analyses were performed by Johns Hopkins University School of Medicine and the Collaborative Core for Cancer Bioinformatics (C3B) shared by Indiana University Simon Cancer Center and Purdue University Center for Cancer Research supported by Walther Cancer Foundation. This work was supported by grants from NIH R01NS091165 (S.X.), NIH EY024580 (J.Q.), NIH EY023188 (J.Q.), NIH GM111514 (H.Z. and J.Q.), NIH R33CA186790 (H.Z.), NIH U54 HG006434 (H.Z.), NIH U24 CA160036 (H.Z.), Ford Foundation pre-doctoral fellowship program (O.O) and NIH T32 GM007445 (O.O).
Disclosure statement
No potential conflict of interest was reported by the authors.
Additional information
Funding
References
- Vogelstein B, Papadopoulos N, Velculescu VE, et al. Cancer genome landscapes. Science. 2013;339:1546–1558.
- Quick A, Patel D, Hadziahmetovic M, et al. Current therapeutic paradigms in glioblastoma. Rev Recent Clin Trials. 2010;5:14–27.
- Bird A. DNA methylation patterns and epigenetic memory. Genes Dev. 2002;16:6–21.
- Jones PA. Functions of DNA methylation: islands, start sites, gene bodies and beyond. Nat Rev Genet. 2012;13:484–492.
- Nan X, Cross S, Bird A. Gene silencing by methyl-CpG-binding proteins. Novartis Found Symp. 1998;214:6–16. discussion 16–21, 46–50.
- Filion GJ, Zhenilo S, Salozhin S, et al. A family of human zinc finger proteins that bind methylated DNA and repress transcription. Mol Cell Biol. 2006;26:169–181.
- Mann IK, Chatterjee R, Zhao J, et al. CG methylated microarrays identify a novel methylated sequence bound by the CEBPB|ATF4 heterodimer that is active in vivo. Genome Res. 2013;23:988–997.
- Spruijt CG, Gnerlich F, Smits AH, et al. Dynamic readers for 5-(hydroxy)methylcytosine and its oxidized derivatives. Cell. 2013;152:1146–1159.
- Yin Y, Morgunova E, Jolma A, et al. Impact of cytosine methylation on DNA binding specificities of human transcription factors. Science. 2017;356.
- Hu S, Wan J, Su Y, et al. DNA methylation presents distinct binding sites for human transcription factors. Elife. 2013;2:e00726.
- Wan J, Su Y, Song Q, et al. Methylated cis-regulatory elements mediate KLF4-dependent gene transactivation and cell migration. Elife. 2017;6.
- Dymecki SM, Niederhuber JE. Desiderio SV Specific expression of a tyrosine kinase gene, blk, in B lymphoid cells. Science. 1990;247:332–336.
- Wu YY, Georg I, Diaz-Barreiro A, et al. Concordance of increased B1 cell subset and lupus phenotypes in mice and humans is dependent on BLK expression levels. J Immunol. 2015;194:5692–5702.
- Bartolome RA, Diaz-Martinez M, Colo GP, et al. A Blk-p190RhoGAP signaling module downstream of activated Galpha13 functionally opposes CXCL12-stimulated RhoA activation and cell invasion. Cell Signal. 2014;26:2551–2561.
- Goodwin CR, Lal B, Ho S, et al. PTEN reconstitution alters glioma responses to c-Met pathway inhibition. Anticancer Drugs. 2011;22:905–912.
- Li Y, Fan X, Goodwin CR, et al. Hepatocyte growth factor enhances death receptor-induced apoptosis by up-regulating DR5. BMC Cancer. 2008;8:325.
- Herbrich SM, Cole RN, West KP Jr., et al. Statistical inference from multiple iTRAQ experiments without using common reference standards. J Proteome Res. 2013;12:594–604.
- Kammers K, Cole RN, Tiengwe C, et al. Detecting Significant Changes in Protein Abundance. EuPA Open Proteom. 2015;7:11–19.
- Smyth GK. Linear models and empirical bayes methods for assessing differential expression in microarray experiments. Stat Appl Genet Mol Biol. 2004;3:Article3.
- Ying M, Sang Y, Li Y, et al. Kruppel-like family of transcription factor 9, a differentiation-associated transcription factor, suppresses Notch1 signaling and inhibits glioblastoma-initiating stem cells. Stem Cells. 2011;29:20–31.
- Woodard CL, Goodwin CR, Wan J, et al. Profiling the dynamics of a human phosphorylome reveals new components in HGF/c-Met signaling. PLoS One. 2013;8:e72671.
- Wu Y, Richard JP, Wang SD, et al. Regulation of glioblastoma multiforme stem-like cells by inhibitor of DNA binding proteins and oligodendroglial lineage-associated transcription factors. Cancer Sci. 2012;103:1028–1037.
- Sun P, Xia S, Lal B, et al. Lipid metabolism enzyme ACSVL3 supports glioblastoma stem cell maintenance and tumorigenicity. BMC Cancer. 2014;14:401.
- Splinter E, De Wit E, Van De Werken HJ, et al. Determining long-range chromatin interactions for selected genomic sites using 4C-seq technology: from fixation to computation. Methods. 2012;58:221–230.
- Xia S, Lal B, Tung B, et al. Tumor microenvironment tenascin-C promotes glioblastoma invasion and negatively regulates tumor proliferation. Neuro Oncol. 2016; 18:507-517
- Christman JK. 5-Azacytidine and 5-aza-2ʹ-deoxycytidine as inhibitors of DNA methylation: mechanistic studies and their implications for cancer therapy. Oncogene. 2002;21:5483–5495.
- Charlet J, Duymich CE, Lay FD, et al. Bivalent Regions of Cytosine Methylation and H3K27 Acetylation Suggest an Active Role for DNA Methylation at Enhancers. Mol Cell. 2016;62:422–431.
- Rishi V, Bhattacharya P, Chatterjee R, et al. CpG methylation of half-CRE sequences creates C/EBPalpha binding sites that activate some tissue-specific genes. Proc Natl Acad Sci U S A. 2010;107:20311–20316.
- Sasai N, Nakao M. Defossez PA Sequence-specific recognition of methylated DNA by human zinc-finger proteins. Nucleic Acids Res. 2010;38:5015–5022.
- Serra RW, Fang MG, Park SM, et al. A KRAS-directed transcriptional silencing pathway that mediates the CpG island methylator phenotype. Elife. 2014;3.
- Spruijt CG. Vermeulen M DNA methylation: old dog. New Tricks? Nat Struct Mol Biol. 2014;21:949–954.
- Gao T, He B, Liu S, et al. EnhancerAtlas: a resource for enhancer annotation and analysis in 105 human cell/tissue types. Bioinformatics. 2016;32:3543–3551.
- Li YQ, Li A, Glas M, et al. c-Met signaling induces a reprogramming network and supports the glioblastoma stem-like phenotype. Proc Natl Acad Sci USA. 2011;108:9951–9956.
- Esteller M. Epigenetic gene silencing in cancer: the DNA hypermethylome. Hum Mol Genet. 2007;16(Spec No 1):R50–59.
- Martinez R. Esteller M The DNA methylome of glioblastoma multiforme. Neurobiol Dis. 2010;39:40–46.
- Waha A, Guntner S, Huang TH, et al. Epigenetic silencing of the protocadherin family member PCDH-gamma-A11 in astrocytomas. Neoplasia. 2005;7:193–199.
- Hu Q, Guo C, Li Y, et al. LMO7 mediates cell-specific activation of the Rho-myocardin-related transcription factor-serum response factor pathway and plays an important role in breast cancer cell migration. Mol Cell Biol. 2011;31:3223–3240.
- Liu Y, Olanrewaju YO, Zheng Y, et al. Structural basis for Klf4 recognition of methylated DNA. Nucleic Acids Res. 2014;42:4859–4867.
- Shields JM. Yang VW Identification of the DNA sequence that interacts with the gut-enriched Kruppel-like factor. Nucleic Acids Res. 1998;26:796–802.
- Evans PM. and Liu C Roles of Krupel-like factor 4 in normal homeostasis, cancer and stem cells. Acta Biochim Biophys Sin (Shanghai). 2008;40:554–564.