
ABSTRACT
DNA methylation at cytosine-phosphate-guanine (CpG) dinucleotides changes as a function of age in humans and animal models, a process that may contribute to chronic disease development. Recent studies have investigated the role of an oxidized form of DNA methylation – 5-hydroxymethylcytosine (5hmC) – in the epigenome, but its contribution to age-related DNA methylation remains unclear. We tested the hypothesis that 5hmC changes with age, but in a direction opposite to 5-methylcytosine (5mC), potentially playing a distinct role in aging. To characterize epigenetic aging, genome-wide 5mC and 5hmC were measured in longitudinal blood samples (2, 4, and 10 months of age) from isogenic mice using two sequencing methods – enhanced reduced representation bisulfite sequencing and hydroxymethylated DNA immunoprecipitation sequencing. Examining the epigenome by age, we identified 28,196 unique differentially methylated CpGs (DMCs) and 8,613 differentially hydroxymethylated regions (DHMRs). Mouse blood showed a general pattern of epigenome-wide hypermethylation and hypo-hydroxymethylation with age. Comparing age-related DMCs and DHMRs, 1,854 annotated genes showed both differential 5mC and 5hmC, including one gene – Nfic – at five CpGs in the same 250 bp chromosomal region. At this region, 5mC and 5hmC levels both decreased with age. Reflecting these age-related epigenetic changes, Nfic RNA expression in blood decreased with age, suggesting that age-related regulation of this gene may be driven by 5hmC, not canonical DNA methylation. Combined, our genome-wide results show age-related differential 5mC and 5hmC, as well as some evidence that changes in 5hmC may drive age-related DNA methylation and gene expression.
Introduction
Epigenetics refers to the study of heritable and potentially reversible changes in gene expression unrelated to the DNA sequence. DNA methylation, or 5-methylcytosine (5mC), is a well-characterized epigenetic mark that is typically defined as the addition of a methyl group to the 5ʹ-carbon of cytosine in a cytosine-phosphate-guanine (CpG) dinucleotide. Previous work has shown that increased promoter DNA methylation is associated with decreased transcription factor binding, decreased gene transcription, and silencing of transposable elements throughout the genome [Citation1,Citation2]. During development, the methylome undergoes discrete waves of demethylation and de novo methylation [Citation3,Citation4], processes that help regulate both somatic cell differentiation and primordial germ cell proliferation [Citation5].
Despite their establishment during development and maintenance through cellular replication, DNA methylation levels demonstrate clear changes with age. Predictable, unidirectional changes in DNA methylation that occur with age are referred to as ‘age-related methylation.’ [Citation6,Citation7] Separate from these predictable changes, there are also stochastic, bidirectional alterations in epigenetic variability that occur with age; these are referred to as ‘epigenetic drift.’ [Citation7,Citation8] Combined, these two processes represent ‘epigenetic aging,’ a phenotype of age-associated changes in the epigenome. These age-related changes in DNA methylation have important implications for transcriptional control and protein expression, and may underlie later-life disease development.
Separate from 5mC, recent studies have begun to investigate the role of an oxidized form of DNA methylation – 5-hydroxymethylcyotisine (5hmC) – in the epigenome. Hydroxylation of 5mC to 5hmC occurs via the Ten-eleven translocation (TET) dioxygenase enzymes, and 5hmC is an intermediate on the active demethylation pathway [Citation9]. Beyond its role in demethylation, however, recent evidence suggests that 5hmC is a secondary epigenetic mark that has a complex role as a regulator of transcription [Citation10,Citation11]. Previous studies have shown that 5hmC is specifically recognized by DNA-binding proteins [Citation12,Citation13], and that 5hmC enrichment varies by tissue and genic region in mouse and human tissues [Citation14–Citation17]. Despite the increased interest in 5hmC as an epigenetic mark, traditional bisulfite treatment sequencing methods do not distinguish between 5mC and 5hmC, so it remains unclear whether 5hmC contributes to epigenetic aging. Here, we tested the hypothesis that 5hmC would change with age, but in a direction opposite to 5mC, thereby playing a distinct role in the aging epigenome.
Results
Epigenome-wide differential 5mC+5hmC (ERRBS)
Enhanced reduced representation bisulfite sequencing (ERRBS) is a bisulfite treatment-based sequencing method that measures epigenome-wide 5mC and 5hmC at the same time. Despite this, to remain consistent with previous studies, we refer to all ERRBS data using the catch-all terms ‘methylation’ or ‘5mC.’ Using the DSS R package, multifactorial models were used to test for differential methylation by age in matched ERRBS data from murine blood samples collected at three time points – 2 months old (n = 6), 4 months old (n = 6), and 10 months old (n = 6). Longitudinal blood samples were collected for a/a wild type mice sourced from a genetically invariant Avy/a mouse colony (). In total, we identified 28,196 differentially methylated CpGs (DMCs) by age (). Comparing the directionality of DMCs by age, we found more DMCs that increased in methylation with age (hypermethylated; 17,460, 61.9%) than DMCs that decreased with age (hypomethylated; 10,736, 38.1%) by age (). Comparing to a random distribution generated from the ERRBS libraries, hypo- and hyper-methylated age-related DMCs showed variable patterns of enrichment and depletion depending on the genomic annotation (Figure S1A). Of note, compared to a random distribution, age-related DMCs (All, Hyper-, and Hypo-methylated) were enriched at promoters, CpG islands, CpG shores, CpG shelves, promoters, 5ʹUTRs, and exons, but were depleted at regions greater than 4,000 bp from a CpG island (interCGI) regions.
Table 1. Differential 5mC and 5hmC in mouse blood by age.
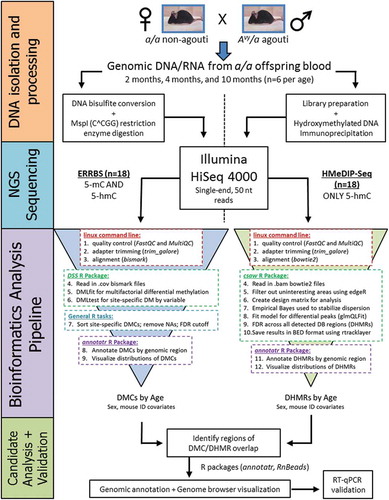
Figure 1. Sequencing data collection and analysis workflow. Genomic DNA was isolated from matched offspring blood samples at 2 months (n = 6), 4 months (n = 6), and 10 months of age (n = 6). DNA samples were then split for separate processing steps specific to the ERRBS and HMeDIP-seq methods. All processed samples were amplified and sequenced on an Illumina HiSeq 4000 sequencer using single-end, 50 nt read length. Separate bioinformatics pipelines were used to analyze ERRBS and HMeDIP-seq data. Differentially methylated CpGs (DMCs) were compared to differentially hydroxymethylated regions (DHMRs) for regions of chromosomal overlap. Regions of overlap were then annotated and visualized in the genome browser. The Nfic gene was validated using RT-qPCR on available RNA from the blood samples.
Epigenome-wide differential 5hmC (HMeDIP-seq)
Unlike ERRBS, hydroxymethylated DNA immunoprecipitation sequencing (HMeDIP-seq) is an immunoprecipitation-based method that measures only 5hmC; therefore, we refer to HMeDIP-seq data as ‘hydroxymethylation’ or ‘5hmC.’ For the HMeDIP-seq data, we identified 8,613 DHMRs by age using multivariate models constructed in the csaw R package (). Comparing the directionality of DHMRs by age, almost all DHMRs were hypo-hydroxymethylated in older mice (8,446; 98.1%) compared to hyper-hydroxymethylated (160; 1.9%). Due to the 100 bp minimum window for DHMR-calling, we also identified a small fraction of age-related DHMRs that included regions of both hypo- and hyper-hydroxymethylation (7; 0.001%). Compared to a random distribution, age-related DHMRs showed moderate enrichment in CpG shores, CpG shelves, promoters, 3ʹUTRs, 5ʹUTRs, exons, and introns, as well as mild depletion at interCGI regions and CpG islands (Figure S1B). On a broad scale, our data showed decreased epigenome-wide 5hmC with age.
Comparison of epigenome-wide differential 5mC and 5hmC
Due to inherent bias in the ERRBS method, the measured 5mC levels have incomplete coverage across the genome. On average, ERRBS covered 3,412,801 CpG sites, while HMeDIP-seq covered 28,161,296 CpG sites (Table S1). This difference in coverage makes direct comparison of the available genome-wide 5mC and 5hmC data imperfect. Despite this limitation, we used the bedtools intersect function to directly compare annotated DMCs and DHMRs by chromosomal location across the epigenome. For age-related DMCs and DHMRs, we found 65 CpGs that intersected by chromosomal location (Table S2); these overlapping CpGs were annotated to 40 unique gene IDs (). Of these 40 genes, three had multiple DMCs that overlapped a DHMR – Fbln1, Ldlrad3I, and Nfic. At the Nfic locus, we identified five age-related DMCs overlapping a single DHMR. These five sites are located in a CpG shelf 2,588–2,639 bp upstream of the Nfic gene ().
Figure 2. Venn diagrams of intersecting age-related DMCs and DHMRs by chromosomal location. The bedtools intercept function was used to test for overlap between DMCs and DHMRs by exact chromosomal location. Comparing age-related DMCs and DHMRs, we identified 65 regions that overlapped by chromosomal position. The age-related DMC and DHMR overlap sites annotated to 40 unique gene IDs. Of these 40 genes, three had multiple DMCs that overlapped a DHMR – Fbln1, Ldlrad3I, and Nfic.
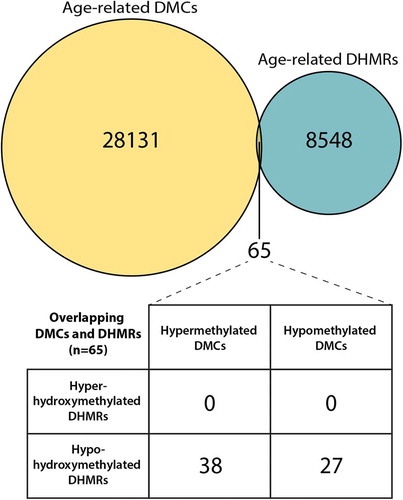
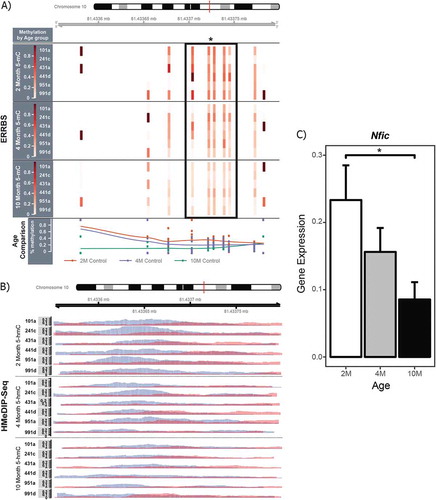
Figure 3. ERRBS, HMeDIP-seq, and RT-qPCR data for the Nfic gene DMC and DHMR overlap region. ERRBS and HMeDIP-seq data at the Nfic DMC/DHMR overlap region (chr10: 81433551–81433,800) were visualized using the Gviz, csaw, and RnBeads R packages. Of the 8,446 hypo-hydroxymethylated DHMRs, the Nfic DHMR was the 172nd most significant region (FDR = 0.0002). Y-axes show mouse ID across the three blood sample ages; sample ages are separated by horizontal lines. (a) The EERBS data show significant age-related decreases in 5mC at five CpG sites annotated to the Nfic gene, as indicated by the black box with an asterisk. Percentage DNA methylation is represented by a heatmap, with low % methylation represented by light red, and high % methylation represented by dark red; white indicates a lack of data coverage for ERRBS. A line plot comparison of 5mC across the region for all three age groups (2 months = orange, 4 months = purple, 10 months = green) is included at the bottom of the output. (b) The HMeDIP-seq data at this gene region also show a significant decrease in 5hmC peaks with age in longitudinal mouse blood samples. Blue and red peaks represent forward and reverse strand 5hmC enrichment, respectively. (c) RT-qPCR was used to measure Nfic expression levels using the 2−ΔΔCt method. There was a significant decrease in mean Nfic expression between 2 and 10 month blood samples (P = 0.04).
Building on our previous research in mouse tail and blood samples from this colony [Citation18,Citation19], we checked for age-related DHMRs and DMCs annotated to the Esr1 gene. While we did not find any age-related DHMRs annotated to the Esr1 gene, it did have seven annotated age-related DMCs (). Examining only the age-related Esr1 DMCs, four of the sites had increased methylation with age, including one CpG annotated to the promoter region. The other three age-related Esr1 DMCs – one exonic, one 1–5 kb upstream of the gene, and one intronic – showed decreased methylation with age. Given the large number of DMCs annotated to Esr1, we interrogated the HMeDIP-seq data at the Esr1 gene, pulling out a large region that contained all annotated DMCs. On this broad scale, we did not see any obvious differences in 5hmC by age, but we did find stable 5hmC peaks across the Esr1 gene body (Figure S2). This suggests that 5hmC levels at the Esr1 locus are stable during adulthood in mouse blood.
Table 2. Age-related DMCs annotated to the Esr1 locus.
RT-qPCR expression data
To further investigate the epigenetic results for the Nfic and Esr1 genes, we performed RT-qPCR using RNA from the same matched mouse blood samples (primers available in Table S3). We found a significant decrease in Nfic expression between 2, 4, and 10 months of age in blood samples (P = 0.04) (), but no significant change in Esr1 expression with age (Figure S3). The significant decrease in Nfic expression with age echoes the observed age-related decrease in 5hmC upstream of the Nfic gene. Conversely, the lack of an observed difference in Esr1 expression with age is consistent with the stable 5hmC levels at Esr1 across adulthood.
Pathway analysis
Biological aging gives rise to a number of physiological changes that modify risk for development of disease, including cancer, type II diabetes, and neurological conditions [Citation20]. Furthermore, by altering regulation of physiological processes, epigenetic aging may contribute to age-related chronic disease. To investigate whether the detected age-related DMCs and/or DHMRs were enriched for specific biological pathways, we tested for overrepresented pathways among the age-related DMCs and DHMRs using ChIP-enrich. DMC and DHMR datasets were both restricted to sites and regions <5 kb from the transcription start site. Additionally, given that sites or regions of hypo- or hyper-methylation/hydroxymethylation could have very different regulatory effects with age, we ran separate pathway analyses on hypo- and hyper-methylated/hydroxymethylated sites or regions. A number of molecular function and biological process GO terms were enriched in hypo- and hyper-methylated age-related DMCs and DHMRs (Table S4). Of note, enriched pathways had very little overlap between hypo- and hyper-methylated sites or regions, showing specific enrichment based on directionality of differential methylation or hydroxymethylation. For example, among many other pathways, hypomethylated DMCs were significantly overrepresented near the start sites of genes involved in synaptic organization (FDR = 0.02), glycerolipid metabolic process (FDR = 0.02), and histone deacetylation (FDR = 0.04). Meanwhile, hypermethylated DMCs were significantly overrepresented near the start sites of genes involved in phospholipase C activity (FDR = 0.002) and UDP-glycosyltransferase activity (FDR = 0.005). DHMRs that decreased with age were significantly overrepresented near the start sites of T cell activation genes (FDR = 0.003), while DHMRs that increased with age were overrepresented near the start sites of B cell activation genes (FDR = 0.005). Hypermethylated DHMRs were significantly overrepresented near the start sites of genes involved in regulation of leukocyte apoptotic process (FDR = 2.66E-06), while hypomethylated DHMRs were significantly overrepresented near genes involved in G-protein coupled receptor activity (FDR = 0.0002). Additionally, while we found no overlap between enriched pathways for hyper- and hypo-methylated DHMRs, both hyper- and hypo-methylated DMCs showed enrichment for development of primary sexual characteristics.
Discussion
The results from this study indicate that both 5mC and 5hmC are dynamic with age in mouse blood. We identified statistically significant age-related DNA methylation and hydroxymethylation on an epigenome-wide scale, indicating that both epigenetic marks are altered during murine aging. To our knowledge, this is the first study to examine age-related 5hmC levels in a longitudinal mouse model. Given the lack of available research on this topic, the biological effects of age-related changes in DNA hydroxymethylation remain poorly characterized. However, previous work has shown that DNA hydroxymethylation is a stable epigenetic mark that is associated with gene expression [Citation20], suggesting that it may play a role in defining the aging epigenome. Supporting this idea, we found moderate enrichment of age-related DHMRs at CpG shores, CpG shelves, promoters, 5ʹUTRs, exons, introns, and 3ʹUTRs compared to a random distribution (Figure S1B). While this enrichment of DHMRs at specific genomic locations was subtle, DHMRs also showed a clear bias toward hypo-hydroxymethylation with age (), a pattern supported by human studies showing decreased 5hmC levels in blood with age [Citation21,Citation22]. Combined, these data suggest that age-related changes in 5hmC are non-random, and that DNA hydroxymethylation could play a role in the aging process. Specifically, the age-related decrease in epigenome-wide 5hmC indicates that the overall decrease in DNA methylation observed with age [Citation23] is due to passive loss of methylation, not active demethylation. Future studies should examine whether longitudinal 5hmC levels can be used to accurately predict biological age, as has been shown in DNA methylation [Citation24].
Contrary to our original hypothesis, there was little overlap between sites or regions of age-related methylation and regions of age-related hydroxymethylation. It is possible that this lack of overlap reflects differences in the effects of aging on 5hmC and 5mC, with age-related changes in these separate epigenetic marks occurring at disparate genomic regions. This idea is supported by recent evidence showing that 5hmC is a stable epigenetic mark with its own distinct genomic distribution [Citation11,Citation20,Citation25]. However, the apparent lack of overlap could also be driven by the limited genomic coverage of the ERRBS method (Table S1); a more complete comparison of 5mC and 5hmC could be achieved using whole-genome bisulfite sequencing. Using the available data, only 65 age-related DMCs overlapped the annotated DHMRs by chromosomal location; this low level of overlap indicates that the majority of the observed DMCs were not driven by age-related changes in 5hmC. While overlap was minimal, we did identify one gene – Nfic – with five age-related DMCs overlapping a single DHMR (). Nfic encodes the nuclear factor I-C (NFI-C) protein, a member of the nuclear factor I (NFI) transcription factors, which are involved in stem cell differentiation and maintenance during development and adulthood, respectively [Citation26]. While NFI proteins are expressed in most adult tissues [Citation27,Citation28], the limited available research on NFI-C shows that it plays an important role in hepatocyte proliferation during liver regeneration [Citation29] and odontoblast and osteoblast differentiation [Citation30,Citation31]. As a result, age-related changes in Nfic regulation could have important consequences on tissue maintenance with age. This idea is supported by the fact that Nfic−/- mice exhibit an age-related osteoporosis-like phenotype [Citation30]. In our longitudinal data, we found simultaneous age-related decreases in combined 5mC+5hmC levels (ERRBS) and 5hmC peaks (HMeDIP-seq) upstream of the Nfic gene. This overlap suggests that age-related decreases in DNA methylation (as measured by bisulfite sequencing) at this region may be at least partially explained by decreases in 5hmC levels. Given that 5hmC has shown localization to enhancers and positive associations with gene expression [Citation16,Citation32–Citation34], we predicted that Nfic expression would decrease with age in concordance with 5hmC levels. Matching our expectation, Nfic expression decreased with age in blood (), supporting the idea that 5hmC, not 5mC, may be driving age-related changes in the methylome upstream of the Nfic gene. This result, while only from a single gene, highlights the importance of considering 5hmC when examining age-related methylation patterns. Without measuring 5hmC, the documented age-related decreases in 5mC and Nfic expression would have been difficult to reconcile with the classic view that DNA methylation is a repressive epigenetic mark. As a result, it is important for future studies investigating epigenetic aging to consider the contribution of DNA hydroxymethylation.
In previous studies, we found age-related DNA methylation changes at the Esr1 gene promoter (chr10:4712147–4712203) in matched mouse tail and blood tissues [Citation18,Citation19]. To follow up on these results, we interrogated our sequencing data for age-related DMCs annotated to the Esr1 locus. In total, we found seven age-related DMCs annotated to Esr1; four of these sites had increased methylation with age, including one CpG in the promoter region (). This result matches our prior results, which showed increased promoter Esr1 methylation with age in murine tail and blood [Citation18,Citation19]. In the HMeDIP-seq data, we did not find any significant differences in Esr1 5hmC by age; rather, there were a number of 5hmC peaks in the Esr1 genic region that were stable across individuals and time (Figure S2). This suggests that 5hmC levels at the Esr1 locus are tightly regulated, and may not contribute to the documented age-related methylation patterns at this locus.
GO terms enriched by age showed specific enrichment based on directionality of differential methylation or hydroxymethylation. This suggests that age is associated with up- or down-regulation of specific biological processes. As an example, we found increased 5hmC with age near genes involved in T cell activation, and decreased 5hmC near genes related to B cell activation. Reports have shown age-related changes in T cell and B cell function and generation [Citation35,Citation36], so these differences in enriched pathways may reflect distinct epigenetic changes that occur in T cell and B cell populations with age. Related to this idea, it is possible that many of the age-related enriched pathways are actually a reflection of age-related shifts in blood cell populations [Citation37], not defined changes in biological regulation. This possibility should be further investigated in additional longitudinal studies of the mouse and/or human blood epigenome.
DNA methylation and hydroxymethylation levels vary by tissue [Citation14,Citation38,Citation39], so it remains to be seen whether the documented epigenetic aging in blood is consistent in other murine tissues – e.g., liver, kidney, brain. Despite this uncertainty, blood samples have some distinct advantages over other murine target tissues. First, we were able to collect blood samples from the same mice over time, allowing for direct measurement of intra-individual age-related methylation during adulthood. Second, the use of tail vein puncture at 2 and 4 months of age meant that blood collection was minimally invasive and did not disrupt mouse health. Third, the use of blood allows for greater translatability to human epigenetics studies, which often use peripheral blood samples collected in the field or clinic. For these reasons, we chose to use blood samples as our tissue of interest; future studies should examine whether our results carry over to other target tissues.
ERRBS is not a whole-genome sequencing method, rather relying on MspI (C^CGG) restriction enzyme digestion to enrich for GC-rich regions prior to amplification and sequencing [Citation40]. CpG-dense regions are often found in regulatory regions (e.g., promoters), and may be under tight biological control, limiting 5mC variability. Additionally, these well-regulated regions may not be sensitive to a variable like age, which shows lower magnitude epigenetic effects than distinct disease states like cancer. Supporting this idea, previous literature shows that age-related methylation occurs at high rates in repetitive elements and intragenic regions [Citation41], genetic locations that are not well covered by ERRBS. The genomic bias inherent in ERRBS data may also partially explain the low number of overlapping DMCs and DHMRs in our data. Specifically, we noted a number of DHMRs that did not have coverage in ERRBS data, a constraint that weakened our comparative analyses.
In addition to coverage inconsistencies, data from the two sequencing methods were also analyzed using different statistical methods. While the selected analysis methods are appropriate for their respective sequencing data types, differences in resolution and statistical methods make it difficult to directly compare called DMCs and DHMRs. Additionally, the selected methods made it difficult to determine whether the identified age-related DMCs/DHMRs are truly regulatory regions or just interspersed age-related changes at individual CpG sites. For the differential HMeDIP-seq analysis, the identified DHMRs were regions of at least 100 bp that showed a significant difference in 5hmC binding with age. However, given the IP-based nature of the HMeDIP-seq method, we do not know exactly how many CpG sites are contributing to the differential 5hmC binding at a given region. Meanwhile, for the differential ERRBS analysis, individual CpGs with differential methylation were sometimes annotated to shared geneIDs, but were not necessarily consecutive or grouped CpG sites. To avoid these limitations, future studies could use similar methods – e.g., whole genome bisulfite sequencing (WGBS) and oxidative bisulfite sequencing (oxBS-seq) – to measure epigenome-wide site-specific 5mC and 5hmC. While expensive, WGBS provides genomic coverage far greater than ERRBS [Citation42], and simultaneous oxBS-seq sequencing would allow for a direct comparison of 5mC and 5hmC at the base pair level [Citation43]. In this way, it would be possible to probe for additional genomic regions where epigenetic aging is driven by changes in 5hmC.
RNA isolations from 2-month-old and 4-month-old live mice via tail vein blood had low RNA yield, making it difficult to perform large-scale RT-qPCR experiments on a longitudinal scale. As a result, the available gene expression data are limited to two particular genes of interest – Nfic and Esr1 – that have shown age-related methylation patterns. While RNA expression at these two genes does reflect age-related 5hmC patterns (or lack thereof), these data are limited, and may not reflect broader age-related regulation of gene expression. Future studies should utilize large-scale transcriptomics methods to examine the link between genome-wide epigenetic aging and gene expression.
Conclusion
We measured DNA methylation and hydroxymethylation in matched blood samples collected from isogenic mice at 2, 4, and 10 months of age, then examined the effects of age on the longitudinal methylome. The use of matched blood allows for greater translatability to bioavailable specimens in human populations. On an epigenome-wide scale, we identified a number of age-related DMCs and DHMRs, suggesting that age alters both 5mC and 5hmC levels throughout the murine life course. Examining the age-related DMCs and DHMRs, we found a small number of DMC/DHMR overlap regions, including one upstream of the Nfic gene. At this region, both 5mC and 5hmC decreased with age, patterns that were reflected in decreased Nfic mRNA expression. This result suggests that age-related methylation patterns at some genes can be at least partially driven by changes in DNA hydroxymethylation, an important consideration for future epigenetic aging studies.
Materials and methods
Study animals and blood collection
Mice included in longitudinal analyses (n = 6 at 3 time points) were a/a offspring sourced from a genetically invariant Avy/a mouse colony maintained by sibling mating and forced heterozygosity for more than 220 generations [Citation44]. Within this colony, the Avy allele is passed through the heterozygous male line, which has a genetically constant background 93% identical to C57BL/6J strain [Citation44,Citation45]. At 2 months and 4 months of age, tail vein blood samples were collected from all mice (). At 10 months of age, mice were sacrificed, and blood samples were collected using cardiac puncture. All animals were stored in polycarbonate-free cages with ad libitum access to food and drinking water, and were maintained in accordance with Institute for Laboratory Animal Research (ILAR) guidelines [Citation46]. Mice were fed a modified AIN-93G standard chow with 7% corn oil substituted for 7% soybean oil (Harlan Teklad). The study protocol was approved by the University of Michigan Committee on Use and Care of Animals (UCUCA).
DNA and RNA isolation
Genomic DNA and RNA were isolated from matched 2 month (n = 6), 4 month (n = 6), and 10 month (n = 6) frozen blood using the Qiagen Allprep DNA/RNA/miRNA Universal Kit (Qiagen, Cat. #80224). All isolates were stored at −80°C.
Next-generation sequencing of 5mC and 5hmC
Epigenome-wide DNA hydroxymethylation and methylation levels were quantified in blood from mouse blood using two sequencing methods – hydroxymethylated DNA immunoprecipitation sequencing (HMeDIP-seq) and enhanced reduced representation bisulfite sequencing (ERRBS) [Citation40,Citation47]. Standard bisulfite sequencing methods, including ERRBS, do not distinguish between 5mC and 5hmC, so HMeDIP-seq data was generated in parallel to ERRBS to specifically measure epigenome-wide 5hmC. Sequencing data were generated for a subset of colony mice (n = 6) with longitudinal blood collection (). Blood samples from the six mice (3 male, 3 female) were sequenced at three time points across the life-course (2, 4, and 10 months of age), giving a total sequencing data sample size of 18 samples for each method. The six mice included in longitudinal analyses were selected from different litters to minimize potential batch effects.
ERRBS was performed at the University of Michigan Epigenomics Core as described [Citation40,Citation48]. Briefly, 75 ng of genomic DNA was digested using MspI, a restriction enzyme that preferentially cuts CG-rich sites. The digested DNA was then purified using phenol:chloroform extraction and ethanol precipitation in the presence of glycogen, before blunt-ending and phosphorylation. A single adenine nucleotide was next added to the 3ʹend of the fragments in preparation for ligation of adapter duplex with a thymine overhang. The ligated fragments were cleaned, and processed for size selection on agarose gel. Selected fragments were treated with sodium bisulfite to convert unmethylated cytosines to uracils, which are then replaced with thymines during PCR amplification. After cleanup with AMPure XP beads (Beckman Coulter, Prod. # A63880), libraries were quantified using the Agilent TapeStation genomic DNA kit (Agilent, Cat. #G2991AA) and Qubit broad range dsDNA (Invitrogen, Cat. #Q32850). Single-end, 50 base pair reads were obtained for each library by sequencing on the HiSeq 4000 system (Illumina). ERRBS samples were multiplexed, with three samples per sequencing lane.
For HMeDIP-seq, which was also performed at the University of Michigan Epigenomics Core, a total of 1 μg of genomic DNA (gDNA) was sheared by adaptive focused acoustics, using the Covaris S220 (Covaris, Cat. #4465653). This sheared DNA was next blunt-ended and phosphorylated. A single adenine nucleotide was then added to the 3ʹend of the fragments in preparation for ligation of adapter duplex with a thymine overhang. The ligated fragments were cleaned using Qiagen’s MinElute PCR purification columns (Qiagen, Cat. #28004). DNA standards for HMeDIP (Diagenode 5hmC, 5mC & cytosine DNA standard pack for HMeDIP, Cat. #AF-107-0040) were added to each sample before denaturation. Resuspension was then performed in ice-cold immunoprecipitation buffer (10 mM Sodium Phosphate pH 7.0, 140 mM NaCl, 0.05% Triton X-100). A 10% volume (input) was retrieved before 2ug of a 5hmC-specific antibody (Active Motif, Cat. #39791) was added for immunoprecipitation overnight at 4°C with rotation. Dynabeads Protein-G (Invitrogen, Cat. #10003D) was used to pull-down of 5hmC-enriched fragments. The 5hmC-enriched DNA fragments (IP) were then released from the antibody by digestion with Proteinase K (Ambion, Cat. #AM2548). After cleanup with AMPure XP beads (Beckman Coulter, Prod.# A63880), the percent input enrichment (%input) in the IP was evaluated by qPCR, using primers for spike-ins. Samples with high %input for the 5hmC spike-in – typical inclusion threshold was > 80% – were then PCR amplified for the final library production, cleaned using AMPure XP beads, and quantified using the Qubit assay (Invitrogen, Cat. #Q32850) and TapeStation High Sensitivity D1000 kit (Agilent, Cat. #G2991AA). Single-end, 50 base pair reads were obtained for each library by sequencing on the HiSeq 4000 system (Illumina). Each HMeDIP-seq sample was run on a single sequencing lane.
Bioinformatics pipeline for differential 5mC and 5hmC
Sequencing results for all three ages were compared using a number of bioinformatics tools (). The mint pipeline was used for data quality control (FastQC and MultiQC), adapter trimming (trim_ galore), and alignment (bismark and bowtie2) [Citation49]. For quality and adapter trimming, we required a minimum overlap of 6 bp and minimum quality score of 20 in conjunction with special ERRBS trimming of 2 bp from the 3ʹend. For bismark methylation extractor, the minimum threshold to consider a CpG site in analysis was 5 reads. Default parameters were used for bowtie2.
The DSS R package was used to test for differential 5mC in ERRBS data by age [Citation50–Citation53]. Within the DSS package, the DMLfit.multiFactor function was used to test for differential methylation by age using a multifactorial modeling approach, with matched mouse ID and sex included as covariates. Age (2 months, 4 months, 10 months) was included as an ordinal variable in modeling. As such, modeling was performed according to the following formula: ~age + mouseID + sex. The DMLtest.multiFactor function was used to test the null hypothesis that the age coefficient was equal to 0. Differentially methylated CpG sites (DMCs) were then sorted and filtered according to a false discovery rate (FDR) cutoff <0.05.
The csaw package was used to test for differential 5hmC by age [Citation54]. Aligned HMeDIP-seq data were read into R using the windowCounts function in csaw. When reading in the data, extension was set to 52, window width was set to 100, and sex chromosomes were removed. Next, the data were filtered twice – by count (average count > 5) and by local enrichment using the filterWindows function (type = ‘local’) – to remove regions of negligible binding. After filtering, normalization factors were calculated for each sample using the normOffsets function on binned data (width = 10,000). Normalization factors were linked to filtered data using the asDGEList function, and then the estimateDisp function was used to generate dispersion factors based on a multifactorial design matrix identical to that used for ERRBS data. The glmQLFit function was used to fit a model for differential 5hmC binding by age; an empirical Bayesian method used to stabilize the QL dispersion estimates. A contrast statement was used to extract modeling results for the age variable. To correct for multiple testing, filtered data were clustered using a window length of 500 bp; the combineTests function was then used to compute a combined P value for each cluster. The Benjamini-Hochberg method was then used to control the FDR in all clusters [Citation55,Citation56]. DHMRs were called using an FDR <0.10.
After testing for differential 5mC and 5hmC, the annotatr R package was used to annotate all DMCs and DHMRs to the mm10 genome [Citation57]. The annotate_regions function was used to generate annotations, including gene IDs and genomic context (e.g., intron, exon, promoter, etc.). Within annotatr, the randomize_regions function was used to create a secondary, random distribution of annotated sites or regions from the complete ERRBS or HMeDIP-seq data, respectively. Distributions of DMCs and DHMRs by genomic annotation were plotted against the random distribution using the plot_categorical and plot_annotation functions, respectively. Lists of chromosomal locations were compared using the bedtools (version 2.26.0) intersect function to determine overlap between DMCs and DHMRs.
Sequencing data visualization
Levels of 5mC were visualized using the RnBeads R package [Citation58]. Within this package, the rnb.execute.import function was first used to import the aligned ERRBS data. Next, the rnb.sample.groups function was used to group samples by age. The rnb.plot.locus.profile function was then used to plot relative 5mC level in a heat map output for defined regions of the genome (see ). A custom set of nine red colors were chosen from RColorBrewer for the heat map gradient.
Levels of 5hmC were visualized using the csaw and GViz R packages [Citation54,Citation59]. Data were read into R as a GRanges object using the extractReads function. Next, the GeneRegionTrack in the Gviz R package was used to define regions of interest for visualization. Separate blue and red genome tracks were used to represent the forward and reverse strand reads, respectively. The plotTracks function was then used to plot 5hmC levels for these regions. Reads-per-million was used for the y-axis in all graphs, and scale was adjusted to individual region coverage.
Plots generated in R (R version 3.4.0) were formatted for publication in Adobe Illustrator CS6 (version 16.0.5).
Real-time quantitative PCR (RT-qPCR)
The Bio-Rad iScript cDNA Synthesis Kit (Cat. #1708890) was used to reverse transcribe complementary DNA (cDNA) from 250 ng of RNA for each blood sample (n = 6 per age). In preparation for RT-qPCR, cDNA samples were diluted 1:2.5 in RNase-free water, then mixed with 10 µM forward/reverse primers, nuclease-free water, and Bio-Rad iQ SYBR Green Supermix (Cat. #1708880). RT-qPCR was then performed using a Bio-rad CFX96 Real-Time System C1000 Thermal Cycler (Bio-Rad; Hercules, CA). The pre-programmed 2-step PCR+ melt curve protocol was used for all qPCR reactions – 95°C for 3 minutes, [95°C for 10 seconds, 55°C for 30 seconds, plate read] x40, 95°C for 10 seconds. The melt curve for each plate was 65°C–95°C; 0.5°C increment for 5 seconds, with plate read at each temperature. RT-qPCR analyses were performed for the Nfic and Esr1 gene in triplicate for each cDNA sample. Three housekeeping genes – Actb, 18S, and Gapdh – were included as internal controls in all RT-qPCR runs. In addition to housekeeping genes, an inter-plate calibrator control of brain cDNA was included for calculation of relative gene expression across multiple plates. Expression levels were calculated following the 2−ΔΔCt method [Citation60]. RT-qPCR primers for the Nfic, Esr1, and Gapdh genes (Table S3) were designed using the online Genscript Real-time PCR Primer Design software (https://www.genscript.com/tools/real-time-pcr-tagman-primer-design-tool). The Actb and 18S gene primer pairs were sourced from the literature [Citation61,Citation62]. Primer pair specificity for all designed primers was checked using the NCBI Primer-BLAST online tool (https://www.ncbi.nlm.nih.gov/tools/primer-blast/).
Pathway analysis
Pathway analyses for DMCs and DHMRs were performed using the ChIP-enrich analysis tool [Citation63]. In the ChIP-enrich online interface (http://chip-enrich.med.umich.edu/), the gene set filter was set to 2000, peak threshold was set to 1, and adjustment for mappability of gene locus regions was set to false. The ChIP-enrich method was used for GO term and KEGG pathway enrichment testing against the mm10 reference genome. Both DMCs and DHMRs were split into hypo- and hyper-methylated sites/regions prior to separate analyses. For DHMRs and DMCs, only peaks <5 kb from TSS were included in ChIP-enrich analysis. Due to the large number of significant DMCs, DMC pathway analyses were restricted to CpGs annotated to promoter regions. After correcting for multiple testing, pathways with FDR <0.05 were considered significant.
Supplemental Material
Download Zip (902.8 KB)Acknowledgments
We thank Dr. Claudia Lalancette at the University of Michigan Epigenomics Core for ERRBS and HMeDIP-seq DNA library preparation. We also thank the University of Michigan Bioinformatics Core for sequencing data generation and quality control.
Disclosure statement
No potential conflict of interest was reported by the authors.
Supplemental Material
Supplemental data for this article can be accessed here.
Additional information
Funding
Related Research Data
References
- Medvedeva YA, Khamis AM, Kulakovskiy IV, et al. Effects of cytosine methylation on transcription factor binding sites. BMC Genomics. 2014;15:119.
- Slotkin RK, Martienssen R. Transposable elements and the epigenetic regulation of the genome. Nat Rev Genet. 2007;8:272–285.
- Reik W, Dean W, Walter J. Epigenetic reprogramming in mammalian development. Science. 2001;293:1089–1093.
- Smallwood SA, Kelsey G. De novo DNA methylation: a germ cell perspective. Trends Genet. 2012;28:33–42.
- Messerschmidt DM, Knowles BB, Solter D. DNA methylation dynamics during epigenetic reprogramming in the germline and preimplantation embryos. Genes Dev. 2014;28:812–828.
- Jung M, Pfeifer GP. Aging and DNA methylation. BMC Biol. 2015;13:7.
- Kochmanski J, Montrose L, Goodrich JM, et al. Environmental deflection: the impact of toxicant exposures on the aging epigenome. Toxicol Sci. 2017;156:325–335.
- Jones MJ, Goodman SJ, Kobor MS. DNA methylation and healthy human aging. Aging Cell. 2015;14:924–932.
- Shen L, Song CX, He C, et al. Mechanism and function of oxidative reversal of DNA and RNA methylation. Annu Rev Biochem. 2014;83:585–614.
- Wu H, D’Alessio AC, Ito S, et al. Genome-wide analysis of 5-hydroxymethylcytosine distribution reveals its dual function in transcriptional regulation in mouse embryonic stem cells. Genes Dev. 2011;25:679–684.
- Hahn MA, Szabó PE, Pfeifer GP. 5-Hydroxymethylcytosine: a stable or transient DNA modification? Genomics. 2014;104:314–323.
- Mellén M, Ayata P, Dewell S, et al. MeCP2 binds to 5hmC enriched within active genes and accessible chromatin in the nervous system. Cell. 2012;151:1417–1430.
- Spruijt CG, Gnerlich F, Smits AH, et al. Dynamic readers for 5-(hydroxy)methylcytosine and its oxidized derivatives. Cell. 2013;152:1146–1159.
- Globisch D, Münzel M, Müller M, et al. Tissue distribution of 5-hydroxymethylcytosine and search for active demethylation intermediates. PLoS One. 2010;5:e15367.
- Nestor CE, Ottaviano R, Reddington J, et al. Tissue type is a major modifier of the 5-hydroxymethylcytosine content of human genes. Genome Res. 2012;22:467–477.
- Wen L, Li X, Yan L, et al. Whole-genome analysis of 5-hydroxymethylcytosine and 5-methylcytosine at base resolution in the human brain. Genome Biol. 2014;15:R49.
- Hernandez Mora JR, Sanchez-Delgado M, Petazzi P, et al. Profiling of oxBS-450K 5-hydroxymethylcytosine in human placenta and brain reveals enrichment at imprinted loci. Epigenetics. 2018;13:182–191.
- Kochmanski J, Marchlewicz EH, Savidge M, et al. Longitudinal effects of developmental bisphenol A and variable diet exposures on epigenetic drift in mice. Reprod Toxicol. 2017;68:154–163.
- Kochmanski J, Marchlewicz EH, Cavalcante RG, et al. Longitudinal effects of developmental bisphenol A exposure on epigenome-wide DNA hydroxymethylation at imprinted loci in mouse blood. Env Heal Perspect 2018. In revision.
- López V, Fernández AF, Fraga MF. The role of 5-hydroxymethylcytosine in development, aging and age-related diseases. Ageing Res Rev. 2017;37:28–38.
- Xiong J, Jiang H-P, Peng C-Y, et al. DNA hydroxymethylation age of human blood determined by capillary hydrophilic-interaction liquid chromatography/mass spectrometry. Clin Epigenet. 2015;7:72.
- Truong TP, Sakata-Yanagimoto M, Yamada M, et al. Age-dependent decrease of DNA hydroxymethylation in human T cells. J Clin Exp Hematop. 2015;55:1–6.
- Heyn H, Li N, Ferreira HJ, et al. Distinct DNA methylomes of newborns and centenarians. Proc Natl Acad Sci USA. 2012;109:10522–10527.
- Horvath S. DNA methylation age of human tissues and cell types. Genome Biol. 2013;14:R115.
- Stroud H, Feng S, Kinney SM, et al. 5-Hydroxymethylcytosine is associated with enhancers and gene bodies in human embryonic stem cells. Genome Biol. 2011;12:R54.
- Harris L, Genovesi LA, Gronostajski RM, et al. Nuclear factor one transcription factors: divergent functions in developmental versus adult stem cell populations. Dev Dyn. 2015;244:227–238.
- Chaudhry AZ, Lyons GE, Gronostajski RM. Expression patterns of the four nuclear factor I genes during mouse embryogenesis indicate a potential role in development. Dev Dyn. 1997;208:313–325.
- Gronostajski RM. Roles of the NFI/CTF gene family in transcription and development. Gene. 2000;249:31–45.
- Edelmann S, Fahrner R, Malinka T, et al. Nuclear Factor I-C acts as a regulator of hepatocyte proliferation at the onset of liver regeneration. Liver Int. 2015;35:1185–1194.
- Lee D-S, Choung H-W, Kim H-J, et al. Regulates osteoblast differentiation via control of osterix expression. Stem Cells. 2014;32:2467–2479.
- Roh SY, Park J-C. The role of nuclear factor I-C in tooth and bone development. J Korean Assoc Oral Maxillofac Surg. 2017;43:63.
- Sérandour AA, Avner S, Oger F, et al. Dynamic hydroxymethylation of deoxyribonucleic acid marks differentiation-associated enhancers. Nucleic Acids Res. 2012;40:8255–8265.
- Ehrlich M, Ehrlich KC. DNA cytosine methylation and hydroxymethylation at the borders. Epigenomics. 2014;6:563–566.
- Greco CM, Kunderfranco P, Rubino M, et al. DNA hydroxymethylation controls cardiomyocyte gene expression in development and hypertrophy. Nat Commun. 2016;7:12418.
- Cancro MP, Hao Y, Scholz JL, et al. B cells and ag-ing: molecules and mechanisms. Trends Immunol. 2009;30:313–318.
- Moro-García MA, Alonso-Arias R, López-Larrea C. When aging reaches CD4+ T-cells: phenotypic and functional changes. Front Immunol. 2013;4:1–12.
- Jaffe AE, Irizarry RA. Accounting for cellular heterogeneity is critical in epigenome-wide association studies. Genome Biol. 2014;15:R31.
- Lokk K, Modhukur V, Rajashekar B, et al. DNA methylome profiling of human tissues identifies global and tissue-specific methylation patterns. Genome Biol. 2014;15:3248.
- Maegawa S, Hinkal G, Kim HS, et al. Widespread and tissue specific age-related DNA methylation changes in mice. Genome Res. 2010;20:332–340.
- Garrett-Bakelman FE, Sheridan CK, Kacmarczyk TJ, et al. Enhanced reduced representation bisulfite sequencing for assessment of DNA methylation at base pair resolution. J Vis Exp. 2015;96:e52246.
- Zampieri M, Ciccarone F, Calabrese R, et al. Reconfiguration of DNA methylation in aging. Mech Ageing Dev. 2015;151:60–70.
- Ziller MJ, Hansen KD, Meissner A, et al. Coverage recommendations for methylation analysis by whole-genome bisulfite sequencing. Nat Methods. 2015;12:230–232.
- Booth MJ, Ost TWB, Beraldi D, et al. Oxidative bisulfite sequencing of 5-methylcytosine and 5- hydroxymethylcytosine. Nat Protoc. 2013;8:1841–1851.
- Waterland RA, Jirtle RL. Transposable elements: targets for early nutritional effects on epigenetic gene regulation. Mol Cell Biol. 2003;23:5293–5300.
- Weinhouse C, Anderson OS, Bergin IL, et al. Dose-dependent incidence of hepatic tumors in adult mice following perinatal exposure to bisphenol A. Env Heal Perspect. 2014;122:485–491.
- National Research Council (US). Committee for the update of the guide for the care and use of laboratory animals. In: Guide for the care and use of laboratory animals. Washington, D.C.: National Academies Press (U.S.); 2011.
- Tan L, Xiong L, Xu W, et al. Genome-wide comparison of DNA hydroxymethylation in mouse embryonic stem cells and neural progenitor cells by a new comparative hMeDIP-seq method. Nucleic Acids Res. 2013;41:e84.
- Akalin A, Kormaksson M, Li S, et al. methylKit: a comprehensive R package for the analysis of genome-wide DNA methylation profiles. Genome Biol. 2012;13:R87.
- Cavalcante RG, Patil S, Park Y, et al. Integrating DNA methylation and hydroxymethylation data with the mint pipeline. Cancer Res. 2017;77:e27–e30.
- Wu H, Wang C, Wu Z. A new shrinkage estimator for dispersion improves differential expression detection in RNA-seq data. Biostatistics. 2013;14:232–243.
- Feng H, Conneely KN, Wu HA. Bayesian hierarchical model to detect differentially methylated loci from single nucleotide resolution sequencing data. Nucleic Acids Res. 2014;42:1–11.
- Wu H, Xu T, Feng H, et al. Detection of differentially methylated regions from whole-genome bisulfite sequencing data without replicates. Nucleic Acids Res. 2015;43:1–9.
- Park Y, Wu H. Differential methylation analysis for BS-seq data under general experimental design. Bioinformatics. 2016;32:1446–1453.
- Lun ATL, Smyth GK. csaw: a bioconductor package for differential binding analysis of ChIP-seq data using sliding windows. Nucleic Acids Res. 2016;44:e45–e45.
- Benjamini Y, Hochberg Y. Multiple hypotheses testing with weights. Scand J Stat. 1997;24:407–418.
- Benjamini Y, Hochberg Y. Controlling the false discovery rate: a practical and powerful approach to multiple testing. J R Stat Soc SeR B. 1995;57:289–300.
- Cavalcante RG, Sartor MA. annotatr: genomic regions in context. Bioinformatics. 2017;33:2381–2383.
- Assenov Y, Müller F, Lutsik P, et al. Comprehensive analysis of DNA methylation data with RnBeads. Nat Methods. 2014;11:1138–1140.
- Hahne F, Ivanek R. Visualizing genomic data us-ing gviz and bioconductor. I Methods Mol Biol. 2016;1418:335–351.
- Livak KJ, Schmittgen TD. Analysis of relative gene expression data using real-time quantitative PCR and the 2−ΔΔCT method. Methods. 2001;25:402–408.
- Dolinoy DC, Weinhouse C, Jones TR, et al. Variable histone modifications at the A(vy) metastable epiallele. Epigenetics. 2010;5:637–644.
- La Salle S, Mertineit C, Taketo T, et al. Windows for sex-specific methylation marked by DNA methyltransferase expression profiles in mouse germ cells. Dev Biol. 2004;268:403–415.
- Welch RP, Lee C, Imbriano PM, et al. ChIP-enrich: gene set enrichment testing for ChIP-seq data. Nucleic Acids Res. 2014;42:e105–e105.