
ABSTRACT
Hepatocellular carcinomas (HCCs) contain a sub-population of cancer stem cells (CSCs) that are responsible for tumor relapse, metastasis, and chemoresistance. We recently showed that loss of macroH2A1, a variant of the histone H2A and an epigenetic regulator of stem-cell function, in HCC leads to CSC-like features such as resistance to chemotherapeutic agents and growth of large and relatively undifferentiated tumors in xenograft models. These HCC cells silenced for macroH2A1 also exhibited stem-like metabolic changes consistent with enhanced glycolysis. However, there is no consensus as to the metabolic characteristics of CSCs that render them adaptable to microenvironmental changes by conveniently shifting energy production source or by acquiring intermediate metabolic phenotypes. Here, we assessed long-term proliferation, energy metabolism, and central carbon metabolism in human hepatoma HepG2 cells depleted in macroH2A1. MacroH2A1-depleted HepG2 cells were insensitive to serum exhaustion and showed two distinct, but interdependent changes in glucose and lipid metabolism in CSCs: (1) massive upregulation of acetyl-coA that is transformed into enhanced lipid content and (2) increased activation of the pentose phosphate pathway, diverting glycolytic intermediates to provide precursors for nucleotide synthesis. Integration of metabolomic analyses with RNA-Seq data revealed a critical role for the Liver X Receptor pathway, whose inhibition resulted in attenuated CSCs-like features. These findings shed light on the metabolic phenotype of epigenetically modified CSC-like hepatic cells, and highlight a potential approach for selective therapeutic targeting.
Introduction
Nonalcoholic fatty liver disease (NAFLD), characterized by intra-hepatic lipid accumulation, can evolve into nonalcoholic steatohepatitis (NASH) under conditions of oxidative stress and inflammation. NASH is a serious risk factor for cirrhosis and hepatocellular carcinoma (HCC) [Citation1], and the risks of NAFLD, NASH and, ultimately, HCC increase with age. As such, HCC is considered the end point of liver disease, and is the second leading cause of cancer-associated deaths world-wide [Citation2]. HCC is a highly metastatic, relapse-prone cancer due to the presence of liver cancer stem cells (CSCs) within tumors [Citation3] that can self-renew and differentiate to give rise to all HCC cell types [Citation3]. CSCs are not highly proliferative, but their progeny have the capacity to expand, differentiate, and increase the tumor mass. CSCs are resistant to chemotherapy and persist in HCC [Citation4], causing relapse and metastasis. Targeting CSCs is, therefore, necessary to improve the outcomes and survival of patients with metastatic HCC.
Numerous surface and cellular prognostic/diagnostic markers, such as keratin 19, Laminin-332, CD133, CD44, CD90, CD13, and EpCAM, and key signaling pathways, including Notch and Hedgehog have been proposed to identify liver CSCs [Citation5,Citation6]. However, the epigenetic processes controlling CSC stem-like features and tumorigenic potential are unclear. Most research efforts have focused on DNA methylation and posttranslational modification of canonical histones H2A, H2B, H3, and H4. We recently investigated the loss of the histone variant macroH2A1a as a mechanism that increases CSC-like properties of hepatic cancer cells [Citation7]. MacroH2A1 is an histone variant of the H2A histone family that contains a histone-fold domain with 66% identity to replication-coupled histone H2A, and a C-terminal linker that connects the histone fold domain to a macro domain [Citation8]. MacroH2A1 exhibits the highest sequence divergence from other members of the H2A histone family, and has the largest number of variants that can replace replication-coupled H2A in chromatin [Citation9]. As a chromatin component, macroH2A can differentially regulate transcriptional activity to induce either gene repression or activation [Citation10]. Transcriptional regulation by macroH2A1 has been associated with the pathogenesis of numerous cancers, including skin, breast, lung, and colon [Citation9], with the majority of data identifying macroH2A as tumor suppressor [Citation11]. Conversely, macroH2A acts as barrier to somatic cell reprogramming, at the mesenchymal-to-epithelial transition [Citation12,Citation13].
In the context of HCC, macroH2A1 is a marker of differentiated liver tumor cells and protects them from decitabine-induced senescence [Citation14,Citation15]. In embryonic and adult stem cells, macroH2A1 levels negatively correlate with self-renewal capacity and regulate the delicate balance between self-renewal and differentiation [Citation7]. Aggressive and metastatic human HCCs have particularly low macroH2A1 content [Citation7], and macroH2A1 knockdown (KD) in HCC cells lead to CSC-like features and massive alterations to the nuclear architecture [Citation7,Citation16]. MacroH2A1-deficient CSC-like cells also exhibit metabolic alterations, including increased glycolysis and decreased mitochondrial respiration (OXPHOS) [Citation7]. However, there is controversy as to whether CSCs are mainly glycolytic or rely more on OXPHOS and what determines the switch between these two forms of energy utilization/production [Citation17]. Although CSCs have been described as primarily glycolytic or preferentially relying on OXPHOS in a tumor type-dependent manner, contradictory findings even derived from within the same tumor type have been reported [Citation18].
In the present study, we hypothesized that loss of histone variant macroH2A1 might confer stem-like features to HCC cells by switching energy metabolism pathways. We assessed long-term proliferation, energy, and central carbon metabolism in human hepatoma HepG2 cells, a long established HCC cell model [Citation19,Citation20], in which macroH2A1 was stably depleted. MacroH2A1-depleted HCC cells were insensitive to serum starvation, and thereby to the lack of growth factors in the medium. Using a combination of noninvasive electrical impedance, Seahorse XF, ultra-high performance liquid chromatography coupled to mass spectrometry (UHPLC-MS), and microscopy approaches, we found that absence of macroH2A1 triggers two main changes in glucose and lipid metabolic profiles in CSCs-like HCC cells: i) massive upregulation of acetyl-coA that does not enter the citric acid cycle but it is transformed into lipid droplets and ii) increased activation of the pentose phosphate pathway (PPP), which diverts glycolytic intermediates to provide anabolic precursors for nucleotide synthesis. Integration of metabolomic analyses with RNA-Seq data revealed a critical role for the Liver X Receptor (LXR) pathway in cancer cell stemness.
Results
MacroH2A1 knockdown (KD) renders HCC cells insensitive to confluency-dependent and serum starvation-dependent inhibition
Reduced macroH2A1 levels leads to the emergence of CSC properties in HCC cells [Citation7,Citation16]. As such, we stably suppressed macroH2A1 expression by lentivirus-mediated transduction of shRNAs in human HCC HepG2 cells and confirmed the KD by immunoblotting ()). We generated cell growth curves for control and KD cells using the RTCA system, which allows for different cellular growth profiles due cell seeding density to be determined. Control cells exhibited a significant time-dependent decrease in cell index (40.5 ± 7.0% cell index variation, P < 0.001) after 24 h cell growth in all cell density conditions ()). Interestingly, a decrease in cell index was not observed in KD cells ()); instead, the growth phase reached a plateau in all experimental groups (14.0 ± 3.5% cell index variation, P < 0.001).
Figure 1. MacroH2A1 knockdown (KD) renders HepG2 hepatocellular carcinoma (HCC) cells insensitive to confluency-dependent and serum starvation-dependent inhibition. A. Lysates from HepG2 cells transduced with a vector carrying macroH2A1 shRNA (KD) or an empty control vector (CTL) [Citation7] were immunoblotted with an anti-macroH2A1 antibody. Histone H3 was used as a loading control. B. Real time cell proliferation monitoring using the xCELLigence system with different cell densities of CTL and KD cells. Each line represents the average of four independent experiments. C. Lysates from HepG2 cells, as in A, were immunoblotted with FAK and phosphoFAK (Y397) antibodies. GAPDH was used as a loading control. Representative immunoblots of three independent experiments are shown.
![Figure 1. MacroH2A1 knockdown (KD) renders HepG2 hepatocellular carcinoma (HCC) cells insensitive to confluency-dependent and serum starvation-dependent inhibition. A. Lysates from HepG2 cells transduced with a vector carrying macroH2A1 shRNA (KD) or an empty control vector (CTL) [Citation7] were immunoblotted with an anti-macroH2A1 antibody. Histone H3 was used as a loading control. B. Real time cell proliferation monitoring using the xCELLigence system with different cell densities of CTL and KD cells. Each line represents the average of four independent experiments. C. Lysates from HepG2 cells, as in A, were immunoblotted with FAK and phosphoFAK (Y397) antibodies. GAPDH was used as a loading control. Representative immunoblots of three independent experiments are shown.](/cms/asset/e759ed6e-ea26-40aa-a058-c8bacd468f46/kepi_a_1514239_f0001_oc.jpg)
A marked difference was though observed when HepG2 cells were seeded at low confluency (5,000 cells per well of a RTCA system 96X E-Plate, corresponding to ~ 25% confluency). Here, KD cells proliferated less than control cells. Conversely, KD cells seeded at high confluences (10,000, 15,000 or 20,000 cells per well) proliferated more than control cells ()). The focal adhesion tyrosine kinase (FAK) is activated and autophosphorylated on Tyrosine 397 in human HCC cells, including HepG2 cells, when cells are proliferating and increasing in confluency [Citation21]. Interestingly, we found that control cells expressed higher levels of phospho-FAK Y397 compared to KD cells, irrespective of their confluency (). These data suggest that macroH2A1 KD renders HCC cells insensitive to confluency-dependent and serum starvation-dependent inhibition.
Metabolomic analysis uncovers a glycolytic shift in macroH2A1KD HCC cells
We next analyzed the endogenous metabolic profiles of control and macroH2A1 KD HepG2 cells. Metabolic profiling relies on the ability to determine changes in the total complement of metabolites in cells, liquids, or tissues. We thus selected a technical approach based on UHPLC-MS that has high sensitivity, a large coverage over different classes of metabolites, high throughput capacity, and a wide dynamic range [Citation22–Citation24]. Our UHPLC-MS platform was optimized for profiling 64 metabolites involved in central carbon metabolism (CCM; Table S1; Supplemental Data). RCCM uses a complex series of enzymatic steps to convert carbohydrates into metabolic precursors. These precursors are then used to generate the entire biomass of the cell. CCM involves three main pathways: glycolysis, the PPP, and the citric acid cycle.
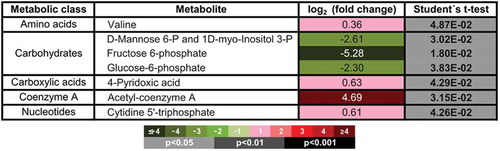
As a first step, we performed supervised orthogonal partial least-squares to latent (OPLS) approaches for the analysis of control (n = 7) and KD (n = 7) cells () to select the most predictive or discriminative features of the data that help classify the samples 25 ),shows the score scatter plot of this OPLS model, which identified a clear clustering of samples according to the experimental group (), metabolites responsible for the separation observed between CTL and KD cells can be observed in the loading scatter plot, which is related to the score scatter plot (). Metabolites lying away from the plot origin have stronger impact on the model; furthermore, variables positively correlated are grouped together, while variable negatively correlated are positioned in the opposite sides of the plot origin (). We then conducted a univariate data analysis, calculating the group percentage changes and unpaired Student’s t-test P value for the comparisons between control and KD cells. The fold changes and unpaired Student’s t-test of each individual metabolite and of each metabolic class are detailed in the Table S1. Significant differences were found between seven of the 64 tested metabolites in KD cells compared to control HepG2 cells. These seven metabolites included a significant reduction in four carbohydrates (D-mannose 6-phosphate, 1D-myo-Inositol-3-phosphate, fructose 6-phosphate, and glucose 6-phosphate), and a significant increase in acetyl-CoA in KD versus control cells ().
Figure 2. Score scatter (A) and loading scatter (B) plots of 64 metabolites detected by UHPLC-MS in HepG2 control (CTL; n = 7) vs. macroH2A1 knockdown (KD; n = 7) cells. Both plots were generated using the supervised orthogonal partial least-squares to latent (OPLS) multivariate model [Citation25]. t[Citation1] in (A) and p[Citation1] in (B) indicate first principle component scores; t0[Citation1] in (A) and p0[Citation1] in (B), indicate second principle component scores.
![Figure 2. Score scatter (A) and loading scatter (B) plots of 64 metabolites detected by UHPLC-MS in HepG2 control (CTL; n = 7) vs. macroH2A1 knockdown (KD; n = 7) cells. Both plots were generated using the supervised orthogonal partial least-squares to latent (OPLS) multivariate model [Citation25]. t[Citation1] in (A) and p[Citation1] in (B) indicate first principle component scores; t0[Citation1] in (A) and p0[Citation1] in (B), indicate second principle component scores.](/cms/asset/c9ad4758-2a1c-499e-949c-d977b8b89fb7/kepi_a_1514239_f0002_b.gif)
Figure 3. Metabolite profile of control (CTL) and macroH2A1 knockdown (KD) HepG2 cells obtained by UHPLC-MS. Significantly altered metabolites found in KD compared to CTL cells. Color codes for log2 (fold-change) and unpaired Student’s t-test P values are shown; n = 4.
The PPP generates pentose (5-carbon) sugars and a substantial fraction of the cytoplasmic NADPH required for biosynthetic reactions and the generation of ribose 5-phosphate for nucleotide synthesis. Although the PPP and glycolysis are distinct, they involve three common intermediates: glucose 6-phosphate, glyceraldehyde 3-phosphate, and fructose 6-phosphate, and, as such, the two pathways are interconnected ()). Our metabolomics data identified a downregulation in both glucose 6-phosphate and fructose 6-phosphate, with a 2.5-fold greater downregulation of fructose 6-phosphate compared to glucose 6-phosphate, in KD compared to control cells (, ).
Figure 4. Changes in glycolysis and the pentose phosphate pathway (PPP) in HepG2 cells macroH2A1 knockdown (KD) compared to control (CTL) cells. A. schematic depiction of the PPP. Abbreviations: phosphate (P), bisphosphate (BP), glyceraldehyde 3-phosphate (G3P), dihydroxyacetone phosphate (DHAP), phosphoglycerate (PG), phosphoenolpyruvate (PEP), 6-phosphogluconolactone (6PGL), 6-phosphogluconate (6PG), nicotinamide adenine dinucleotide P (NAD+, NADH), D-ribulose 5-phosphate (Ru5P), D-ribose 5-phosphate (R5P), xylulose 5-phosphate (Xu5P), sedoheptulose 7-phosphate (Su7P), D-erythrose 4-phosphate (E4P). The chart has been generated using the proprietary interactive web-application for metabolomics data analysis Owl Stat App (http://rstudio.owlmetabolomics.com:8031/OwlStatApp/). B. CTL and KD HepG2 cells were subjected to metabolic analysis by measuring the extracellular acidification rate (ECAR, reflecting the rate of glycolysis and the PPP) and oxygen consumption rate (OCR, reflecting the rate of mitochondrial respiration), in the presence or absence of 200 μM 6-Aminonicotinamide (6-AN, a PPP inhibitor) using the Seahorse XF Glycolysis Stress Test Kit. * P < 0.05; n = 3.
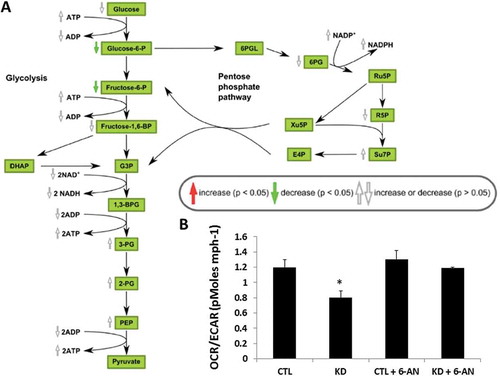
All together, three main metabolic differences were detected in KD cells compared to control cells: i) an excess in glucose 6-phosphate that might not be converted to fructose 6-phosphate and may instead be diverted to the PPP; ii) a trend in increased NADPH content; and iii) increased nucleotide synthesis (trend for ATP, GTP, and UTP; significant augmentation in CTP), which can derive from the NADPH-dependent generation of ribose 5-phosphate available for nucleotide synthesis (, , Table S1). These observations might be indicative of increased activity of the PPP.
To evaluate in depth the metabolic characteristics of glycolysis and the PPP in KD cells, we measured the extracellular acidification rate (ECAR; a measure of the rate of both glycolysis and the PPP) and oxygen consumption rate (OCR; a measure of the rate of mitochondrial respiration), using a Seahorse XF24 Extracellular Flux analyzer. Consistent with previous studies 7, our assessment of the OCR/ECAR ratio indicated that KD cells tend to rely more on glycolysis and the PPP, as they exhibited a lower OCR/ECAR ratio than control cells ()). In cells where the PPP is highly active, inhibition of G6PD (the rate limiting enzyme of PPP) with aminonicotinamide (6-AN) may be useful to differentiate glycolysis from the PPP. As such, we incubated control and KD cells with 200 μM 6-AN for 24 h and the repeated the Seahorse XF24 experiment. Here, we found that inhibition of the PPP pathway restored the OCR/ECAR ratio to basal levels ()). These data support activation of the PPP in HCC cells devoid of macroH2A1 that display CSC-like features.
Macroh2a1 KD HCC cells undergo increased intracellular lipid accumulation
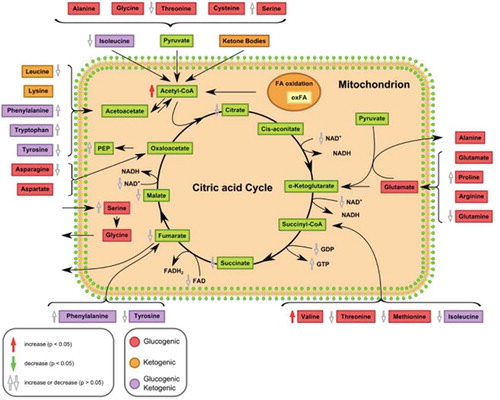
As mentioned above, acetyl-CoA levels were significantly increased in HepG2 KD cells compared to HepG2 control cells (). In eukaryotes, acetyl-CoA is the main substrate of the citric acid cycle. Most of the energy made available by the oxidative steps of the cycle is transferred as energy rich electrons to NAD+, forming NADH. For each acetyl group that enters the citric acid cycle, three molecules of NADH are produced. At the end of each cycle, the four-carbon oxaloacetate has been regenerated, and the cycle continues. However, in macroH2A1 KD HepG2 cells (that models CSCs), there was a trend towards decreased amounts of intracellular NAD+ and the citric acid cycle intermediates citrate, fumarate, and malate, compared to control cells (, Table S1).
Figure 5. Changes in the citric acid cycle and catabolism of proteinogenic amino acids in HepG2 macroH2A1 knockdown (KD) versus control (CTL) cells. Amino acids are classified according to the abilities of their products to enter gluconeogenesis (glucogenic amino acids; red) or ketogenesis (orange) or lipid synthesis. Some amino acids are catabolized into both glucogenic and ketogenic products (purple). The chart has been generated using the proprietary interactive web-application for metabolomics data analysis Owl Stat App (http://rstudio.owlmetabolomics.com:8031/OwlStatApp/). Abbreviations: fatty acids (FA), nicotinamide adenine dinucleotide (NAD+, NADH), flavin adenine dinucleotide (FAD+, FADH2), guanosine diphosphate (GDP), guanosine triphosphate (GTP), phosphoenolpyruvate (PEP).
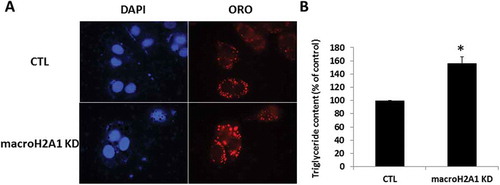
We thus hypothesized that the 5-fold excess in acetyl-CoA might be diverted to fatty acid synthesis via carboxylation by acetyl-CoA carboxylase into malonyl CoA, which is the first committed step in fatty acid synthesis. Indeed, we provided previous ultrastructural (EM) qualitative evidence of increased lipid droplets in macroH2A1 KD HepG2 cells [Citation7]. Here, we detected and quantified lipid droplet accumulation by Oil Red O (ORO) staining followed by fluorescent microscopy ()) and biochemical quantification ()). We found that lipid accumulation was increased in KD compared to control cells. These data demonstrate increased lipid droplet/triglyceride accumulation in HCC cells lacking macroH2A1.
Figure 6. Lipid accumulation in HepG2 macroH2A1 knockdown (KD) cells. A. HepG2 KD and CTL cells were grown on coverslips in standard cell media, and were stained with Oil Red O (ORO) solution and counterstained with DAPI to identify the nuclei. ORO was visualized by fluorescence microscopy. B. The extract solution containing ORO released from staining was then transferred well by well to a 96-well plate for OD measurement at 405 nm using a Microplate Reader. The data represent the means ± S.E.M. C. Triglyceride content in KD versus CTL cells. *P < 0.05 change versus CTL; n = 3.
Integrated metabolomics and transcriptomics identify a role for the LXR pathway in the stemness of macroH2A1 KD HCC cells
Systems biology enables the integration and analysis of data from different ‘omics’ sources. Here, we compared the transcriptional profiles of macroH2A1 KD and control HepG2 cells by RNA-Seq [Citation7] and obtained 493 differentially expressed genes, which were divided in 286 overexpressed and 207 downregulated genes in KD cells (). The overall expression deregulation profile ranged from −27.2 (CD163L1) to 86.6 (CSAG1) with a median fold change value of 2.1. To determine the biological processes or pathway associations involved in carbohydrate and lipid metabolism, we integrated and analyzed transcriptomic and metabolomic data by Ingenuity Pathway Analysis. The only pathway prominently represented in both transcriptomic and metabolic data sets was the Liver X Receptor (LXRs, α and β) pathway (Table S2, ). Significantly differentially expressed genes belonging to this pathway between KD and control cells were ABCG5 and ABCG8 (upregulated), and APOF (LDL), PON1 (HDL), CD36 (downregulated) ().
Figure 7. Volcano plot of differentially expressed genes between KD and control cells. Significantly different genes, i.e., P value < 0.05 and abs(FC) > 2, are indicated in orange. Genes belonging to the LXR pathway are indicated in blue.
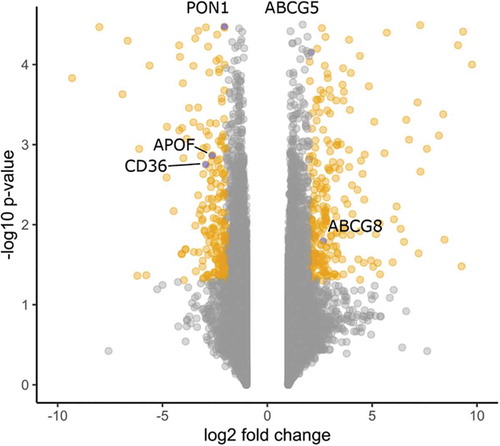
Figure 8. The Liver X Receptor (LXR) pathway as the result of the integration between transcriptomic and metabolomic data. The scheme was generated using the Ingenuity Pathway Analysis (IPA) software. Upregulated and downregulated molecules detected by RNA-Seq are shown in red and green, respectively. Functionally activated or inhibited molecules are shown in orange or blue, respectively, together with their interactions (arrows).
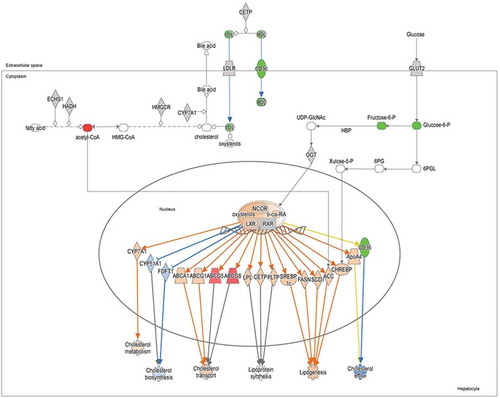
LXRs dimerize with Retinoid X Receptors (RXR) to modulate glucose homeostasis and lipogenesis, which uses acetyl-CoA as a substrate (). There is also notable crosstalk between LXRs and the PPP pathway. Xylulose 5-phosphate (X5P), a metabolite of the PPP, promotes the nuclear entry of the transcriptional factor ChREBP, which is under direct transcriptional control by the LXR (). Moreover, the activity of LXRs can be regulated posttranslationally by O-GlcNAc transferase (OGT) ().
Our computational analysis and previous data led us to hypothesize that the LXR pathway might be central for the observed metabolic changes associated with CSC features induced by depletion of histone macroH2A1. LXRαβand LXRβ total protein levels were comparable between macroH2A1 KD and control cells ()). We then sought to determine whether inhibiting LXRs could attenuate CSC-like features in the KD cells [Citation7]. Here, we incubated control and KD cells with 10 µM SR9243, a strong inverse antagonist of LXRs that inhibits glycolysis and lipogenesis in cancer cells [Citation26] and, after 48 h, performed gene expression, triglyceride, OCR/ECAR ratio, and hypoxia response assays. We first sought to confirm the changes in mRNA expression levels of LXRs targets identified by RNA-Seq using qPCR () [Citation7]. KD cells exhibited ~ 2–3-fold significant increase in ABCG5 and ABCG8, and ~ 2-fold decrease in APOF, PON1 and CD36, consistent with our RNA-Seq data ()). Pre-incubation with SR9243 restored the mRNA expression levels of the LXR downstream targets to basal levels ()). We then repeated the ECAR and OCR measurements using the Seahorse XF24 Extracellular Flux analyzer. The lower OCR/ECAR ratio in KD cells compared to control cells was restored to basal levels upon exposure to the LXR inverse antagonist ()). Moreover, LXR inhibition decreased intracellular lipid droplet accumulation in KD cells, as assessed by biochemical quantification ()), indicating an anti-lipogenic effect.
Figure 9. Changes in HepG2 cancer stem cell (CSC)-like features following liver X receptor (LXR) inhibition. A. Lysates from HepG2 control (CTL) or macroH2A1 knockdown (KD) cells were immunoblotted with anti-LXRα and anti-LXRββantibodies. GAPDH was used as a loading control. Representative immunoblots of three experiments are shown. B. qPCR measurement of mRNA levels of LXRs-target genes: ABCG5, ABCG8, APOF, PON1, CD36, in CTL or KD cells following exposure to 10 µM SR9243 for 48 h. Results are expressed as fold induction of mRNA relative to control. Data are normalized to expression of the housekeeping gene phosphoribosomal protein P0. * P < 0.05; ** P < 0.01; *** P < 0.001 relative to CTL. Data represent the means ± S.D.; n = 3. C. CTL and KD cells were exposed to 10 µM SR9243 for 48 h and then the extracellular acidification rate (ECAR) and oxygen consumption rate (OCR) was measured using the Seahorse XF Glycolysis Stress Test Kit. * P < 0.05 relative to CTL; n = 3. D. Triglyceride content in KD versus CTL cells, upon exposure to 10 µM SR9243 for 48 h. *P < 0.05 change versus CTL; n = 3. E. HIF-1α protein levels in lysates of CTL or KD cells, pre-incubated for 24 h with 10 µM SR9243 before 24 h exposure to normoxia (21% oxygen) or hypoxia (1% oxygen). Results are expressed as the percentage of increase of normoxic levels. Data represent the means ± S.D.; n = 3, ** P < 0.01 relative to CTL; ## P < 0.001 relative to KD cells. F. qPCR measurement of mRNA levels of pluripotency factors: transcription factors OCT-4 (POU5F1), morphogen indian hedgehog homologue (IHH), c-Myc and KLF4 in cells as in B-E. Results are expressed as fold induction of mRNA relative to control. Data are normalized to expression of the housekeeping gene phosphoribosomal protein P0. ** P < 0.01; *** P < 0.001 relative to CTL. Data represent the means ± S.D.; n = 3.
MacroH2A1 KD HepG2 cells exhibit metabolic adaptations that allow them to survive under hypoxic tumor conditions, in a HIF1α-dependent manner [Citation7]. We thus exposed control and KD cells to hypoxic culture conditions in the presence of 10 µM SR9243 for 48 h, and found that the upregulation of HIF1α protein expression was partially – but not significantly – attenuated in the presence of the LXR inhibitor ()). Moreover, as tissue de-differentiation occurs during the malignant process (based on the fact that CSCs can acquire self-renewal and unlimited growth properties through upregulation of reprogramming transcription factors) we assessed the expression of the reprogramming transcription factors Oct-4/POU5F1, IHH, c-Myc, and KLF4, which we found upregulated in macroH2A KD HepG2 cells ()) [Citation7]. SR9243-mediated inhibition of LXR signaling had no effect on the expression of these reprogramming genes ()). All together, these findings uncover an important role for the LXR pathway in mediating at least some of the CSC features of macroH2A1 KD HCC cells.
Discussion
CSCs can generate tumors via differentiation into multiple cell types, and are characterized by their resistance to chemotherapy and capability to promote tumor relapse. The epigenetic mechanisms of nuclear chromatin remodeling are increasingly recognized as crucial factors in the pathophysiology of HCC and in the biology of CSCs. Recently, we identified loss of histone variant macroH2A1 – a known marker and regulator of normal stem-cell renewal and differentiation in embryonic and adult contexts [Citation27–Citation29] – as a strong driver of CSC insurgence [Citation7]. The CSC features acquired by HCC cells in the absence of macroH2A1 expression include resistance to chemotherapy and to a hypoxic environment, increased expression of cell-surface markers, increased expression of reprogramming factors, and enhanced tumorigenesis in xenograft models [Citation7]. Loss of macroH2A1 in HCC also has important clinical implications, as it is associated with poorly differentiated and aggressive HCC and worse prognosis [Citation7]. Despite recent efforts, the metabolic reprogramming associated with CSC phenotypes, and their interdependency, is poorly understood. Here, we show that KD of histone variant macroH2A1 renders HepG2 cells insensitive to serum exhaustion (i.e., growth factor independent) in the cell medium; moreover, KD cells do not exhibit contact inhibition and instead proliferate faster than control cells at high cell density. These phenotypes are typical features of CSCs [Citation30,Citation31]. CSCs are also characterized by a high plasticity in energy substrate metabolism, and they may switch between glycolysis and OXPHOS for energy production, in a context-dependent manner [Citation17]. Our first set of experiments confirmed these critical features of CSCs. Control and macroH2A1 KD cells were cultured without serum and were monitored over a 120 hour period without culture medium change. Control cells exhibited a time-dependent decrease in the cell index compared to KD cells, which instead exhibited a plateau phase in the growth profile. The cell index is directly dependent on cell number and cell viability and therefore our results suggest that KD cells are more resistant to contact inhibition and/or serum exhaustion than control cells. Interestingly, macroH2A1 KD HepG2 cells produce reduced levels of activated FAK compared to control cells, which is associated with increased autophagy and is a CSC feature that can be triggered by serum starvation [Citation7,Citation32].
Resistance to nutrient exhaustion may also reflect metabolic rewiring observed following macroH2A1 KD. In particular, metastatic and aggressive CSCs show greater carbon and energy-source flexibility (enhanced Warburg effect), independent of the epithelial-to-mesenchymal transition [Citation33]. The adaptability of CSC metabolism to the nutritional environment is far from clear [Citation34]. The main findings of our metabolic and metabolomic assays in HCC cells revolve around the selective activation of two intertwined biochemical circuits upon macroH2A1 KD: the PPP and acetyl-CoA-dependent lipid droplet/triglyceride synthesis. The PPP is a fundamental component of cellular metabolism and is crucial for cancer cells as it helps tumor cells satisfy their anabolic demands and maintain redox homeostasis. Glucose-6-phosphate (G6P) is at the convergence point of glycolysis, the PPP, the hexosamine synthesis pathway, and glycogen synthesis [Citation33]. The higher G6P/F6P ratio in KD cells, together with an increased NADPH and nucleotide content, reflects activation of the oxidative arm of the PPP over glycolysis in HCC [Citation35]. In patients with HCC, increased expression of the rate-limiting PPP enzyme glucose-6-phosphate dehydrogenase (G6PD) correlates with grading, metastasis and poor prognosis [Citation36]. The PPP produces nucleotides and elicits an antioxidant defense, and also generates 60% of the cellular NAPDH [Citation37]. NADPH in turn is the building block for fatty acid synthesis (the creation of fatty acids from acetyl-CoA) by acting as the main reductant agent.
Another main finding of the current study is the dramatic increase in acetyl-CoA in KD cells, without a concomitant increase in citric acid cycle intermediates or OXPHOS metabolism. The excess acetyl-CoA in our KD cells is most likely diverted to fatty acid synthesis, and consistently, morphological and biochemical examinations identified increased lipid droplet/triglyceride accumulation in KD cells. Tirinato et al. used spectroscopic imaging to show that high levels of lipid droplets are a distinctive marker of CSCs in colorectal cancer, and correlate well with other CSCs markers [Citation38]. In fact, lipid droplets have long been considered as the fat storage compartment in cellular metabolic processes, and have only recently drawn increased attention by the scientific community for their role in CSCs. Several reports have shown a correlation between upregulated lipidogenic enzymes, such as FASN and SCD1, and lipid droplets, with increased metabolism, oxidative stress, stemness, and tumorigenicity in breast [Citation39], ovarian [Citation40] and lung cancers [Citation41], and in circulating prostate cancer cells [Citation42]. It is tempting to speculate that HCC-derived CSCs might use lipid droplets as an internal energy reservoir to render them independent of growth factors or nutrient scarcity in a hypoxic environment, as observed in other cell types [Citation43]. Our findings corroborate the idea that lipid-droplet accumulation and a lipid profile could have an important role on the tumorigenic properties of CSCs, in addition to being active sites for the synthesis and storage of inflammatory mediators [Citation44,Citation45]. How shifts in energy consumption towards the PPP might be connected to an increase in acetyl-CoA-dependent triglyceride accumulation/lipid droplets in HCC is unknown. Both metabolic pathways share common regulatory elements as well as metabolites that indistinguishably contribute to HCC [Citation46]. Our integrated transcriptomic and metabolomic computational analyses in HepG2 cells uncovered the LXR pathway at the crossroads between lipogenesis and the PPP in the absence of histone macroH2A1. LXRs are established sensors whereby their transcriptional activation regulates several pathways in lipid, cholesterol, and glucose metabolism; more recently, evidence suggests that LXRs have a pivotal role in cancer regulation. In this study, LXR inhibition using the inverse agonist SR9243 attenuated the CSC-like metabolic features in KD cells, such as triglyceride accumulation and glycolytic shift, and had only a mild effect on the hypoxia response. LXR signaling seemed to be dispensable for the activation of reprogramming genes in HCC cells. Traditionally, glycolytic/PPP and lipogenic inhibitors have demonstrated minimal efficacy in cancer treatment strategies, but new synthetic compounds that silence LXRs are now opening new therapeutic opportunities [Citation47]. In this respect, SR9243 shows broad anti-tumor activity by inhibiting both the Warburg effect and lipogenesis in multiple cancer cell lines (lung, pancreas, prostate, and colon cancers) [Citation48]. As standard oncologic treatments typically only shrink the bulk tumor, with the tumor tending to relapse, therapeutic strategies that focus on targeting CSC metabolism may address the ineffectiveness of traditional cancer therapies.
Material and methods
Cell lines and treatment
Stable knockdown (KD) of macroH2A1 in human hepatoma HepG2 and Huh-7 cells was achieved by lentiviral transduction, as previously described [Citation7]. The HepG2 parental line (ATCC, Manassas, VA) was cultured in DMEM (1X) supplemented with 10% fetal bovine serum (FBS) and 1% penicillin/streptomycin. Lentiviral preparations were produced by transient transfection in HEK293T cells, and concentrated 100-fold by centrifugation at 6,000 x g for 16 h at 4°C. MacrroH2A siRNA (sc-62,575-V) was purchased from Santa Cruz Biotechnology (Dallas, TX). HepG2 cells were transduced with the lentivirus (MOI: 10–50) for 24 h in the presence of 4 mg/mL Polybrene (Sigma-Aldrich, UK). Stably transduced cell populations were established by puromycin selection and used in subsequent experiments without clonal selection. Cells were also stably transduced with an empty vector and maintained in similar culture conditions to macroH2A1 KD cells to generate a siRNA control line. The LXR antagonist SR9243 was purchased from Sigma-Aldrich.
Measurement of metabolic potential
Metabolic potential was measured using the XF Glycolysis Stress Test Kit (Agilent Technologies, Prague, Czech Republic). The day before the assay, cells (1 x 10 [Citation4] cell per well) were seeded in pyruvate-free and glucose-free medium in XF24 Cell Culture Miniplates (Agilent Technologies) and incubated overnight at 37°C in a humidified incubator with 5% CO2, with or without 200 µM 6-aminonicotinamide (6-AN; Sigma-Aldrich) or 10 µM SR9243. On the day of the assay, the cells were washed and the medium was replaced with assay medium (Seahorse XB Base Medium with 1 mM pyruvate, 2 mM glutamine, and 10 mM glucose). The cells were then incubated at 37°C in a non-CO2 incubator for 1 h prior to measurement on a Seahorse XF24 analyzer (Agilent Technologies).
Real time cell proliferation monitoring using the xCELLigencesystem
xCELLigence experiments were performed using a Real-Time Cell Analyzer (RTCA) Dual Plate (DP) instrument (Roche Applied Science, Mannheim, Germany and ACEA Biosciences, San Diego, CA). The optimal seeding density was determined by cell titration experiments. Cells were automatically monitored every 15 min [Citation49].
Triglyceride measurement
Intracellular triglycerides were quantified using a triglyceride glycerol phosphate oxidase-paminophenazone (GPO-PAP) kit (Roche, Basel, Switzerland), as previously described [Citation50].
Immunofluorescence
Immunofluorescence microscopy was performed as previously described [Citation51]. Briefly, HepG2 control and macroH2A1 KD cells were washed with PBS and fixed with 4% paraformaldehyde for 10 min at room temperature. After fixation and further washes with PBS, the cells were stained with Oil Red O solution in 40% isopropanol. Coverslips were mounted on microscope slides with Vectashield mounting medium containing DAPI, and images were captured under a Nikon Eclipse E600 microscope (Nikon, Minato, Tokyo, Japan).
Immunoblotting
Histone protein extraction and immunoblotting analyses were performed as previously described [Citation14,Citation52]. The histone fraction was enriched by acid extraction and 2,2,2-trichloroacetic acid precipitation. Primary antibodies included macroH2A1, H3 (Active Motif, Carlsbad, CA), LXRα, LXRββ(Abcam, Cambridge, UK)βand a FAK Antibody Sampler Kit (#9330; Cell Signaling, Danvers, MA).
Metabolomics
Metabolic profiling was performed by mass spectrometry coupled to ultra-high performance liquid chromatography (UHPLC-MS). Cell pellets were resuspended in cold extraction solvents spiked with metabolites not detected in the unspiked cell extracts (internal standards) and incubated at −20°C for 1 h. The samples were then vortexed and centrifuged at 18,000 x g at 4°C for 5 min, and the supernatants were collected and incubated at 4°C while the cell pellets were again resuspended in cold extraction solvents and incubated for a further 1 h at −20°C. The samples were again vortexed and centrifuged at 18,000 x g at 4°C for 5 min and the supernatants were collected and pooled with the previous supernatant samples. The supernatants were then dried under vacuum, reconstituted in water and resuspended with agitation for 15 min before being centrifuged at 18,000 x g for 5 min at 4°C and transferred to vials for UHPLC-MS analysis. Two different types of quality control (QC) samples were used to assess the data quality: (i) a QC calibration sample to correct the different response factors between and within batches and (ii) a QC validation sample to assess how well the data pre-processing procedure improved data quality [Citation53]. Randomized sample injections were performed, with each of the QC calibration and validation extracts uniformly interspersed throughout the entire batch run. A specific UHPLC-MS method was used. The chromatographic separation and mass spectrometric conditions employed are summarized in .
Table 1. UHPLC-MS analysis methods.
Data pre-processing
All data were processed using the TargetLynx application manager for MassLynx 4.1 software (Waters Corp., Milford, CT). A set of predefined retention time mass-to-charge ratio pairs (Rtm/z) corresponding to metabolites included in the analysis were fed into the program. Associated extracted ion chromatograms (mass tolerance window = 0.05 Da) were then peak-detected and noise-reduced in both the LC and MS domains such that only true metabolite-related features were processed by the software. A list of chromatographic peak areas was generated for each sample injection. For identified metabolites, representative MS detection response curves were generated using an internal standard for each chemical class included in the analysis. By assuming similar detector response levels for all metabolites belonging to a given chemical class, a linear detection range could be defined for each variable. Maximum values were defined as those at which the detector response became non-linear with respect to the concentration of the representative internal standard.
Data normalization and quality control
Data normalization was performed as previously described [Citation54]. The ion intensities detected for each peak were normalized within each sample, to the sum of the peak intensities in that sample. There were no significant differences (P = 0.4358) between the total intensities used for normalization of the sample groups compared in the study. A total of 64 metabolites (listed in Table S1) involved in glycolysis, the pentose phosphate pathway (PPP) and the citric acid cycle, were detected in the analyzed cell samples and included in the subsequent univariate and multivariate data analyses (Table S1). Raw data per metabolite, raw data per chemical class, and heatmaps are available as Supplemental Data.
Gene expression
Total RNA was isolated from cells using TRIzol reagent (Invitrogen, Carlsbad, CA) and quantified on a NanoDrop 1000 spectrophotometer (Thermo Fisher Scientific, Waltham, MA); 100 ng to 1 mg RNA was used to prepare cDNA. Quantitative PCR was performed using SYBR Green (Sigma-Aldrich) in a LightCycler® Instrument (Roche). The ribosomal phosphoprotein P0 transcript was used as an internal control for normalization. Primer sequences were as follows: P0, Forward 5ʹ-CACCATTGAAATCCTGAGTGATGA-3ʹ, Reverse 5ʹ-TGACCAGCCCAAAGGAGAAG-3ʹ; Nanog, Forward 5ʹ-GTCTTCTGAGATGCCTCACA 3ʹ, Reverse 5ʹ-CTTCTG CGTCACACCATTGCTAT-3; Oct-4, Forward 5ʹ-GTTGATCCTCGGACCTGGCTA-3ʹ, Reverse 5ʹ-GGTTGCCTCTCACTCGGTTCT3ʹ; IHH, Forward 5ʹ-CATTGAGACTTGACTGGGCAAC-3ʹ, Reverse 5ʹAGAGCATGAGGCTGAGTTGGGAGTCGC-3ʹ; ABCG5, Forward 5ʹ-GGTCTCCTTTACCAGTTTGTGG-3ʹ, Reverse 5ʹ-ATATCCAAATCGGGCAACCT-3ʹ; ABCG8, Forward 5ʹ-AGAGACCTTGGCCTTCATTG-3ʹ, Reverse 5ʹ-GAAGCTGTCGAGCCAGA-3ʹ; APOF, Forward 5ʹ-CCAATTTCTGCACCCAAAGT-3ʹ, Reverse 5ʹ-TGACACGTTCCTCTCTGTGC-3ʹ; PON1, Forward 5ʹ- GCCTAATGGACTGGCTTTCA-3ʹ, Reverse 5ʹ- ACTTGGCATCTGGATGGTTC-3ʹ; CD36, Forward 5ʹ- TGCTGTATTTGAATCCGACGTT-3ʹ, Reverse 5ʹ- AAGGCCTTGGATGGAAGAACA-3ʹ.
RNA-sequencing (RNA-seq)
Total RNA was extracted from two biological replicates of control and macroH2A1 KD HepG2 cells with TRIzol Reagent (Invitrogen). Indexed libraries were prepared from 2 mg each purified RNA using a TruSeq Total Stranded RNA Sample Prep Kit (Illumina, Cambridge, UK) according to the manufacturer’s instructions. Libraries were quantified on an Agilent 2100 Bioanalyzer (Agilent Technologies) and pooled so that each index-tagged sample was present in equimolar amounts; the final concentration of the pooled samples was 2 nmol/L. Pooled samples were then subjected to cluster generation and sequenced on an Illumina HiSeq 2500 System (Illumina) in a 2 × 100 paired-end format at a final concentration of 8 pmol/L. Short reads were aligned against the hg19 genome assembly using STAR (ver. 2.6) with standard parameters, considering the genome features extracted from the UCSC RefSeq gtf file. Piled up reads were counted using the htseq-count tool. Counts were normalized (counts per million, CPM) and compared between the two contrasts (KD) and (control) using the edgeR R package (ver. 3.7). Data are available in Gene Expression Omnibus (GEO) with the accession number: GSE117459.
Hypoxia inducible factor (hifα) assay
Cells were cultured in 48-well plates (50,000 cells per well) in 21% O2 and 5% CO2 at 37°C for the 24 h. The cell medium was then replaced with media that had been pre-equilibrated to 1% O2 for at least 6 h. The cells were then transferred to a hypoxic C-chamber (BioSpherix, Parish, NY) with a Pro-Ox C21 controller attached to a carbon dioxide tank set at 5% CO2 and to a nitrogen tank set at 1% O2 for 24 h. The C-chamber was placed in a dry incubator set at 37°C. For normoxic conditions, cells were placed in a regular 37°C, 5% CO2 incubator for 24 h. The plates were then placed on ice and the cells were washed with cold PBS and resuspended in 50 µl RIPA lysis buffer (Merck) containing protease inhibitors and the samples were stored at −80°C until HIF-1α ELISA assay. HIF-1α levels were assayed using a Human/Mouse Total HIF-1 α DuoSet®IC ELISA (R&D Systems, Abingdon, UK).
Statistical and bioinformatics analysis
Univariate data analysis was performed by calculating the group percentage changes and unpaired Student’s t-test (or Welch´s t test where unequal variances were found) to compare control and macroH2A1 KD HepG2 cells. Dimensionality reduction and clustering of the metabolomics profiles was achieved by OPLS method [Citation25]. Results are expressed as the means ± S.E.M, unless indicated. Comparisons between groups were performed by parametric Student’s t-test or nonparametric Mann–Whitney U test, as appropriate. All computations were performed in R version 3.4.2 (R Development Core Team 2017) using the R package mixOmics (ver. 6.3.2, https://cran.r-project.org/web/packages/mixOmics/index.html). A P ≤ 0.05 was considered statistically significant. Functional and pathway enrichment analyses were performed using the Ingenuity Pathway Analysis (IPA, spring 2018 release, QIAGEN Inc., https://www.qiagenbioinformatics.com/products/ingenuity-pathway-analysis) software package on differentially expressed metabolites and genes. Metabolites exhibiting a significant fold-change (P < 0.05) were considered differentially expressed. Genes were considered differentially expressed between groups if their expression values significantly differed by > 2-folds and P ≤ 0.05.
Supplemental Material
Download Zip (133.8 KB)Acknowledgments
The authors would like to thank One Way Liver (OWL, Spain) for technical help with the metabolomics data analyses, and Insight Editing London for editing the manuscript.
Disclosure statement
No potential conflict of interest was reported by the authors.
supplementary material
Supplemental data for this article can be accessed here.
Additional information
Funding
Related Research Data
References
- Sheedfar F, Di Biase S, Koonen D, et al. Liver diseases and aging: friends or foes? Aging Cell. 2013;12:950–954.
- Gores GJ. Decade in review-hepatocellular carcinoma: HCC-subtypes, stratification and sorafenib. Nat Reviews Gastroenterol Hepatology. 2014;11:645–647.
- Oikawa T. Cancer Stem cells and their cellular origins in primary liver and biliary tract cancers. Hepatology. 2016;64:645–651.
- Reya T, Morrison SJ, Clarke MF, et al. Stem cells, cancer, and cancer stem cells. Nature. 2001;414:105–111.
- Yamashita T, Wang XW. Cancer stem cells in the development of liver cancer. J Clin Invest. 2013;123:1911–1918.
- Nio K, Yamashita T, Kaneko S. The evolving concept of liver cancer stem cells. Mol Cancer. 2017;16:4.
- Re O L, Fusilli C, Rappa F, et al. Induction of cancer cell stemness by depletion of macrohistone H2A1 in hepatocellular carcinoma. Hepatology. 2017 Sep 15. DOI:10.1002/hep.29519.
- Re O L, Histone MacroH2A1: VM. A chromatin point of intersection between fasting, senescence and cellular regeneration. Genes (Basel). 2017 Dec 5; 8(12). pii: E367. DOI:10.3390/genes8120367.
- Buschbeck M, Hake SB. Variants of core histones and their roles in cell fate decisions, development and cancer. Nat Rev Mol Cell Biol. 2017;18(5):299–314.
- Creppe C, Posavec M, Douet J, et al. MacroH2A in stem cells: a story beyond gene repression. Epigenomics. 2012;4:221–227.
- Cantarino N, Douet J, Buschbeck M. MacroH2A–an epigenetic regulator of cancer. Cancer Lett. 2013;336:247–252.
- Pasque V, Radzisheuskaya A, Gillich A, et al. Histone variant macroH2A marks embryonic differentiation in vivo and acts as an epigenetic barrier to induced pluripotency. J Cell Sci. 2012;125:6094–6104.
- Pliatska M, Kapasa M, Kokkalis A, et al. The histone variant macroh2a blocks cellular reprogramming by inhibiting mesenchymal-to-epithelial transition. Mol Cell Biol. 2018 Apr 30;38(10). pii: e00669-17. DOI:10.1128/MCB.00669-17.
- Borghesan M, Fusilli C, Rappa F, et al. DNA hypomethylation and histone variant macroh2a1 synergistically attenuate chemotherapy-induced senescence to promote hepatocellular carcinoma progression. Cancer Res. 2016;76:594–606.
- Jueliger S, Lyons J, Cannito S, et al. Efficacy and epigenetic interactions of novel DNA hypomethylating agent guadecitabine (SGI-110) in preclinical models of hepatocellular carcinoma. Epigenetics. 2016 Aug 11:1–12. [Epub ahead of print.]
- Douet J, Corujo D, Malinverni R, et al. MacroH2A histone variants maintain nuclear organization and heterochromatin architecture. J Cell Sci. 2017.
- Peiris-Pages M, Martinez-Outschoorn UE, Pestell RG, et al. Cancer stem cell metabolism. Breast Cancer Research: BCR. 2016;18:55.
- Sancho P, Barneda D, Heeschen C. Hallmarks of cancer stem cell metabolism. Br J Cancer. 2016;114:1305–1312.
- Vinciguerra M, Carrozzino F, Peyrou M, et al. Unsaturated fatty acids promote hepatoma proliferation and progression through downregulation of the tumor suppressor PTEN. J Hepatol. 2009;50:1132–1141.
- Vinciguerra M, Sgroi A, Veyrat-Durebex C, et al. Unsaturated fatty acids inhibit the expression of tumor suppressor phosphatase and tensin homolog (PTEN) via microRNA-21 up-regulation in hepatocytes. Hepatology. 2009;49:1176–1184.
- Gnani D, Romito I, Artuso S, et al. Focal adhesion kinase depletion reduces human hepatocellular carcinoma growth by repressing enhancer of zeste homolog 2. Cell Death Differ. 2017;24:889–902.
- Griffiths WJ, Karu K, Hornshaw M, et al. Metabolomics and metabolite profiling: past heroes and future developments. Eur J Mass Spectrom (Chichester). 2007;13:45–50.
- Burton L, Ivosev G, Tate S, et al. Instrumental and experimental effects in LC-MS-based metabolomics. J Chromatogr B Analyt Technol Biomed Life Sci. 2008;871:227–235.
- Barr J, Caballeria J, Martinez-Arranz I, et al. Obesity-dependent metabolic signatures associated with nonalcoholic fatty liver disease progression. J Proteome Res. 2012;11:2521–2532.
- Wiklund S, Johansson E, Sjostrom L, et al. Visualization of GC/TOF-MS-based metabolomics data for identification of biochemically interesting compounds using OPLS class models. Anal Chem. 2008;80:115–122.
- Flaveny CA, Griffett K, El-Gendy Bel D, et al. Broad anti-tumor activity of a small molecule that selectively targets the warburg effect and lipogenesis. Cancer Cell. 2015;28:42–56.
- Barrero MJ, Sese B, Kuebler B, et al. Macrohistone variants preserve cell identity by preventing the gain of H3K4me2 during reprogramming to pluripotency. Cell Rep. 2013;3:1005–1011.
- Creppe C, Janich P, Cantarino N, et al. MacroH2A1 regulates the balance between self-renewal and differentiation commitment in embryonic and adult stem cells. Mol Cell Biol. 2012;32:1442–1452.
- Gaspar-Maia A, Qadeer ZA, Hasson D, et al. MacroH2A histone variants act as a barrier upon reprogramming towards pluripotency. Nat Commun. 2013;4:1565.
- Liu Y, Dean DC. Tumor initiation via loss of cell contact inhibition versus Ras mutation: do all roads lead to EMT? Cell Cycle. 2010;9:897–900.
- Plaks V, Kong N, Werb Z. The cancer stem cell niche: how essential is the niche in regulating stemness of tumor cells? Cell Stem Cell. 2015;16:225–238.
- Mowers EE, Sharifi MN, Macleod KF. Functions of autophagy in the tumor microenvironment and cancer metastasis. FEBS J. 2018;285(10):1751–1766.
- Aguilar E, Marin De Mas I, Zodda E, et al. Metabolic reprogramming and dependencies associated with epithelial cancer stem cells independent of the epithelial-mesenchymal transition program. Stem Cells. 2016;34:1163–1176.
- Ito K, Suda T. Metabolic requirements for the maintenance of self-renewing stem cells. Nat Rev Mol Cell Biol. 2014;15:243–256.
- Kowalik MA, Columbano A, Perra A. Emerging role of the pentose phosphate pathway in hepatocellular carcinoma. Front Oncol. 2017;7:87.
- Kowalik MA, Guzzo G, Morandi A, et al. Metabolic reprogramming identifies the most aggressive lesions at early phases of hepatic carcinogenesis. Oncotarget. 2016;7:32375–32393.
- Yang M, Vousden KH. Serine and one-carbon metabolism in cancer. Nature Reviews Cancer. 2016;16:650–662.
- Tirinato L, Liberale C, Di Franco S, et al. Lipid droplets: a new player in colorectal cancer stem cells unveiled by spectroscopic imaging. Stem Cells. 2015;33:35–44.
- Pandey PR, Okuda H, Watabe M, et al. Resveratrol suppresses growth of cancer stem-like cells by inhibiting fatty acid synthase. Breast Cancer Res Treat. 2011;130:387–398.
- Li J, Condello S, Thomes-Pepin J, et al. Lipid desaturation is a metabolic marker and therapeutic target of ovarian cancer stem cells. Cell Stem Cell. 2017;20:303–14 e5.
- Noto A, De Vitis C, Pisanu ME, et al. Stearoyl-CoA-desaturase 1 regulates lung cancer stemness via stabilization and nuclear localization of YAP/TAZ. Oncogene. 2017;36:4671–4672.
- Mitra R, Chao O, Urasaki Y, et al. Detection of lipid-rich prostate circulating tumour cells with coherent anti-Stokes Raman scattering microscopy. BMC Cancer. 2012;12:540.
- Vitale I, Manic G, Dandrea V, et al. Role of autophagy in the maintenance and function of cancer stem cells. Int J Dev Biol. 2015;59:95–108.
- Farese RV Jr., Walther TC. Lipid droplets finally get a little R-E-S-P-E-C-T. Cell. 2009;139:855–860.
- Welte MA. Expanding roles for lipid droplets. Current Biology: CB. 2015;25:R470–81.
- Bechmann LP, Hannivoort RA, Gerken G, et al. The interaction of hepatic lipid and glucose metabolism in liver diseases. J Hepatol. 2012;56:952–964.
- Lin CY, Vedin LL, Steffensen KR. The emerging roles of liver X receptors and their ligands in cancer. Expert Opin Ther Targets. 2016;20:61–71.
- Steffensen KR. Are synthetic compounds that silence the liver-x-receptor the next generation of anti-cancer drugs? Cancer Cell. 2015;28:3–4.
- Tibullo D, Barbagallo I, Giallongo C, et al. Nuclear translocation of heme oxygenase-1 confers resistance to imatinib in chronic myeloid leukemia cells. Curr Pharm Des. 2013;19:2765–2770.
- Vinciguerra M, Veyrat-Durebex C, Moukil MA, et al. PTEN down-regulation by unsaturated fatty acids triggers hepatic steatosis via an NF-kappaBp65/mTOR-dependent mechanism. Gastroenterology. 2008;134:268–280.
- Pazienza V, Panebianco C, Rappa F, et al. Histone macroH2A1.2 promotes metabolic health and leanness by inhibiting adipogenesis. Epigenetics & Chromatin. 2016;9:45.
- Benegiamo G, Vinciguerra M, Mazzoccoli G, et al. DNA methyltransferases 1 and 3b expression in Huh-7 cells expressing HCV core protein of different genotypes. Dig Dis Sci. 2012;57:1598–1603.
- Martinez-Arranz I, Mayo R, Perez-Cormenzana M, et al. Enhancing metabolomics research through data mining. J Proteomics. 2015;127:275–288.
- Barr J, Vazquez-Chantada M, Alonso C, et al. Liquid chromatography-mass spectrometry-based parallel metabolic profiling of human and mouse model serum reveals putative biomarkers associated with the progression of nonalcoholic fatty liver disease. J Proteome Res. 2010;9:4501–4512.