
 ?Mathematical formulae have been encoded as MathML and are displayed in this HTML version using MathJax in order to improve their display. Uncheck the box to turn MathJax off. This feature requires Javascript. Click on a formula to zoom.
ABSTRACT
Interindividual variability of DNA methylation is a mechanism of the epigenetic drift in aging. Studies on cross-sectional data have discovered a change in methylation variability in association with age. However, thus far, no method explored DNA methylation variability in longitudinal data, which was the aim of this study. First, we performed a simulation study to explore methods for estimating methylation variability in longitudinal data. Second, an epigenome-wide association study (EWAS) on 1011 longitudinal samples (385 individuals followed up to 18 years) was performed to identify age-varying methylation sites using these methods. Following Breusch–Pagan test of heteroscedasticity, we showed that a linear regression model, where the residuals were used in a mixed effect model with a random intercept, properly estimated the change of interindividual variability over time. Our EWAS identified 570 CpG sites where methylation variability was significantly associated with age (P < 1.3 × 10⁻⁷). Gene regions of identified loci were enriched in nervous system development functions. In conclusion, we provide a method for analyzing methylation variability in longitudinal data and further identified age-varying methylation loci in a longitudinal analysis using these methods.
Background
DNA methylation levels change in individuals as we age. These longitudinal changes, due to genetic, environmental, and stochastic effects, are best explained by changes on average methylation levels, so called age-associated, or by changes on methylation variability between individuals, so called age-varying (). Many previous studies using DNA methylation data mainly focused on identifying age-associated differentially methylated positions [Citation1–Citation5]. However, studying age-varying methylation sites captures divergence of methylomes between individuals over time, usually described as epigenetic drift. Studies on epigenetic drift have been conducted using various methods, which include observing methylation differences between monozygotic twins [Citation6,Citation7], counting extreme methylation outliers as epigenetic mutations [Citation8] and computing methylation variability using a test of heteroskedasticity [Citation1,Citation9].
Figure 1. Simplified plots illustrating the concept of age-associated and age-varying methylation patterns. a) In age-associated methylation patterns, the average methylation level changes with age while the variability stays unchanged. b) In age-varying methylation patterns, the variance between individuals changes with age while the average methylation level does not change. c) In age-associated and age-varying methylation patterns, both average methylation level and between-subject variance change with age. Lines represent individual changes in methylation levels over time.
Nevertheless, most studies on epigenetic drift in relation to aging were based on cross-sectional data, while with longitudinal data we are able to follow changes of methylation patterns of individuals over time. Specifically, with longitudinal data we can monitor how the methylation variability of a certain group of people changes with age.
The Breusch–Pagan test [Citation10] for heteroscedasticity can be used to estimate the change of interindividual variability with age, but thus far applications on longitudinal data are missing. Here, we performed a simulation study to explore a proper method for estimating interindividual variability in association with age, and applied it to real longitudinal DNA methylation data.
Results
Model selection
We performed a simulation study to determine the most appropriate method to estimate the interindividual methylation variability in longitudinal data. The simulated longitudinal data, including 30 individuals and 5 follow-ups, were generated from a mixed model with a random intercept and slope. The individual intercepts and slopes were positively correlated so that the interindividual variance increased with age (See methods for details). We used the Breusch–Pagan test [Citation10] for heteroscedasticity and determined appropriate models to apply to longitudinal data (). The Breusch–Pagan test includes two steps: regressing out the independent variable and obtaining residuals from a regression model, and then regressing absolute residuals on the independent variable. In the first step, we tested a simple linear model (Model 1.1, )), a random intercept and slope model (Model 1.2, )), and a random intercept model (Model 1.3, )). Model 1.2 best fitted the data, but the residuals only captured intraindividual variability, which had a constant variance in the simulated data by design. Hence, absolute residuals were not associated with age ()). Moreover, residuals from Model 1.3 failed to capture interindividual variability, and only described the deviation of data points from the individual regression lines with an average slope ()). Instead, residuals from Model 1.1 illustrated the interindividual variability. The absolute residuals were then positively associated with age as expected (). In the second step, we tested the same three models, simple linear model (Model 2.1, )), random intercept and slope model (Model 2.2, )) and random intercept model (Model 2.3, )), to fit the association between absolute residuals from Model 1.1 and age. All three models gave similar estimates of effect sizes but different confidence intervals (). The high Akaike information criterion (AIC) suggested that Model 2.1 was not a good choice because the absolute residuals were correlated within individuals. Comparing results from the two mixed models, Model 2.2 had a lower AIC as it best described the association between the absolute residual and age. However, considering that the simulation data were ideal, Model 2.2 had a relatively high P value because the individuals close to the linear regression line in the first step had smaller absolute residuals and increased less with age. The effect sizes estimated for those individuals were much smaller and thus reduced the power of detecting the change of variability. As we aimed to perform regressions on an epigenome-wide analysis, Model 2.3 had enough power to identify the change of variability with age. Therefore, we concluded that performing a linear regression followed by a random intercept model was the best approach to measure the change of interindividual variability over time.
Table 1. The statistical results of the three regression models testing absolute residuals from a linear regression (Model 1.1).
Figure 2. Flowchart of the study design. The simulation study determined appropriate models in a two-step Breusch–Pagan test to measure variability of longitudinal data. The three different models (linear regression, mixed model with a random intercept and slope, mixed model with a random intercept) were tested for both steps. The optimized procedure was to use residuals from a linear regression to capture interindividual variability, and then to use a mixed model with a random intercept to fit absolute residuals from step one.
Figure 3. Models were run on simulated data to determine the best method for testing heteroscedasticity in longitudinal data. a) The simple linear model (Model 1.1) was applied on simulated data to generate absolute residuals that measured interindividual variability. The association between absolute residuals from the linear regression and age was further estimated by b) a simple linear regression (Model 2.1), c) a random intercept and slope model (Model 2.2), and d) a random intercept model (Model 2.3). e) Although the random intercept and slope model (Model 1.2) best fitted the simulated data. f) The absolute residuals from Model 1.2 captured intraindividual variability that did not change with age. g) The random intercept model (Model 1.3) was also tested for the simulated data. h) But absolute residuals from Model 1.3 were not associated with the age.
Longitudinal EWAS on variability
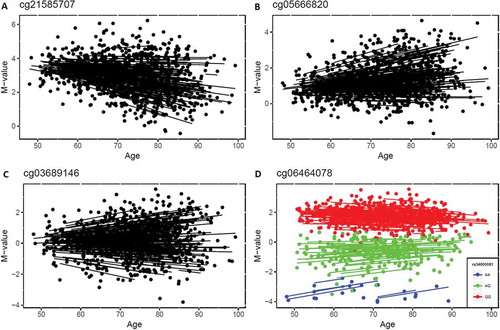
Next, we performed an epigenome-wide association study (EWAS) on real data to estimate the interindividual variability of DNA methylation and how that changed with age. Data were taken from the Swedish Adoption/Twin Study of Aging (SATSA), described previously [Citation7]. In brief, age and sex effects were regressed out from a linear regression and a random intercept model was fitted to the absolute residuals to estimate interindividual variability over time. The results showed that 90.4% of all CpG sites (n = 390,894) had positive effect sizes, indicating that their methylation variability increased with age. In total, 570 CpGs had methylation variability significantly changing with age using a Bonferroni corrected threshold (P < 1.3 × 10⁻⁷). Among them, the effect sizes of age were positive for all but two CpGs (Supplementary File 1). We further compared those CpGs to the 1316 age-associated CpGs identified earlier in this dataset [Citation7], and 7 CpGs were both age-associated and age-varying (two examples shown in ), but most were only age-varying CpGs (an example shown in ). Furthermore, 14 age-varying CpGs were associated with genetic variants (methylation quantitative trait loci, meQTL, which were identified in the same data described previously [Citation7]), including one (cg06464078) for which methylation variability decreased with age ()). The 570 age-varying CpGs were mapped to 246 genes based on Illumina manifest file (Supplementary File 1) and functional analysis of those genes in DAVID database [Citation11] indicated that the genes were enriched in the GO term ‘nervous system development’ (P = 1.9 × 10⁻⁵, FDR = 0.034).
Figure 4. Examples of significant age-varying CpG sites. a) The methylation levels of cg21585707 decreased with age while methylation variability increased with age. b) Both methylation level and methylation variability of cg05666820 increased with age. c) The methylation variability of cg03689146 increased with age but age-associated changes were not detected. d) The methylation variability of cg06464078 decreased with age, and was also identified as a methylation quantitative trait loci site (associated with a genetic variant).
Sensitivity analysis
We analyzed how the total follow-up time influenced the test of variability in a simulation study. We simulated three datasets with age ranges 20–100, 40–100, and 60–100 y, followed every 20, 15, and 10 y, respectively, while keeping other parameters the same. Each dataset was generated 100 times, with different seeds for random number generation, to statistically compare results. The test of variability indicated that the age-effect estimator of variability was the same for the three datasets, but that longer follow-up time rendered better power (Figure S1). The differences between t-values from the three datasets were statistically significant (P < 0.05).
Next, we investigated whether the number of measures and individuals influenced the test of variability. We generated four datasets: 1) 30 individuals with 5 measures; 2) 50 individuals with 3 measures; 3) 75 individuals with 2 measures; and 4) 75 individuals with 5 measures respectively. Again, each dataset was generated 100 times, with different seeds for random number generation. The age effect on variability from the four datasets stayed unchanged. The first three datasets included 150 samples each, and the third dataset, with 75 individuals and 2 measures, had the best power. Additionally, dataset 4, with 75 individuals and 5 measures, had the highest t-value, indicating that both the number of individuals and measurements can influence the test power (Figure S2). The differences between t-values from the four datasets were statistically significant (P < 0.05).
Finally, to test whether the change in variability with age was constant or not, we tested a quadratic effect of age in model 2.3 for the 570 age-varying CpGs. We identified 4 CpGs with a significant quadratic effect (P < 0.05; Figure S3). We also tested the sex effect and age-sex interaction on methylation variability for the 570 age-varying CpGs. Of these, 28 CpGs were significantly associated with sex (P < 0.05), where the variability in women was smaller than in men for 22 of those CpGs (Figure S4). In 42 CpGs, we found significant age-sex interactions (P < 0.05; Figure S5).
Discussion
We developed a method based on simulated data to estimate the variability of DNA methylation in longitudinal data, and used this method on real data that provided evidence for increasing interindividual methylation variability with time. We identified both age-associated and age-unrelated CpGs within the age-varying methylation sites. Moreover, we found that some of the age-varying CpGs were associated with genetic variants, indicating that genetic effects can influence methylation variability. Functional analysis identified enrichment of age-varying loci in nervous system development, implying that increasing variation of methylation patterns plays a role in brain aging.
When studying age-related changes in methylation variability, longitudinal data can be used to illustrate individual trends over time and to compute the change in interindividual variability. Hence, results from longitudinal data are more convincing since confounders such as genetic association and batch effects may be eliminated. The development of a method for analyzing methylation variability in longitudinal data that could provide evidence for successful implementation in real data, as done in this study, was therefore warranted.
A previous study on methylation variability, including 3295 cross-sectional samples with an age range of 10 to 90 y [Citation9], reported 6366 age-varying CpGs, including 218 of the 570 CpGs identified in our study. Their functional analysis also discovered enriched gene function in neuron development. Considering our study’s smaller sample size (1011 samples from 385 individuals) and narrower age range (48 to 99 y), the high replication rate suggests that our method was appropriate for measuring interindividual variability in longitudinal data.
Age-associated changes in methylation patterns are considered biomarkers of human aging [Citation12], thus the increasing dissimilarities of such patterns provide epigenetic evidence of different aging rates among individuals [Citation1]. However, in our study on individuals of old age, only a small proportion of the age-varying CpGs (7 out of 570) were also considered age-associated CpGs. In other words, we suggest that individual methylation levels deviate from the population mean, while the population mean stays unchanged. Similar results were reported previously by Slieker et al., where age-varying CpGs were distinct from age-associated CpGs [Citation9]. They further proposed that age-varying CpGs could play a role in cancer development, since those CpGs had greater variability in cancer tissues [Citation9]. However, studies are still required to prove whether there is a causal relationship between age-varying CpGs and cancer. Nevertheless, the function of DNA methylation in the pace of aging, where both mean methylation levels and methylation variability have a role, remains unclear.
Methods
Simulation study
We simulated data that included 30 individuals with 5 observations per person. The age at entry was normally distributed with a pre-defined mean age and standard deviation. The time interval between measures was constant and the same for every person. Various values for the age at entry and follow-up intervals were entered when generating the simulated datasets. Any sample over the age of 100 y was removed as they were not likely to be collected in real data. The dependent variable, simulated methylation level in M-values, was generated from a mixed model with a random slope and intercept:
where and
denote individuals and measures,
and
denote fixed intercept and slope,
and
denote random intercept and slope,
denotes random error. Since the random intercepts and slopes were positively correlated, the variance between individuals increased with age.
We tested three regression models for both steps in the Breusch–Pagan test [Citation10]: a linear model, a random intercept and slope model, and a random intercept model. The model equations are listed below, where and
denote fixed intercept and fixed slope,
and
denote random intercept and random slope,
and
denote regression residuals. The dependent variables in the second step were absolute residuals from Model 1.1, as they best captured interindividual variability.
Table
Methylation data
DNA methylation data were obtained from the Swedish Adoption/Twin Study of Aging (SATSA) as described previously [Citation7]. This study used 1011 longitudinal blood samples collected from 385 twins (60% female) at five time-points from 1992 to 2012. The age of baseline samples ranged from 49 to 94 y with a mean age of 69 y. The DNA collected from blood samples were bisulfite converted using EZ-96 DNA MagPrep methylation kit (Zymo Research Corp., Orange, CA) and methylation profiles were measured by Illumina HumanMethylation450 BeadChip (Illumina Inc., San Diego, CA).
The preprocessing of methylation data was performed using the R package RnBeads [Citation13]. The raw methylation data were normalized using ‘noob’ background correction [Citation14] in combination with ‘dasen’ normalization [Citation15]. Normalized data were then adjusted for cellular composition using the Houseman method [Citation16] and the Combat method [Citation17] was used to correct for batch effects.
EWAS on interindividual variability with age
The analysis of methylation variability was performed on each CpG using the two regression steps chosen from the simulation study. M-value, which is the Logit2 transformation of methylation fraction, was used in the test. First, we implemented a simple linear model (Equation 2) to regress out age and sex effects from methylation levels, and used the absolute residual from the model to measure the interindividual variability of DNA methylation. We then applied a random intercept model (Equation 3) to estimate the association between the absolute residuals and age. The effect size of age in the second regression indicated the change of methylation variance with age.
Ethics approvals
All participants in SATSA have provided written informed consents. This study was approved by the ethics committee at Karolinska Institutet with Dnr 2015/1729–31/5.
Supplemental Material
Download Zip (1.3 MB)Disclosure statement
No potential conflict of interest was reported by the authors.
Additional information
Funding
Related Research Data
References
- Hannum G, Guinney J, Zhao L, et al. Genome-wide methylation profiles reveal quantitative views of human aging rates. Mol Cell. 2013 Jan 24;49(2):359–367.
- Bell JT, Tsai P-C, Yang T-P, et al. Epigenome-wide scans identify differentially methylated regions for age and age-related phenotypes in a healthy ageing population. PLoS Genet. 2012 Apr 19;8(4):e1002629.
- Alisch RS, Barwick BG, Chopra P, et al. Age-associated DNA methylation in pediatric populations. Genome Res. 2012 Apr;22(4):623–632.
- Å J, Enroth S, Gyllensten U. Continuous aging of the human DNA methylome throughout the human lifespan. PLoS ONE. 2013 Jun 27;8(6). [ cited 2015 Mar 31]. Available from: http://www.ncbi.nlm.nih.gov/pmc/articles/PMC3695075/
- Florath I, Butterbach K, Muller H, et al. Cross-sectional and longitudinal changes in DNA methylation with age: an epigenome-wide analysis revealing over 60 novel age-associated CpG sites. Hum Mol Genet. 2014 Mar 1;23(5):1186–1201.
- Fraga MF, Ballestar E, Paz MF, et al. Epigenetic differences arise during the lifetime of monozygotic twins. Proc Natl Acad Sci. 2005 Jul 26;102(30):10604–10609.
- Wang Y, Karlsson R, Lampa E, et al. Epigenetic influences on aging: a longitudinal genome-wide methylation study in old Swedish twins. Epigenetics. 2017;29:226266.
- Aging | stochastic epigenetic mutations (DNA methylation) increase exponentially in human aging and correlate with X chromosome inactivation skewing in females full text [Internet]. [ cited 2017 May 4]. Available from: http://www.aging-us.com/article/100792/text
- Slieker RC, van Iterson M, Luijk R, et al. Age-related accrual of methylomic variability is linked to fundamental ageing mechanisms. Genome Biol. 2016 Sep 22;17(1):191.
- Breusch TS, Pagan AR. A simple test for heteroscedasticity and random coefficient variation. Econometrica. 1979;47(5):1287–1294.
- Huang DW, Sherman BT, Lempicki RA. Systematic and integrative analysis of large gene lists using DAVID bioinformatics resources. Nat Protoc. 2009;4(1):44–57.
- López-Otín C, Blasco MA, Partridge L, et al. The hallmarks of aging. Cell. 2013 Jun 6;153(6):1194–1217.
- Assenov Y, Müller F, Lutsik P, et al. Comprehensive analysis of DNA methylation data with RnBeads. Nat Methods. 2014 Nov;11(11):1138–1140.
- Triche TJ, Weisenberger DJ, Van Den Berg D, et al. Low-level processing of Illumina infinium DNA methylation beadarrays. Nucleic Acids Res. 2013 Apr;41(7):e90.
- Pidsley R, Wong CCY, Volta M, et al. A data-driven approach to preprocessing Illumina 450K methylation array data. BMC Genomics. 2013 May 1;14(1):293.
- Houseman EA, Accomando WP, Koestler DC, et al. DNA methylation arrays as surrogate measures of cell mixture distribution. BMC Bioinformatics. 2012 May 8;13(1):86.
- Leek JT, Johnson WE, Parker HS, et al. The sva package for removing batch effects and other unwanted variation in high-throughput experiments. Bioinformatics. 2012 Mar 15;28(6):882–883.