
 ?Mathematical formulae have been encoded as MathML and are displayed in this HTML version using MathJax in order to improve their display. Uncheck the box to turn MathJax off. This feature requires Javascript. Click on a formula to zoom.
ABSTRACT
Accounting for cellular heterogeneity is essential in neonatal epigenome-wide association studies (EWAS) performed on heterogeneous tissues, such as umbilical cord tissue (CT) or cord blood (CB). Using a reference-panel-based statistical approach, the cell type composition of heterogeneous tissues can be estimated by comparison of whole tissue DNA methylation profiles with cell type-specific DNA methylation signatures. Currently, there is no adequate DNA methylation reference panel for CT, and existing CB panels have been generated on lower coverage Infinium HumanMethylation450 arrays. In this study, we generate a reference panel for CT and improve available CB panels by using the higher coverage Infinium MethylationEPIC arrays. We performed DNA methylation profiling of 9 cell types isolated from CT and CB samples from 14 neonates. In addition to these cell types, we profiled DNA methylation of unfractionated CT and CB. Cell type composition of these unfractionated tissue samples, as estimated by our reference panels, was in agreement with that obtained by flow cytometry. Expectedly, DNA methylation profiles from CT and CB were distinct, reflecting their mesenchymal and hematopoietic stem cell origins. Variable CpGs from both unfractionated CT and its isolated cell types were more likely to be located in open seas and intronic regions than those in CB. Cell type specific CpGs in CT were enriched in intercellular matrix pathways, while those from CB were enriched in immune-related pathways. This study provides an open source reference panel for estimation and adjustment of cellular heterogeneity in CT and CB, and broadens the scope of tissue utilization assessed in future neonatal EWAS studies.
Introduction
DNA methylation plays a significant role in the epigenetic regulation of genes implicated in human development and disease, and is the most widely assessed epigenetic mark in clinical samples. In studies that seek to understand the developmental origins of health, epigenome-wide association studies (EWAS) conducted on neonatal tissues can provide insight into epigenetic changes associated with suboptimal intrauterine environment and its subsequent impact on early life outcomes.
Neonatal EWAS studies are typically conducted on birth tissues, such as umbilical cord, placenta and cord blood, due to the ease of access, and the biological relevance given their exposure to the intrauterine environment. However, these tissues are heterogeneous in their cell type composition [Citation1–Citation3], thereby making it challenging to differentiate between epigenetic variation due to changes in cell type composition, or from underlying biology independent of cell type composition. Hence, accounting for cellular heterogeneity in EWAS is essential to reduce such confounding and also improve the statistical power [Citation4]. There are currently three approaches used to mitigate the effects of cellular heterogeneity in EWAS. The first approach involves a direct measure of cell type proportions for each sample by cell-sorting, but this approach is extremely challenging to execute for large sample sizes, and impractical for frozen clinical samples. Second, and the most widely used approach requires the use of a reference panel assembled from DNA methylation profiles of the tissue’s constituent cell types [Citation5,Citation6]. When a reference panel is not available, the last approach is to use a reference-free method, but this approach is computationally intense and less accurate [Citation7–Citation11].
Recognizing the importance of birth tissues for neonatal EWAS, we set out to establish a joint examination of reference panels for both cord blood (CB) and cord tissue (CT) and make three key contributions. First, while infant CB reference panels are available [Citation12–Citation14], an adequate reference panel for infant CT has not yet been developed. We anticipate that the use of CT for DNA methylation profiling is complementary to that of CB, since these originate from a similar developmental timepoint, but are yet representative of different germinal origins and cell fates. Hence, the availability of an appropriate reference panel provides an opportunity for a more comprehensive epigenetic profiling of the birth tissues. Second, in the interpretation of neonatal EWAS, a key consideration is to examine if the variable CpGs are associated with the exposure/outcome of interest independent of cellular heterogeneity, as cellular heterogeneity may itself be a separate biological feature of the exposure. As a balance between CpG coverage and experimental cost considerations for EWAS, CpG arrays such as the Infinium BeadChips (Illumina®) are frequently used. Previously reported CB reference panels were generated using the Infinium HumanMethylation450 BeadChip arrays that cover ~ 480K CpGs [Citation15]; however, these arrays have recently been replaced by the next generation Infinium MethylationEPIC BeadChip arrays [Citation16], which provide ~ 2X genomic coverage. Thus, it is helpful to have an updated catalog of cell type-specific CpGs on the expanded array. Third, while we have previously reported a comparison between the DNA methylation profiles of whole CT and CB [Citation17], it was unclear how the constituent cell types of these tissues compare and contributed to these differences. Hence, here we generate a reference panel to deconvolute cell type constituents of both CB and CT. We also benchmark our reference panel by comparing cell type proportions as estimated from the panel with cell type proportions measured using flow cytometry on the same samples. Additionally, we compare the DNA methylation profiles of cell types isolated from both CT and CB, and catalog cell type-specific CpGs.
Results
Descriptive overview of samples
Fresh CT and CB samples were collected from 14 live singleton full-term births (Supplementary Figure A1, Supplementary Table A1). Pregnancies with complications (e.g. gestational diabetes, preeclampsia) were excluded. Ethnic distribution of subjects included 5 Chinese, 4 Malay, and 5 Indian, and majority (10 of the 14) of them were male. Isolation of cell types from freshly collected CT and CB was completed within 15 hours of delivery. From CT, the following 3 cell populations were isolated sequentially: stromal cells (CD90+), endothelial cells (CD31+), and epithelial cells (CD324+) (Supplementary Figure A2). It is likely that the stromal cell (CD90+) population contained subpopulations of mesenchymal stem cells (MSCs), fibroblasts, and smooth muscle cells, as it was technically challenging to further fractionate them due to their similar morphology and surface marker presentation. From CB, the following 6 populations were sorted: granulocytes (Gran), monocytes (Mono), B-cells, T-cells (CD8+), T-cells (CD4+), and Natural Killer (NK) cells (Supplementary Figure A2). In addition to the 9 isolated cell types (3 from CT and 6 from CB), we also examined 4 tissues: ‘USCS CT’ (unsorted single cell suspension prepared from freshly collected CT, prior to cell fractionation), ‘frozen whole CT’ (as typically available for clinical studies), ‘CB leukocytes’ (obtained following red blood cell lysis), as well as ‘CB buffy coat’ enriched in leukocytes and platelets (following centrifugation of CB collected in EDTA tubes).
We interrogated genome-wide DNA methylation profiles of these 9 cell populations and 4 tissue representations using the Infinium MethylationEPIC BeadChip. A total of 618,485 CpGs in 182 samples, including 6 technical replicates passed quality control filtering (Supplementary Figure A1, Supplementary Table A2). Technical replicates showed high concordance in DNA methylation values (Supplementary Figure A3), and the absolute difference in DNA methylation was within 5% for at least 94% of the CpGs. DNA methylation values from all samples showed a typical bimodal distribution, though samples derived from CB had a bigger proportion of CpGs with higher DNA methylation values (Supplementary Figures A4-A5).
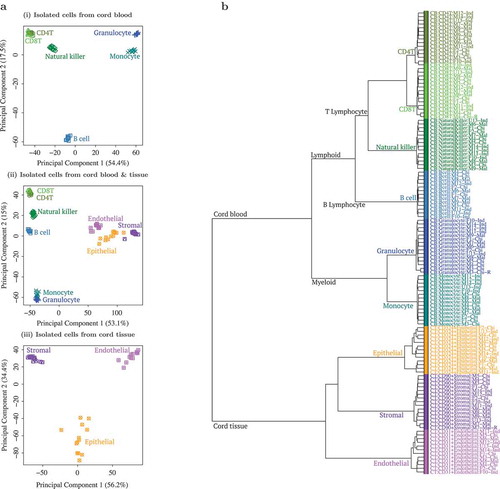
Hierarchical clustering and principal component analysis (PCA) showed distinct cell populations (), primarily clustered by tissue source (CB vs. CT). CB cell types further segregated into myeloid and lymphoid lineages, i.e. Granulocytes/Monocytes and B-cell/CD4+T/CD8+T/NK, while CT cells further segregated into 3 distinct clusters. When unfractionated CT and CB samples were included in the clustering analysis (Supplementary Figures A6-A7), both USCS and frozen CT samples clustered with the stromal cells, while CB buffy coat and leukocytes grouped with the myeloid cells, consistent with the known predominant cell types found in these tissues. Since technical replicates clustered tightly (Supplementary Figure A6), we chose to exclude them from subsequent analyses. The replicate that was excluded from subsequent analyses was randomly selected.
Figure 1. Principal component analysis (PCA) and hierarchical clustering showed clear distinction between cell types isolated from cord tissue (CT) and cord blood (CB).(a) First 2 principal components (PC) from PCA of genome-wide methylation profiles of (i) 6 cell type populations from CB, (ii) a combination of all 9 cell type populations and (iii) 3 cell type populations from CT. Three populations from CT are shown in purple/pink/orange and 6 populations from CB are shown in blue/green color tones. In (i) CB only PCA, first PC separated by myeloid vs. lymphoid hematopoietic stem cell linage (granulocyte/monocyte vs. B cell/CD4T/CD8T/natural killer (NK)), while the second PC separated B cells from the rest. In (ii) combined PCA, first PC separated by tissue (CB vs. CT) while second PC separated CB populations by myeloid vs. lymphoid hematopoietic stem cell linage (granulocyte/monocyte vs. B cell/CD4T/CD8T/NK). In (iii) CT only PCA, first PC separated the 3 distinct cell types (CD90+ stromal vs. CD324+ epithelial vs. CD31+ endothelial). (b) Dendrogram from hierarchical clustering of epigenome-wide DNA methylation profiles of 9 cell type populations isolated from CB and CT. Three populations from CT are shown in purple/pink/orange and 6 populations from CB are shown in blue/green. Cell type populations first clustered by tissue: CB vs. CT. CB populations further clustered by myeloid vs. lymphoid hematopoietic stem cell linage: granulocyte (Gran)/monocyte (Mono) vs. B cell/CD4T/CD8T/NK. CT populations further formed 3 distinct cell type clusters: CD90+ stromal vs. CD324+ epithelial vs. CD31+ endothelial.
Benchmarking the reference panel to capture cell type composition of CT
Neonatal EWAS analysis relies on the interindividual variation in the infant DNA methylome and its association with various phenotypes. The importance of cell type adjustment in these studies has arisen to identify interindividual variation in DNA methylation that is not driven by changes in the cell type composition. This adjustment of cellular heterogeneity reduces the confounding effects of cell type composition and increases statistical power by reducing unwanted interindividual variation due to cell type composition.
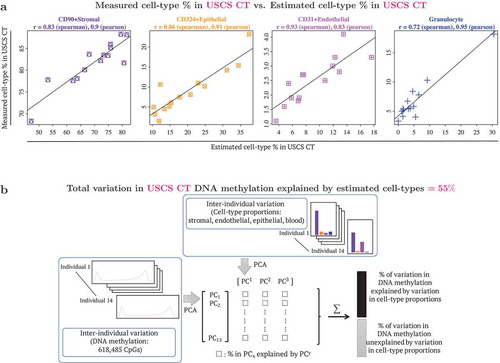
To benchmark the performance of our CT reference panel, two metrics were used. We first compared our reference panel estimates with flow cytometric measures to test its potential in determining the cell type composition in USCS CT (unsorted single cell suspension from cord tissue). The estimated and measured cell type percentages in USCS CT were very similar (), with correlations ranging from 0.72–0.93 (Spearman correlation) and 0.83–0.95 (Pearson correlation). We next quantified the interindividual variation in DNA methylation that could be attributed to cell type composition (). The estimated cell type composition accounted for 55% of the total DNA methylation variation observed in USCS CT samples, emphasizing the need for adjustment of cellular heterogeneity in EWAS in order to identify variation that is independent of cellular heterogeneity.
Figure 2. Benchmarking DNA methylation reference panel: use of reference panel to capture cell type composition in unsorted single cell suspension (USCS) cord tissue (CT). USCS CT refers to a sample of the single cell suspension of CT, that was obtained prior to the sequential isolation of stromal (CD90+), endothelial (CD31+) and epithelial (CD324+) cell types. (a) Scatterplots of cell type % measured in USCS infant CT (vertical axis) vs. estimated cell type % in USCS CT (horizontal axis). Cellular proportions were estimated using the reference panel in the current study following the method described by Houseman et al. (2012), where pairwise t-tests were used to identify 1000 cell type specific CpGs, by both P values and directionality of effect sizes (500 CpGs each). Granulocytes isolated from CB were included in the reference panel to capture CB contamination in CT. (b) Quantification of contribution of interindividual variation in cell type composition to interindividual variation in DNA methylation in CT. Additional details provided in the methods section.
Since frozen CT is more likely to be used than USCS CT in practice, we repeated the same set of analyses on frozen CT (Supplementary Figure B1). A correlation trend similar to USCS CT was observed between the reference panel estimates and flow cytometric measures, albeit with a weaker correlation (Spearman correlation range: 0.21–0.70, and Pearson correlation range: 0.33–0.86). This could potentially be attributed to the differences in sample processing between USCS and frozen CT. Nevertheless, we found the estimated cell type composition to still account for a large proportion (46%) of the total variation observed in genome-wide DNA methylation profiles of the frozen CT samples. The normalised root mean square error for comparing estimated and measured cellular proportions ranged from 1.72–7.04 for USCS CT and 1.41–13.24 for frozen CT (Supplementary Table B1).
We conducted additional sensitivity analyses where we varied the parameters in the algorithm to estimate cell type composition, such as disregarding directionality of effects in selecting cell type specific CpGs (Supplementary Figure B2), using the buffy coat fraction to capture CB contamination in CT (Supplementary Figure B3), and using fewer (Supplementary Figure B4) or more cell type specific CpGs (Supplementary Figure B5-7). Irrespective of the approach taken (Supplementary Figures B2-B7), the correlation between estimated and measured cell type percentages in USCS CT were very similar to those in ). For stromal cells the Spearman correlation was 0.83 in Supplementary Figures B2-B7 (vs. 0.83 in ), for epithelial cells the Spearman correlation was 0.82–0.87 in Supplementary Figures B2-B7 (vs. 0.86 in ), for endothelial cells the Spearman correlation was 0.92–0.93 in Supplementary Figures B2-B7 (vs. 0.93 in ), for blood the Spearman correlation was 0.72–0.76 (vs. 0.72 in ). Likewise, in frozen CT, similar correlations between estimated and measured cell type percentages were observed across the results reported in Supplementary Figures B1 to B7. For stromal cells the Spearman correlation ranged from 0.67 to 0.70, for epithelial cells the Spearman correlation ranged from 0.42 to 0.51, for endothelial cells the Spearman correlation ranged from 0.21 to 0.36, for blood the (absolute) Spearman correlation was less than 0.25. We also considered an additional analysis where we included only 3 cell types (stromal, endothelial and epithelial) on the reference panel and theoretically excluded CB contamination of CT. In this analysis (Supplementary Figure B8), the estimated cell type percentages of stromal and endothelial cells appear similar to before, but the cell type percentages previously attributed to CB appears to now be attributed to epithelial cells.
Benchmarking the reference panel to capture cell type composition of CB
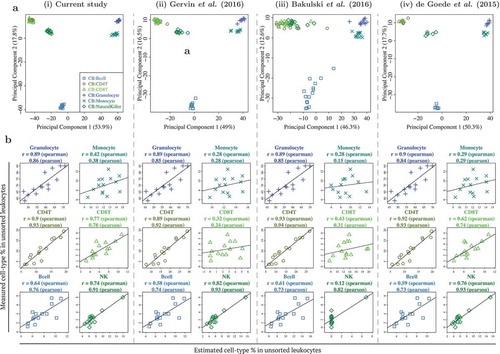
We next benchmarked the performance of our CB reference panel in capturing the cell type composition of CB. To achieve this, we compared the different cell types isolated from CB with those identified in 3 previously reported studies (). These reported CB datasets/reference panels by de Goede et al. (2015), Bakulski et al. (2016), and Gervin et al. (2016) were processed similar to the CB reference panel in the current study [Citation12–Citation14], except that they were generated on lower coverage DNA methylation arrays. We compared the 6 CB cell types that were common to all 4 datasets and performed a PCA on each dataset separately. Both the PCA plots and percentage variation explained by the first 2 PCs for all 4 datasets (including the current study), were very similar (PC1: 46–54% and PC2: 13–18%). We also estimated the different cell type percentages in our CB leukocytes samples by individually utilizing each of the 4 CB reference panels and comparing them with the actual flow cytometric measures. All 4 reference panels matched in their performance (). Specifically, across the 4 CB reference panels, for the 3 cell types with the highest measured cell type composition, the Spearman correlation between the measured and estimated cell type composition ranged from 0.89–0.90 for granulocytes, 0.28–0.42 for monocytes and 0.89–0.93 for CD4T cells. For the remainder cell types with lower measured cell type composition, the observed correlation across the 4 CB panels was similar for B-cells (Spearman correlation 0.58–0.64), but slightly more variable for CD8T cells (Spearman correlation 0.32–0.77) and NK cells (Spearman correlation 0.12–0.82). A similar analysis on buffy coat samples also yielded similar conclusions (Supplementary Figure C1). Using the reference panel in the current study, the normalised root mean square error for comparing estimated and measured cellular proportions ranged from 0.30–3.68 in CB leukocytes and 1.40–6.81 in buffy coat (Supplementary Tables C1-C2).
Figure 3. Benchmarking DNA methylation reference panel for unfractionated cord blood (CB) leukocytes: similar performance observed between CB reference panel in current study and 3 previously published/validated CB reference panels. (a) First 2 principal components from PCA of genome-wide DNA methylation profiles of 6 cell types from 4 independent CB reference panels, from (i) current study, (ii) Gervin et al. (2016), (iii) Bakulski et al. (2016), and (iv) de Goede et al. (2015). Note that )(i) is similar to Figure 3(i), but not identical, as the technical replicates were excluded in the latter. (b) Scatterplots of cell type % measured in unsorted leukocytes (vertical axis) vs. estimated cell type % in unsorted leukocytes (horizontal axis), using each of the 4 reference panels.
Comparison of cell types isolated from CT and CB
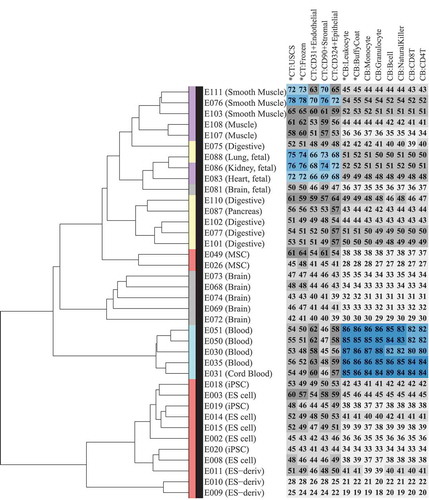
It is often extremely difficult to collect target tissues of interest in neonatal studies; hence, CT and CB are generally used as surrogate tissues for EWAS analysis. To develop a better understanding of the concordance between the DNA methylome of CT, CB, and their constituent cell types with the other cell types and tissues of the human body, we compared the DNA methylation profiles of 9 cell types and 4 tissues in the current study with 38 samples (Supplementary Table D1) profiled by Reduced Representation Bisulfite Sequencing (RRBS) under the Epigenome Roadmap project [Citation18]. We first performed a hierarchical clustering analysis of these 38 Epigenome Roadmap samples (, dendrogram). Consistent with the previous findings from the Roadmap project, we also found primary cells/tissues to predominantly cluster by their germinal origins or stem cell lineage, and embryonic stem cell (ES)-derived samples and primary cultures to form distinct clusters. We then calculated the correlation of 9 isolated cell types and the 4 tissue samples from CT and CB with these 38 Epigenome Roadmap samples (, heatmap). As expected, CB and its isolated cell types showed a strong correlation (Spearman correlation ≥ 0.8) with blood samples from the Epigenome Roadmap project. For CT and its isolated cell types, a moderate correlation (Spearman correlation 0.59–0.78) was observed with smooth muscle and fetal organs, such as heart, lung, and kidney, which are known to be of meso/endodermal origin.
Figure 4. Comparison of Epigenome Roadmap samples with unfractionated cord tissue (CT), cord blood (CB), and their constituent cell types.Heatmap (number and color) represents Spearman correlation between CT/CB samples in the current study and 38 samples profiled using reduced representation bisulfite sequencing (RRBS) under the Epigenome Roadmap project. Each column represents a distinct CT/CB cell or tissue-type. Each row represents a distinct cell/tissue sample from the Epigenome Roadmap project. Spearman correlation is represented on a 0–100 scale, and color in heatmap changes from grey to blue as correlation increases. Dendrogram shows hierarchical clustering of Epigenome Roadmap samples. Color in the dendrogram represents germinal origins of samples from the Epigenome Roadmap project. Primary tissues/cells of mesodermal (MSC-derived), mesodermal (HSC-derived), endodermal, and ectodermal germinal origins are represented in purple, turquoise, yellow and grey, respectively. Embryonic stem (ES) cell derived and primary culture samples are represented in red.
To accommodate additional cell types and also a different DNA methylation profiling platform, we repeated the same analysis with an additional set of 34 Epigenome Roadmap project samples (Supplementary Table D2) profiled using the whole-genome bisulfite sequencing (WGBS) (Supplementary Figure D1). CB samples showed strong to moderate correlation with Hematopoietic Stem Cells (HSC), thymus and spleen (Spearman correlation 0.72–0.84), while CT samples showed a relatively weaker association than RRBS samples, with the strongest correlation (Spearman correlation 0.69) found between CT epithelial cells and the Epigenome Roadmap epithelial cells grown in cell culture.
Comparison of interindividual variation in methylome of CT and CB, and their constituent cell types
We next characterised and compared the interindividual variation in DNA methylation profiles across 13 different CT and CB sample representations (9 isolated cell types and 4 unfractionated tissue samples). Ten of 14 subjects had DNA methylation profiled across all 13 samples, hence to ensure that differences in interindividual variation were not attributed to the missingness in the samples, we computed the interquartile range (IQR) in DNA methylation levels (%) only on the 10 subjects with full data (, left panel). Interindividual variation in DNA methylation was generally modest across all 9 isolated cell types from CB and CT, with more variation among CT cell types (median IQR: Endothelial 1.7%, Stromal 1.7%, Epithelial 2.1%) than CB cell types (median IQR ranged from 1.1% to 1.2%). Consistent with our earlier finding [Citation17], we found greater interindividual variation across whole CT samples (median IQR: 2.0%, 2.2% for USCS and frozen CT) than CB (median IQR: 1.4% and 1.6% for unsorted leukocytes and buffy coat).
Figure 5. Comparison of interindividual variation in unfractionated cord tissue (CT), cord blood (CB), and their constituent cell types: CT showed more variable CpGs than CB. (a) Distribution of DNA methylation inter-quartile ranges (IQR) in each cell type/tissue. Left panel shows density of CpGs on vertical axis and DNA methylation IQR on horizontal axis. Vertical axis on right panel gives the proportion of CpGs with DNA methylation IQR exceeding the specified value on horizontal axis. For each isolated cell type or unfractionated tissue, the IQR in DNA methylation was computed using 10 infants which had DNA methylation profiled across all 13 cell types/tissues. (b) CpG content distribution of CpGs that showed interindividual variation (IQR ≥ 5%) in each cell type/tissue. (c) Functional genomic distribution of CpGs that showed interindividual variation (IQR ≥ 5%) in each cell type/tissue.
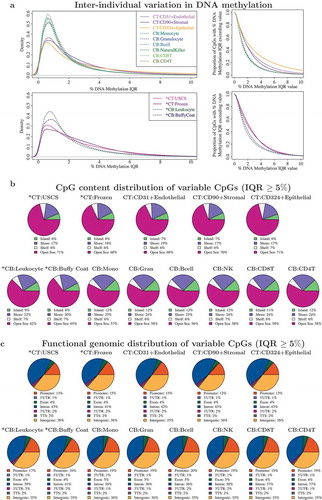
CpGs with a subtle interindividual variation in DNA methylation are not usually included in an EWAS analysis. To determine how the varying degrees of interindividual variation across the different sample types would impact the number of usable CpGs, QC-validated CpGs (618,485 CpGs) with DNA methylation IQR exceeding a range of values from 0% to 10% were computed for each cell population ( right panel, Supplementary Table D3). As CT cell types had a higher number of variable CpGs than CB cell types, an EWAS built on CT cell types would have more CpGs retained for analysis over a similarly designed CB counterpart. For example, of the 6 isolated CB cell types, 6.8–7.5% of the CpGs had DNA methylation IQR ≥ 5%, while in 3 cell types from CT, this criterion was met by 11–23% CpGs. Likewise, DNA methylation profiles of whole CT demonstrated a greater number of utilizable CpGs (14–16%) than CB (9–11%) for EWAS analysis requiring CpGs with IQR ≥ 5%. As we quantified interindividual variation in a small sample size (n = 10), we expect the overall proportion of useful CpGs to increase with increasing sample size, with a retained trend for CT to still have a higher proportion of variable CpGs than CB. We have also previously reported this observation from a comparison of whole CT and CB DNA methylation profiles from a larger cohort drawn from the same population [Citation17].
We also examined the CpG content distribution () and functional annotation ()) of variable CpGs using a minimum threshold of DNA methylation IQR ≥ 5% in each cell type and tissue. The CpG content distribution and functional genomic distribution of all tissues matched their corresponding cell populations, though the distributions were markedly different between CT and CB. Variable CpGs in CT and its cell types were more likely to be located in open seas/intronic regions, than those from CB.
Catalogue of cell type specific CpGs in neonate CT and CB
Finally, we catalogued all CpGs that were differentially methylated across different cell types isolated from CT and CB. For CT, we identified 260,765 cell type-specific CpGs at a Bonferroni threshold of 8 × 10⁻⁸, while for CB, we identified 215,937 cell type specific CpGs. As an exploratory analysis, we also examined whether the association between DNA methylation with CB cell types was ethnicity-dependent, by assessing the statistical significance of the interaction terms between cell types and ethnicity. For this exploratory analysis, only 133 CpGs in CB samples were found to be significantly associated at the Bonferroni threshold. We note that this analysis is based on a very small sample size and may be under-powered, subject to model overfitting, or is highly susceptible to outliers in DNA methylation value. When we examined the CpGs that were differentially methylated across different CB cell types, within each ethnic subgroup, there was a significant overlap (72.4 to 90.3%). We note that this overlap does not rule out the possibility that the magnitude or directionality of associations can differ between the different ethnic groups. Collectively, our exploratory analysis suggests that most of the associations between DNA methylation with CB cell types are not ethnicity-dependent, but due to the limited sample size, requires further study to confirm the finding.
Gene ontology was performed on the top 1000 cell type-specific CpGs to identify enriched gene networks. CT cell type-specific CpGs were enriched in pathways related to CT intercellular matrix (Supplementary Table E1), while CB cell type-specific CpGs were enriched in immune-related pathways (Supplementary Table E2). This catalogue of cell type-specific CpGs and the developed reference panel are provided as an R package (‘FlowSorted.CordTissueAndBlood.EPIC’). The raw DNA methylation data for the developed reference panel is provided as a RGChannelSet class and can be read and processed using the minfi R package [Citation19].
Discussion
In this study, we present a joint DNA methylation reference panel that can be used for deconvolution of cell types in both umbilical CT and CB samples. This reference panel comprises of 9 cell types isolated from CT and CB and is available as an open source R package. We benchmarked the performance of this reference panel in estimating cell type constituents of whole tissue samples from both CT and CB. The R package also contains a catalog of CpG sites that are differentially methylated across the different cell types.
Cell types within CT and CB had distinct DNA methylation profiles indicating the relevance of adjusting for cellular heterogeneity in neonatal EWAS. All cell types clustered by the tissue they were extracted from. Compared to CT, CB cell types contained more CpGs with higher DNA methylation values, but fewer CpGs with interindividual variation. Upon gene network analysis, cell type-specific CpGs from CT were enriched in pathways related to intercellular matrix, potentially reflecting the extensive extracellular matrix component of cord connective tissue, while cell type-specific CpGs from CB were enriched in immune-related pathways, as expected from a collection of white blood cell populations.
Cell types isolated from CT and CB are known to originate from different germinal origins. CB cell types originate from the mesoderm and are later differentiated within the hematopoietic lineage, while CT is formed with contributions from both extraembryonic ectoderm and mesoderm. CT epithelial cells are in continuum with the amniotic epithelium (ectoderm) [Citation20] and are distinct from CT endothelial and stromal cells, which share early mesodermal progenitors but are later derived separately from endothelial and mesenchymal stem cells, respectively [Citation20]. These hierarchical relationships were reinforced by the comparison with the Epigenome roadmap samples.
Our previous study on the choice of surrogate tissue for neonatal EWAS compared frozen CT with CB buffy coat and found higher interindividual variability in DNA methylation in CT than CB [Citation17]. However, in that study we were unable to conclusively exclude the possibility that this was due to cell type heterogeneity. The current study validates the earlier finding that differences in interindividual variability in DNA methylation exist between the two birth tissues, independent of the cell type heterogeneity, and also highlights their potential in being proxies to distinct target tissues and functional gene networks.
This study has a few limitations. First, we note that the use of CD90 antibody for isolation of a stromal cell population from umbilical cord tissue might limit the segregation of stromal cells into distinct sub-populations, such as MSCs, myo-fibroblast cells and smooth muscle cells, due to a significant overlap in their morphology and surface marker presentation [Citation20]. Additionally, it is well recognised that MSCs within CT can be heterogeneous due to their differences in pluripotency potential that may depend on sub-stromal localisation among other factors [Citation21]. However, these limitations are hard to overcome as in the field there seems to be no general consensus on the molecular markers that can be used to distinguish these sub-populations [Citation22]. The use of an epigenetic score has been previously proposed to distinguish MSCs from fibroblasts, and this is ascertained by the DNA methylation difference on 2 CpGs (cg22286764, C3orf35, and cg05684195, CIDEC) [Citation23]. The resulting beta score range from −1 to 1, where a positive value indicates MSCs, and negative indicates fibroblasts. When we applied this criterion to our CT stromal cells, 11 of 14 subjects had a score < 0, while the remaining 3 samples scored greater than but close to 0, suggesting that the predominant sub-population of cells in the stromal cell pool are fibroblasts (Supplementary Figure B9). Notably, the original scoring was constructed using DNA methylation levels of cultured fibroblasts and MSCs. We cannot exclude the potential differences arising in our study due to the use of primary cells. Additionally, the authors reported that only 12 of the 25 K CpGs considered showed large DNA methylation (> 40%) difference between cultured fibroblasts and MSCs, suggesting that MSCs and fibroblasts have considerable similarity in their DNA methylome. As such, we consider variation within the CT sub-stromal cell population to be relatively minor compared to variation due to the other 2 CT cell types (endothelial and epithelial). Second, we noted a higher correlation between measured/estimated cell types for USCS CT than for frozen CT. That may be due to the differences in sample processing between USCS and frozen CT, including the tissue dissociation process, which may have resulted in modifications in cell type proportions, or disruptions in DNA methylation levels. Nevertheless, this is a potential issue that may affect all tissue-based DNA methylation reference panels. Since the dissociation process itself is a necessary step in the elucidation of solid tissue types; thus, the concomitant limitations remain an interesting avenue for future research to mitigate. Third, we recognise that the purity of the isolated cell types in CB were not as high as a previously reported CB reference panel (66.3–97.5% in the current study vs. 97.1–98.8% [Citation14]). This could potentially be attributed to the slight differences in cell sorting methodologies, as well as the method used to calculate cell type purity [Citation24]. However, we note that this had minimal impact on the performance of our CB reference panel even when compared to other reported reference panels, possibly because the DNA methylation signatures of each CB cell type were sufficiently distinct. Fourth, the absence of nucleated red blood cells and hematopoietic stem cells is a limitation of our CB reference panel. Since the CB reference panel in this study was primarily generated for comparison and complementation to the CT reference panel, only major blood cell types were included and nucleated red blood cells or hematopoietic stem cells were excluded. Another reason for the exclusion of these cell types was their limited contribution to total cell number in a typical term infant CB buffy coat fraction [Citation25]. Nevertheless, for EWAS using whole CB instead of buffy coat, or examining preterm and/or post-term infants [Citation26,Citation27], using a reference panel that includes nucleated red blood cells may be preferable. Lastly, while we have provided a reference panel of cell type specific DNA methylation signatures that can be used for deconvolution of cell type proportions, we have not optimised (i.e. further refining the selection of cell type specific CpGs) this reference panel. The optimisation of the use of the reference panel is an important and crucial step in addressing cell type heterogeneity. To optimise the use of our reference panel for the deconvolution of cell type proportions, one can utilise independently collected DNA methylation samples and measured cell-proportions, and utilise an algorithm similar to that reported by Koestler et al. [Citation28].
In summary, we have demonstrated that cellular heterogeneity of CT contributes significantly to the interindividual variation in DNA methylation, as that previously observed for CB. Adjusting for cell type proportions can help reduce confounding and help identify interindividual variation in the epigenome independent of cellular heterogeneity. Our new CT reference panel and a higher CpG coverage CB panel can strengthen future neonatal EWAS, and broaden the choice of neonatal tissues in studying the influences of intrauterine environment.
Material and methods
Study population
Women 28–38 years of age with full-term, non-complicated, singleton pregnancies were recruited on admission to the delivery ward at the National University Hospital, Singapore (NUH). Umbilical CT and CB were obtained at delivery and stored at 4°C until lab processing. All offspring were of homogeneous parental ethnic background, but limited to Chinese, Malay, or Indian origin. Both vaginal and cesarean deliveries were included. Written informed consent was obtained from all subjects. The samples profiled and their sample characteristics are summarised in Supplementary Figure A1 and Supplementary Table A1. Ethical approval for this study was obtained from the NUH domain-specific review board (DSRB 2011/00355).
Tissue collection
Cord Blood
Before delivery of the placenta, the exposed umbilical cord is cleaned at the intended venepuncture site with isopropyl alcohol, and a needle used to initiate the blood collection. The needle and tubing form part of a sterile CB collection set with the blood collection bag containing CPD (citrate-phosphate-dextrose) anticoagulant (JMS Pte Ltd, Cord Blood Bag System). Although surface manipulation of the CT is typically performed with standard CB banking collections, minimal handling of the umbilical cord is emphasised in our protocol to reduce the loss of surface cells during the collection process. Approximately 20–40 mL of CB is collected. CPD is a preferred anticoagulant choice for CB collections, providing longer-term stability for blood cells compared to other anticoagulants such as EDTA. The sample is subsequently placed at 4°C until lab processing commences. In the lab, the CB sample is split into 3 aliquots – the first is used to obtain a buffy coat sample, while the subsequent two are used for cell type isolation. In the first aliquot, buffy coat samples containing the concentrated, combined leukocyte fraction are obtained by centrifugation at 800 x g for 15 mins at < 20°C, separating the CB sample into three distinct layers – an uppermost plasma/serum layer with platelet, a thin white buffy coat mid-layer containing enriched leukocytes, and a base layer containing red blood cells. As the buffy coat lies on top of the RBC layer, a typical clinical research buffy coat sample contains a combined pool of leukocytes, potentially with RBCs, including nucleated RBCs, albeit at a significantly reduced amount. Nevertheless, in healthy term infants, nucleated RBCs constitute about 0.1% of newborn circulating RBCs [Citation25]. As such, the overall contribution of nucleated RBCs to the total cell count in a term infant CB buffy coat sample is assumed to be relatively small. Buffy coats collected are immediately frozen and stored at −80°C until DNA extraction. A second preparation (‘Prep 2ʹ) of the full leukocyte population alone (‘unsorted leukocytes’) is prepared by lysis of RBCs. Briefly, 1X hypotonic RBC lysis buffer was added to whole blood, incubated for 5 min, and centrifuged at 500 x g, 5 min, 20°C. This process was repeated, and the sample then washed in 0.5% BSA, 2 mM EDTA PBS, before resuspension for cell isolation of granulocytes and monocytes. A third preparation (‘Prep 3ʹ) of CB underwent density gradient centrifugation with Lymphoprep (Cat. No.: 07851, Stem Cell Technologies, Canada). This process separates denser cells such as granulocytes from mononuclear cells (MNCs), the latter of which are retained just above the Lymphoprep layer. Mononuclear sub-type cells fractions (B, T, and NK cells) were later enriched from this.
Cord Tissue
Once the placenta has been fully delivered, a ~ 20–30 cm piece of umbilical cord is cut, rinsed, and stored in PBS. The CT sample is subsequently placed at 4°C until lab processing commences. In the lab, the umbilical cord vein was cannulated and perfused with sterile PBS to reduce the contribution of whole blood to the CT preparation. CT was then further cut into smaller pieces ~ 1 cm length, and any remaining blood clots manually removed. Fifteen grams of CT was weighed out and split equally into two gentleMACS C Tubes (Cat No: 130–093-237, Miltenyi Biotec, Germany), then further cut into smaller pieces with sterile scissors. Enzymatic digest of extracellular matrix proteins was then initiated (Enzyme blend, Umbilical Cord Dissociation Kit, Cat. No: 130–105-737, Miltenyi Biotec) and digestion performed at 37°C for 3 h. Thereafter, the tissue was further homogenised into a single cell suspension on the gentleMACS Dissociator (Cat. No: 130–093-235, Miltenyi Biotec). Immediately following, the cell suspension was strained through 100µm strainers as a final step for removal of cell clumps, in preparation of cell isolation and flow cytometry (Cat. No: 22–363-549, ThermoFisher Scientific). The resultant single cell suspension was washed and resuspended in 0.5% BSA, 2 mM EDTA PBS. Total cell counts were performed using the MACSQuant® Analyzer 9 (Miltenyi Biotec). A portion of cord cell suspension was stored directly at −80°C, and is referred to as ‘unsorted single cell suspension (USCS) CT’. Cell type isolations were performed on the remaining cells. Additional whole CT was snap-frozen in liquid nitrogen and stored as ‘frozen (whole) CT’.
Isolation of cell types from CT and CB
Cord Blood
Collection and isolation of cell types from both CT and CB were completed within 15 hours of delivery. A schematic illustrating the isolation of cell types is provided in Supplementary Figure A2. All subsequent cell type separations were performed by magnetic-activated cell separation (MACS) by using the QuadroMACS and OctoMACs systems (Cat 130–090-976 and 130–042-109, Miltenyi Biotec) and antibody-bound microbeads as per manufacturer’s instructions. All antibodies used for immunomagnetic separation and flow cytometry were obtained from Miltenyi Biotec.
Granulocytes (CD15+ Microbeads, Cat No: 130–046-601) and monocytes (CD14+ Microbeads, Cat No: 130–050-201) were isolated from the whole leukocyte pool (Prep 2 in ‘Cord Blood’ methods section above) in a sequential order, with the order of isolation intended to proceed in order of inherent cell proportion in whole blood. Using the MNC pool (Prep 3), NK cells were enriched by negative labeling and elimination of non-NK cell types using the NK Cell Isolation Kit (Cat 130–092-657). In parallel, a separate aliquot of the MNC pool (Prep 3) was used for B and T cell isolation in sequential order. After B cells were positively isolated with the CD19+ surface marker (CD19+ Microbeads, Cat No: 130–050-301), the flow-through was used to enrich further for T cells within the MNC pool, by negative labeling (Pan T Cell Isolation Kit, Cat. No: 130–096-535). This pan-T pool was then used for positive isolation of CD4+ and CD8+ T cells as 2 independent isolations (CD4+ microbeads, Cat No: 130–045-101, CD8+ microbeads, Cat No: 130–045-201). All cell fractions, including whole leukocyte and MNC pools, were verified by flow cytometry and stored at −80°C until DNA isolation.
Cord Tissue
Isolations were performed sequentially by magnetic-activated cell sorting to obtain the three main cell types present in CT. As stromal cells make up a large proportion of CT, we first isolated stromal cells using CD90+ microbeads (Cat. No: 130–096-253), with variable, extended column capture lengths to ensure that the purity of subsequent fractions is maximised. Next, endothelial cells were isolated using the CD31+ microbead kit (Cat. No: 130–091-935). The flow-through from the endothelial cell isolation was used for the subsequent isolation of epithelial cells. Microbeads used for the initial two isolations were directly conjugated to the antibody against the cell surface marker of interest. Because of the unavailability of directly conjugated microbeads for subsequent cell surface markers of interest, indirect capture was used instead. Following endothelial cell capture, we isolated epithelial cells using CD324-PE antibody (Cat. No: 130–095-413) and anti-PE microbeads (Cat. No: 130–048-801).
Quantification of tissue cell type percentages and verification of isolated cell fraction purities
Whole tissue cell type percentages (in unsorted leukocytes and USCS CT) and purities of isolated populations were quantified by flow cytometry using the MACSQuant® Analyzer 9. The following fluorescent-conjugated antibodies (all from Miltenyi Biotec) were used. For CB: CD3-PerCP (Cat No: 130–094-965), CD4-APC (Cat No: 130–091-232), CD8-PE (Cat. No: 130–104-130), CD14-APC (Cat. No: 130–091-243), CD15-FITC (Cat. No: 130–081-101), CD16-PE-Vio770 (Cat. No: 130–096-738), CD20-PE (Cat. No: 130–091-109), CD45-VioBlue (Cat. No: 130–092-880), CD56-APC (Cat. No: 130–090-843), CD235a-APC-Vio770 (Cat. No: 130–100-268). For CT: CD29-APC-Vio770 (Cat. No: 130–101-259), CD31-PE (Cat. No: 130–092-653), CD45-VioBlue (Cat. No: 130–092-880), CD73-APC (Cat. No: 130–095-183), CD90-PE-Vio770 (Cat. No: 130–099-295), CD151-PE (Cat. No: 130–103-662), CD151-APC (Cat. No: 130–103-663), CD235a-APC-Vio770 (Cat. No: 130–100-268), CD324-PE (Cat. No: 130–095-413). Preliminary flow cytometry data was analyzed by the MACSQuantify software (Cat. No: 130–094-556, Miltenyi Biotec), with final datasets prepared through FCS Express 6 (De Novo Software). Cell type percentages and purities of CB fractions were obtained by taking the CD45+ population as the total DNA-containing group and benchmarking each cell fraction percentage against it. For CT, the DNA-containing cell population was gated off an initial FSC/SSC plot, with subsequent positive gating using the cell surface marker for isolation, as well as additional verification antibodies for the CD90+ population – CD29-APC-Vio770 and CD73-APC-Vio770, as well as CD235a-APC-Vio770 for red blood cells. Unstained controls were used to ascertain background fluorescence, gatings were standardised across all samples for a given cell fraction. Where the surface marker for MACS-based cell isolation and subsequent flow cytometry coincide, identical antibody clones were used. Where fluorophores were overlapping, separate but equivalent aliquots of a cell sample were prepared – with up to 2 aliquots per cell sample and isolation phase. Cell purity and counts were evaluated at every stage before and after a specific antibody isolation, and antibody titers were adjusted in proportion to the volume and quantity of cells available.
DNA preparation
DNA was extracted from frozen samples with the AllPrep DNA/RNA/miRNA Universal Kit (Cat 80,224, Qiagen, Germany) following the manufacturer’s protocol. Following extraction, DNA purity and quantity were measured with a NanoDrop 8000 Spectrophotometer (ThermoFisher Scientific) and Qubit dsDNA BR Assay Kit (Cat. No: Q32850, ThermoFisher Scientific). DNA integrity was confirmed by agarose gel electrophoresis. Bisulfite conversion of genomic DNA was performed using the EZ DNA Methylation Kit (Cat. No: D5002, Zymo Research). Interrogation of genome-wide DNA methylation was performed using the Infinium MethylationEPIC BeadChip arrays following the manufacturer’s protocol. As part of experimental design, samples were randomised across plate, chip and chip position. Technical replicates were included to assess technical variation.
DNA methylation data pre-processing
DNA methylation IDAT files were processed in R using the minfi package [Citation19]. Probes with fewer than three beads for either the methylated or unmethylated channel, or with detection P value ≥ 0.01 were removed. Probes on sex chromosomes, cross-hybridising probes [Citation29], and probes with SNPs at the CpG site or its single-base extension were excluded. The number of CpGs excluded at each step is summarised in Supplementary Table A2. Following Bakulski et al. (2016) [Citation13], within-sample normalisation was performed using Noob pre-processing [Citation30], but between-sample normalisation was not performed as global changes in DNA methylation distribution could arise due to cell type differences. Although isolation of cell types and DNA methylation profiling were attempted on all CT and CB samples collected from all 14 infants, some samples yielded either insufficient genomic DNA (2 CB buffy coat samples) and/or low purity (3 CT cell type samples and 1 CB cell type sample) and were hence excluded from the analyses. The samples excluded and the number of cell types successfully profiled from each sample are summarised in Supplementary Figure A1. After quality control filtering, 618,485 CpGs in 182 samples, including 6 technical replicates, were available for analysis. These 6 technical replicates were from different samples and cell types (pairwise replicates) and are summarised in Supplementary Figure A1.
Statistical analyses
(i) Descriptive overview of data
First, to evaluate data quality and assess technical variation, we compared DNA methylation values from technical replicates by using scatterplots, correlation, and quantification of the absolute difference in DNA methylation values between technical replicates. Four sets of correlation were computed: (i) Spearman correlation excluding extremes (CpGs where DNA methylation < 20% or > 80% in both samples) or (ii) Spearman correlation using all CpGs or (iii) mean-centered Pearson correlation excluding extremes (CpGs where DNA methylation < 20% or > 80% in both samples) or (iv) mean-centered Pearson correlation using all CpGs. For the mean-centered Pearson correlation, for each CpG, the mean of the CpG across all samples of the specific cell type/tissue was subtracted from the observed DNA methylation value, before computing the Pearson correlation [Citation31]. Second, we examined the global DNA methylation distribution for each infant across 4 tissues and 9 isolated cell types. Third, we performed 4 sets of PCA and hierarchical clustering: (i) cell type populations isolated from CB; (ii) cell type populations isolated from CT; (iii) cell type populations isolated from both CT and CB; (iv) cell type populations isolated from both CT and CB and unfractionated CT and CB. The clustering analysis was performed using Euclidean distance and Ward clustering criterion on all CpGs that passed quality control filtering.
(ii) Benchmarking of reference panel in USCS/frozen CT
To benchmark our reference set in USCS CT, two metrics were used. First, we compared cell type proportions estimated using our reference panel with cell type proportions measured by flow sorting USCS CT. Spearman/Pearson correlations, scatterplots and normalised root mean square error, were used to compare the estimated and measured cellular proportions. Cellular proportions were estimated following the method described by Houseman et al. (2012) [Citation5]. Pairwise t-tests were used to identify 1000 cell type-specific CpGs that best distinguished each cell type from the remainder cell populations. Cell type-specific CpGs were selected based on both P values and directionality of effect. Second, we quantified the percentage of interindividual variation in DNA methylation of the USCS CT samples that could be attributed to the estimated cell type composition. We performed a PCA on the DNA methylation of n = 14 USCS CT samples. Let the first n-1 = 14–1 = 13 PCs be PC1, PC2, …, PC13 and the proportion of variance explained by them be w1, w2, …, w13, where w1> w2> … > w13 and w1+ w2+…+ w13 = 100% (i.e. the total variance in the USCS CT DNA methylation that can explained by the 13 PCs sum to 100%). We performed a similar PCA using the k estimated cell type percentages giving k-1 PCs: CT1, …, CTk-1. We then performed (n-1)*(k-1) linear regressions and calculated the model R-squared from each of these regressions. The total variance in the DNA methylation that can be explained by estimated cell type composition was calculated as wj R-squaredij, where R-squaredij is the model R-squared from regressing PCj (dependent variable) against CTi (independent variable). We note that the two sets of PCA analysis are performed on ‘different datasets’. The first PCA is a dimension reduction of DNA methylation data (14 samples in 618, 485 CpGs) into 13 principal components (we have 13 principal components because we only have 14 samples). The second PCA is performed on the cell type percentages (14 samples in 4 cell type proportions for cord tissue giving 3 principal components). Benchmarking of frozen CT was performed similar to the USCS CT mentioned above. However, since it is not feasible to isolate cells from frozen tissue for flow cytometry, we instead used the cell type measures from USCS CT for this analysis.
(iii) Benchmarking of reference panel for unsorted leukocytes and buffy coat from CB
To benchmark the reference panel for CB, we compared cell type proportions measured from unsorted leukocytes by flow cytometry with cellular proportions estimated using our and 3 previously published reference panels [Citation12–Citation14], 2 of which were previously benchmarked [Citation14,Citation32]. As described before, cellular proportions were estimated following the method described by Houseman et al. (2012) [Citation5], where pairwise t-tests were used to identify 1000 cell type specific CpGs that best distinguished each cell type from the remainder cell populations. Following the approach taken by Bakulski et al. (2016), cell type informative CpGs were selected solely by P values [Citation13]. We processed all 3 published datasets similarly to ours, with similar quality control filters and Noob normalisation of DNA methylation values. All 3 datasets contained reference DNA methylation profiles for granulocytes, monocytes, natural killer cells, B cells, CD4+ T cells, and CD8+ T cells, but only the reference panel for de Goede et al. (2015) and Bakulski et al. (2016) contained DNA methylation profiles for nucleated red blood cells. For a fair comparison, only 6 cell type populations that were profiled across all 4 studies were included. Spearman/Pearson correlations, scatterplots, and normalised root mean square error, were used to compare the estimated and measured cellular proportions. We further performed PCA on all three CB datasets separately and visually compared the PCA results. We conducted similar analyses to benchmark the performance of the reference panel for CB buffy coat. However, since cell type composition was not measured from buffy coat, we compared the estimated cell type composition with those measured from unsorted leukocytes.
(iv) Comparison of cell types isolated from CT and CB
To compare the DNA methylation profiles of cell types in CT and CB with other tissues/cells, we computed the Spearman correlation between each CT/CB cell type/tissue and those profiled under Epigenome Roadmap project [Citation18]. For each CT/CB cell type/tissue, the median value across all samples was calculated for each CpG. We also performed 2 sets of hierarchical clustering analysis: (i) 38 Epigenome Roadmap samples profiled using the Reduced Representation Bisulfite Sequencing (RRBS) and (ii) 34 Epigenome Roadmap samples profiled using the whole-genome bisulfite sequencing (WGBS). The clustering analysis was performed using Euclidean distance and Ward clustering criterion. For data generated by the Epigenome Roadmap project, we excluded the samples that had high missingness for CpGs covered on the Infinium MethylationEPIC array. To ensure high data quality, we retained only reads with ≥ 30X reads coverage. We also combined the reads from both the strands. The Infinium MethylationEPIC DNA methylation dataset in this study was compared with the Epigenome Roadmap RRBS data by exact matching of chromosome position. Similarly, the DNA methylation dataset in this study was compared with the Epigenome Roadmap WGBS data by exact matching of chromosome position. Comparison was not performed between Epigenome Roadmap RRBS and WGBS datasets. We applied the following CpG filtering criteria sequentially: CpG sites that were non-missing in at least 10 out of the Epigenome Roadmap samples (806,120 CpGs for WGBS, 70,333 CpGs for RRBS), had interquartile range > 15% across different Epigenome Roadmap tissues/cells (262,496 CpGs for WGBS, 12,733 CpGs for RRBS) and that overlapped with the 618,485 CpGs that passed quality control in our Infinium MethylationEPIC dataset (192,950 CpGs for WGBS and 9,390 CpGs for RRBS). These 192,950 CpGs (merged DNA methylation dataset in the current study and Epigenome Roadmap WGBS data) and 9,390 CpGs (merged DNA methylation dataset in the current study and Epigenome Roadmap RRBS data) were used to compute the correlation between samples in this study and samples from the Epigenome Roadmap project, and for performing the above two sets of hierarchical clustering analysis.
For each of the 618,485 CpGs that passed quality control filtering in CB and CT samples, interindividual variation was quantified using the interquartile range (IQR) in DNA methylation levels (%). Ten out of 14 infants had DNA methylation profiled across all 13 cell types/tissues. To ensure that differences in interindividual variation were not due to the different number of samples profiled, for each cell type/tissue and each CpG, the interquartile range (IQR) in DNA methylation was computed using these 10 infants. We examined both the density of the DNA methylation IQR as well as the proportion of CpGs (out of 618,485 CpGs) with DNA methylation IQR exceeding a pre-specified value. We further examined the variable CpGs (with DNA methylation IQR ≥ 5%) in terms of their genomic features (promoter, 5ʹ-UTR, exon, intron, 3ʹ-UTR, TTS, and intergenic) and CpG content (island, shores, shelves, open seas). Genomic features of the CpGs were annotated using Homer annotatePeaks function (hg19) [Citation33].
(v) Catalogue of cell type specific CpGs in CT and CB
We used F-tests to catalog all the CpGs that were differentially methylated across different cell types, for each tissue separately. For each tissue, cell type specific CpGs were identified using a Bonferroni threshold of 0.05/618,485 = 8 × 10⁻⁸. As an exploratory analysis, we also examined whether the association between DNA methylation and cell types was ethnicity-dependent. This was done by assessing the statistical significance of the interaction terms between cell types and ethnicity. This exploratory analysis was performed only for CB, but not CT, because for CT, we only had DNA methylation profiles for endothelial cells for 2 of the Malay ethnic group samples. We also performed a subgroup analysis, where we conducted F-tests to catalog all the CpGs that were differentially methylated across different CB cell types, for each of the three ethnic subgroups, and compared the overlap in the CpGs that were significantly associated in each ethnic subgroup. A KEGG enrichment analysis was performed for the top 1000 cell type-specific CpGs (smallest p-values), using an adapted GOseq procedure implemented in the missMethyl R package that accounts for the non-random selection/number of probes of each gene represented on the array [Citation34]. We report pathways significant at false discovery rate of 0.01 and with number of genes in the KEGG pathway not exceeding 150.
Supplemental Material
Download PDF (4.6 MB)Disclosure statement
YSC has received reimbursement for speaking at conferences sponsored by companies selling nutritional products. He is part of an academic consortium that has received research funding from Abbott Nutrition, Nestec and Danone. The other authors declare no competing interests.
Supplementary material
Supplementary data for this article can be accessed here.
Additional information
Funding
Related Research Data
References
- Consortium EP. An integrated encyclopedia of DNA elements in the human genome. Nature. 2012;489:57–74.
- Lister R, Pelizzola M, Dowen RH, et al. Human DNA methylomes at base resolution show widespread epigenomic differences. Nature. 2009;462:315–322.
- Meissner A, Mikkelsen TS, Gu H, et al. Genome-scale DNA methylation maps of pluripotent and differentiated cells. Nature. 2008;454:766–770.
- Jaffe AE, Ra I. Accounting for cellular heterogeneity is critical in epigenome-wide association studies. Genome Biol. 2014;15:R31.
- Houseman EA, Accomando WP, Koestler DC, et al. DNA methylation arrays as surrogate measures of cell mixture distribution. BMC Bioinformatics. 2012;13:86.
- Guintivano J, Aryee MJ, Za K. A cell epigenotype specific model for the correction of brain cellular heterogeneity bias and its application to age, brain region and major depression. Epigenetics. 2013;8:290–302.
- Houseman EA, Molitor J, Cj M. Reference-free cell mixture adjustments in analysis of DNA methylation data. Bioinformatics. 2014;30:1431–1439.
- Zou J, Lippert C, Heckerman D, et al. Epigenome-wide association studies without the need for cell-type composition. Nat Meth. 2014;11:309–311.
- Leek JT, Jd S. Capturing heterogeneity in gene expression studies by surrogate variable analysis. PLoS Genet. 2007;3:1724–1735.
- Teschendorff AE, Zhuang J, Widschwendter M. Independent surrogate variable analysis to deconvolve confounding factors in large-scale microarray profiling studies. Bioinformatics. 2011;27:1496–1505.
- McGregor K, Bernatsky S, Colmegna I, et al. An evaluation of methods correcting for cell-type heterogeneity in DNA methylation studies. Genome Biol. 2016;17:84.
- de Goede OM, Razzaghian HR, Price EM, et al. Nucleated red blood cells impact DNA methylation and expression analyses of cord blood hematopoietic cells. Clin Epigenetics. 2015;7:95.
- Bakulski KM, Feinberg JI, Andrews SV, et al. DNA methylation of cord blood cell types: applications for mixed cell birth studies. Epigenetics. 2016;11::354–362.
- Gervin K, Page CM, Aass HC, et al. Cell type specific DNA methylation in cord blood: a 450K-reference data set and cell count-based validation of estimated cell type composition. Epigenetics. 2016;11:690–698.
- Bibikova M, Barnes B, Tsan C, et al. High density DNA methylation array with single CpG site resolution. Genomics. 2011;98:288–295.
- Moran S, Arribas C, Esteller M. Validation of a DNA methylation microarray for 850,000 CpG sites of the human genome enriched in enhancer sequences. Epigenomics. 2016;8:389–399.
- Lin X, Teh AL, Chen L, et al. Choice of surrogate tissue influences neonatal EWAS findings. BMC Med. 2017;15:211.
- Roadmap Epigenomics C, Kundaje A, Meuleman W, et al. Integrative analysis of 111 reference human epigenomes. Nature. 2015;518:317–330.
- Aryee MJ, Jaffe AE, Corrada-Bravo H, et al. Minfi: a flexible and comprehensive Bioconductor package for the analysis of Infinium DNA methylation microarrays. Bioinformatics. 2014;30:1363–1369.
- Corrao S, La Rocca G, Lo Iacono M, et al. Umbilical cord revisited: from Wharton’s jelly myofibroblasts to mesenchymal stem cells. Histol Histopathol. 2013;28:1235–1244.
- Nanaev AK, Kohnen G, Milovanov AP, et al. Stromal differentiation and architecture of the human umbilical cord. Placenta. 1997;18:53–64.
- Hematti P. Mesenchymal stromal cells and fibroblasts: a case of mistaken identity? Cytotherapy. 2012;14:516–521.
- de Almeida DC, Ferreira MR, Franzen J, et al. Epigenetic classification of human mesenchymal stromal cells. Stem Cell Reports. 2016;6:168–175.
- Basu S, Campbell HM, Dittel BN, et al. Purification of specific cell population by fluorescence activated cell sorting (FACS). J Vis Exp. 2010.
- Hermansen MC. Nucleated red blood cells in the fetus and newborn. Arch Dis Child Fetal Neonatal Ed. 2001;84:F211–215.
- Axt R, Ertan K, Hendrik J, et al. Nucleated red blood cells in cord blood of singleton term and post-term neonates. J Perinat Med. 1999;27:376–381.
- Green DW, Hendon B, Fb M. Nucleated erythrocytes and intraventricular hemorrhage in preterm neonates. Pediatrics. 1995;96:475–478.
- Koestler DC, Jones MJ, Usset J, et al. Improving cell mixture deconvolution by identifying optimal DNA methylation libraries (IDOL). BMC Bioinformatics. 2016;17:120.
- McCartney DL, Walker RM, Morris SW, et al. Identification of polymorphic and off-target probe binding sites on the Illumina Infinium methylation EPIC beadchip. Genom Data. 2016;9:22–24.
- Triche TJ Jr., Weisenberger DJ, Van Den Berg D, et al. Low-level processing of Illumina Infinium DNA methylation beadarrays. Nucleic Acids Res. 2013;41:e90.
- Xu Z, Niu L, Li L, et al. ENmix: a novel background correction method for Illumina HumanMethylation450 beadchip. Nucleic Acids Res. 2016;44:e20.
- Cardenas A, Allard C, Doyon M, et al. Validation of a DNA methylation reference panel for the estimation of nucleated cells types in cord blood. Epigenetics. 2016;11:773–779.
- Heinz S, Benner C, Spann N, et al. Simple combinations of lineage-determining transcription factors prime cis-regulatory elements required for macrophage and B cell identities. Mol Cell. 2010;38:576–589.
- Phipson B, Maksimovic J, Oshlack A. missMethyl: an R package for analyzing data from Illumina’s HumanMethylation450 platform. Bioinformatics. 2016;32:286–288.