
ABSTRACT
Suboptimal environmental conditions during development can substantially alter the epigenome. Stable environmentally-induced changes to the germline epigenome, in particular, have important implications for the health of the next generation. We showed previously that developmental vitamin D depletion (DVD) resulted in loss of DNA methylation at several imprinted loci over two generations. Here, we assessed the impact of DVD on genome-wide methylation in mouse sperm in order to characterize the number, extent and distribution of methylation changes in response to DVD and to find genes that may be susceptible to this prevalent environmental perturbation. We detected 15,827 loci that were differentially methylated in DVD mouse sperm vs. controls. Most epimutations (69%) were loss of methylation, and the extent of methylation change and number of CpGs affected in a region were associated with genic location and baseline methylation state. Methylation response to DVD at validated loci was only detected in offspring that exhibited a phenotypic response to DVD (increased body and testes weight) suggesting the two types of responses are linked, though a causal relationship is unclear. Epimutations localized to regions enriched for developmental and metabolic genes and pathway analyses showed enrichment for Cadherin, Wnt, PDGF and Integrin signaling pathways. These findings show for the first time that vitamin D status during development leads to substantial DNA methylation changes across the sperm genome and that locus susceptibility is linked to genomic and epigenomic context.
Introduction
Vitamin D is mostly known for its roles in regulating calcium homeostasis and bone mineralization [Citation1,Citation2], but emerging evidence shows it also has important roles in fetal growth, immunity, mental health, cardiovascular health and reproduction [Citation3–Citation6]. The role of vitamin D in regulating epigenetic mechanisms has recently been proposed as a link to health outcomes [Citation7] but studies demonstrating epigenetic responsiveness to vitamin D status remain limited. Clinical studies using leukocytes have shown a positive relationship between levels of basal 25-hydroxyvitamin D (25(OH)D) and global DNA methylation, and dietary vitamin D supplementation has been shown to increase global methylation in a dose-dependent manner [Citation8,Citation9]. Cell culture experiments implicate vitamin D in regulating chromatin, with the vitamin D receptor (VDR) shown to associate with repressive chromatin remodelers NCoR1, SMRT/NCoR2, and HDACs when not bound to the active vitamin D metabolite, 1,25(OH)2D3 [Citation7,Citation10]. In addition, 1,25(OH)2D3 supplementation altered transcriptional activity of the Jumonji domain containing family of histone demethylases [Citation11–Citation13] and chromatin accessibility via enrichment of histone acetylation marks [Citation14,Citation15].
Recent studies demonstrate that vitamin D status during pregnancy can determine DNA methylation states in the offspring. A recent epigenome-wide case/control study of a Midwestern United States pregnancy cohort reported that maternal vitamin D supplementation with 3,800 IU/day vs. 400 IU/day during pre- and post-natal development resulted in gain and loss of DNA methylation in both maternal and infant leukocytes [Citation16]. Several studies in Sprague-Dawley rats also detected offspring DNA methylation changes in response to dietary vitamin D depletion during gestation [Citation17–Citation19]. In particular, deficiency induced a significant increase in adult liver global methylation that was linked to changes in transcript levels of DNA methyltransferases (Dnmt1, Dnmt3a, and Dnmt3b) [Citation17]. We showed previously that dietary vitamin D depletion during development (DVD) altered offspring bodyweight and adiposity and led to loss of DNA methylation at several imprinted loci in adult liver and sperm of first generation treated animals as well as the second generation offspring of treated males [Citation20]. Effect sizes at these imprinted loci were small (< 10%) and unlikely to have physiological consequences, but the multigenerational phenotypes were indicative of a greater epigenetic response to DVD that we proposed could be propagated through the male germline.
To gain a better understanding of the extent of DNA methylation response to vitamin D deficiency and elucidate susceptible genes, we characterized the genome-wide impact of DVD on DNA methylation states of mature adult sperm. As a homogeneous cell population, sperm provides a valuable model for studying DNA methylation response to environment during development. Human studies link sperm methylation changes to environmental exposures [Citation21,Citation22], but animal studies have provided critical evidence to demonstrate substantial methylation changes specifically in response to suboptimal environmental conditions (e.g., protein restriction) during development [Citation23]. Perturbed sperm methylation state may also serve as an important predictor of future offspring health outcomes having been linked to impaired early embryonic development in humans [Citation24–Citation26] and metabolic dysregulation in mouse models of protein restriction [Citation23].
Here, we assessed the location, distribution, effect size, directionality, and genic location of DNA methylation changes in adult sperm induced by vitamin D depletion during development. Our findings of mostly loss of methylation (LOM) changes distributed across the genome at loci primarily relevant to genes in developmental processes are indicative of widespread dysregulation of methylation states in sperm. On the other hand, our finding that larger effect size methylation changes were more prevalent at partially methylated loci as opposed to fully methylated or unmethylated loci suggests that such partially methylated regions are more permissive of DVD-induced changes.
Results
Vitamin D depletion during development leads to mostly loss of CpG methylation across adult sperm genome
Experimental male mice were generated by crossing Collaborative Cross inbred mice, CC001 dams and CC011 sires, as described previously [Citation20]. Males were exposed to vitamin D depleted conditions during pre- and post-natal development via maternal diet of either AIN-93G diet (1000 IU/kg of vitamin D3, CON) or modified AIN-93G lacking vitamin D (0 IU/kg of vitamin D3, DVD). Adult (8wks) male sperm samples were selected from animals that differed in adult body weight and testes weight between the two diet groups, as previously reported [Citation20]. Genome-wide DNA methylation was measured by bisulfite sequencing (bis-seq) using the Agilent SureSelect Methyl-seq target enrichment system. After removal of data that did not pass quality controls (QC, ≥ 20 Phred quality score and ≥ 10X read depth), known single nucleotide polymorphisms (SNPs), and repetitive sequences [Citation27], 655,573 CpGs were queried across the sperm genome (Supplemental Figure S1(a)) to identify differentially methylated CpGs (DMCs) between DVD and CON samples.
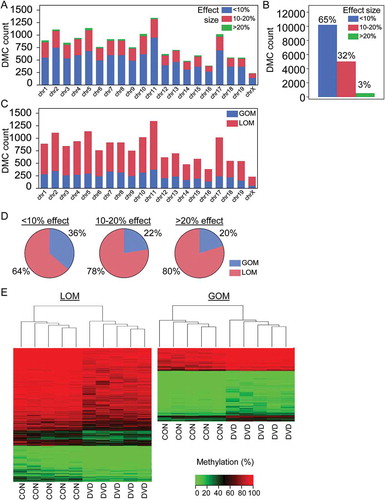
In total, 15,827 sperm DMCs were detected by bis-seq using a threshold FDR of 0.01. DMCs were evenly distributed across the genome (Figure 1(a)). Relative enrichment of DMCs at each chromosome was calculated as the ratio of actual and expected number of DMCs calculated from the proportion of queried CpGs on each chromosome. The number of DMCs per chromosome was proportional to the number of CpGs queried per chromosome with the exception of Chr 17 and Chr X, which were comparatively enriched (Supplemental Figure S1(b)). Filtering to examine only DMCs with ≥ 10% difference in methylation did not change this pattern (Supplemental Figure S1(b)). Most sperm DMCs were small in effect size with 65% of DMCs (10,235) having < 10% difference in methylation between CON and DVD (as calculated by subtracting the weighted average methylation for CON samples from DVD samples) (). However, a considerable proportion of DMCs (35%, 5,592 CpGs) were 10% or greater in effect size, including 551 DMCs with large effect size changes greater than 20% (). DMCs of varying effect sizes were also seemingly evenly distributed across the genome (). Most of the DMCs (approximately 69%) were due to loss of methylation in the DVD group compared with controls. This was independent of chromosomal location and effect size (). Unsupervised hierarchal clustering of all 15,827 DMCs revealed a consistent methylation profile within each treatment group and a distinct methylation profile between CON vs. DVD treatment groups ().
Figure 1. Maternal DVD causes global loss of DNA methylation across the sperm genome. (a) Chromosomal distribution of the 15,827 DMCs with stacked effect sizes. (b) Total count of the DMCs separated by effect size. (c) Chromosomal distribution of DMCs with stacked gain or loss of methylation. (d) Pie graphs for GOM and LOM DMCs separated by effect size categories. (e) Heat map of all 15,827 DMCs with hierarchical clustering separated by loss or gain of methylation. GOM, gain of methylation. LOM, loss of methylation.
Extent of DVD-induced sperm methylation change depends on genic location and baseline methylation state
To examine whether the location and effect size of sperm DMCs was dependent on co-localization with gene bodies, we categorized DMCs by localization in intragenic regions (introns, exons, untranslated regions (UTRs), ≤ 5kb upstream of the annotated transcription start site (TSS)) and intergenic regions (at least 5kb upstream of TSS or downstream of a gene). 68% of DMCs were located either in gene bodies or within 5kb of TSS and more than half of these were intronic (Figure 2(a)). The other 32% of DMCs were intergenic (). When comparing the proportion of large vs. small effect size DMCs that localized to intergenic vs. non-intergenic regions, 45% of large effect size DMCs localized to intergenic regions while only 27% of small effect size DMCs localized to intergenic regions, P = 1.67e-18 (). In contrast, only 13% of large effect size DMCs localized to potential promoter regions (≤ 5kb upstream of TSS) vs. non-promoter regions while 19% of small effect size DMCs localized to potential promoter regions, P = 1.53e-4 (). The directionality of methylation change was similar between genic locations ().
Figure 2. DVD-induced methylation changes are dependent on DMC genic location and baseline methylation state. (a) Pie graphs showing percentage of DMCs at each genic location listed, separated by effect size categories (shown above pie). Total percentages > 100% are due to some DMCs (< 10%) that localized to multiple (overlapping) genes/transcripts. (b) Bar graphs showing the proportion of DMCs at each genic location with different colors representing gain or loss of methylation comparing DVD with CON. (c) Dot plot and violin plot of average CON methylation percentage in each effect size categories separated by GOM and LOM. (d) DMCs with hyper- (methylation level > 90%), partial (methylation level 10–90%) and hypo-methylation (methylation level < 10%). GOM, gain of methylation. LOM, loss of methylation.
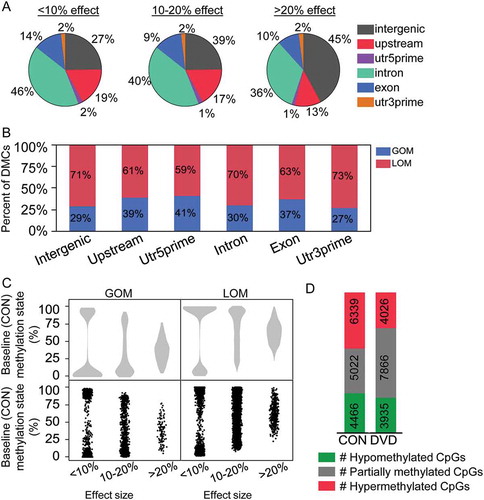
Because we found that the effect size of DVD-induced DMCs was related to the genic location, and therefore not randomly distributed, we next examined whether the effect size was dependent on the baseline methylation state represented in the CON sample. Using CON sample methylation state as the baseline/”normal” state, we categorized the starting methylation state by DMC effect size. We found that DMCs with the smallest effect sizes were more likely to start off as fully hypomethylated (0–10%) or fully hypermethylated (90–100%) () and were more likely to become partially methylated as a result of DVD (). On the other hand, DMCs with the largest effect sizes were more likely to start off as partially methylated (10–90% methylated) () and remain partially methylated after DVD perturbation (). This relationship was independent of directionality of the change in methylation (LOM vs. GOM) (). Overall, the impact of this effect was a significant increase in the proportion of partially methylated loci (vs. fully methylated/unmethylated loci) in DVD sperm compared with CON (50% vs. 32%, P = 1.56e-233) (). Thus, the sperm of males exposed to DVD in utero are not just hypomethylated – they specifically have loss of methylation at loci that would normally be fully methylated.
DVD-induced sperm DMCs occur in clusters enriched at gene bodies
To determine whether DVD-induced sperm DMCs detected by bis-seq occur as regions/clusters and whether cluster size determines the extent of methylation change induced by DVD, we examined the sizes of clustered DMCs across the genome and assessed the relationship between cluster size and effect size. The average distance between CpGs in the mouse genome was previously estimated at approximately 120bp [Citation28]. Therefore, we classified groups of consecutive DMCs with the same directionality of methylation change within 300bp as clusters indicative of a differentially methylated region (DMR). Most of the DMCs (11,712 CpGs, 74%) were singletons and not within 300bp of another DMC (Figure 3(a)). However, 26% of DMCs (4,115 CpGs) were present in clusters of two or more DMCs including one DMR as large as 245 DMCs spanning 3,235bp (). Clustering was associated with greater DNA methylation changes (P = 1.02e-9) so that larger effect sizes were more likely present in larger clusters vs. smaller clusters ().
Figure 3. Sperm DMCs cluster into differentially methylated regions. (a) Number of clusters (upper panel) containing different number of DMCs and the corresponding effect size for each DMC (middle panel) and each cluster (bottom panel). (b) Percent of clusters with different effect size averaged across DMCs within the cluster. (c) Pie graph for genic location of the DMC in clusters and singletons, separately. The two largest clusters from RN45s (54 DMCs/cluster and 245 DMCs/cluster) were removed from further analyses due to poor annotation of this region.
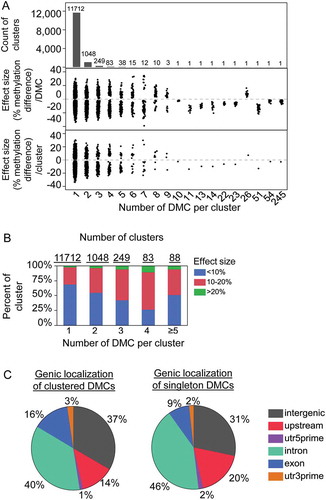
To determine whether clustering of DVD-induced DMCs was related to genic location, clustered DMCs were categorized by genic locations as described above. The largest two clusters of 54 and 245 DMCs were located at the Rn45s locus, encoding the 45s pre-ribosomal RNA. This region is poorly annotated and methylation changes linked to environment have been shown previously to be confounded by repetitive sequence differences between samples [Citation29]. Therefore, Rn45s DMCs were removed from further genic location analyses. Clustered DMCs more frequently localized to exonic regions compared with singleton DMCs (16% vs. 9%, P = 6.52e-29) ().
DVD-induced sperm DMCs localize to genes enriched for developmental processes
To assess whether DVD-induced methylation changes have potential to impact health/disease relevant gene activity and which biological pathways would be most affected, we determined gene ontology categories for genes with proximity to DMCs with at least 10% methylation changes. Using PANTHER gene ontology consortium, 2,440 DMC-associated genes were identified with DMCs being in the gene body or within 5kb upstream of TSS. We used statistical overrepresentation analysis to identify biological processes and pathways relevant to DMCs. DMC-associated gene lists were enriched for four broad biological processes including developmental process, cellular process, biological adhesion and metabolic process (). For the 247 genes involved in developmental processes, further analyses revealed significant overrepresentation for ectoderm development, anatomical structure morphogenesis, mesoderm development and cell differentiation (). PANTHER Pathway analysis revealed significant positive enrichment for pathways involved in Cadherin, Wnt, Platelet-derived Growth Factor and Integrin signaling pathways and angiogenesis (). Overrepresented terms from – remained significant when analysis was performed with DMCs of all effect sizes (data not shown). Furthermore, when gene pathways localizing to clustered vs. singleton DMCs were assessed separately, Wnt and cadherin signaling pathways were significantly overrepresented in both datasets (data not shown).
Table 1. Biological process analysis for 2440 DMC (effect size ≥ 10%)-associated genes.
Table 2. Biological process analysis for 247 DMC (effect size ≥ 10%)-associated genes belonging to developmental process.
Table 3. PANTHER pathway analysis for 2440 DMC (effect size ≥ 10%)-associated genes.
Bis-seq sperm DMCs are partially validated by pyrosequencing and only present in sperm from phenotypically responsive mice
To validate DVD-induced DNA methylation changes detected by bis-seq, we performed targeted pyrosequencing on the samples included in bis-seq. DMCs were selected based on effect size ≥ 10%, DMC clustering, and proximity to genes of interest including epigenetic regulators, developmental genes and/or disease-related genes and the ability to design an overlapping pyrosequencing assay. We assessed methylation changes at 22 DMCs localized to 11 regions: three epigenetic regulatory genes (Tet1, Arid1b and Kdm4b), five developmental genes (Pdx1, Emx2, Hoxb2, Pth1r and Ctnnb1), one protocadherin cluster with a significant role in development and cancer (Pcdhb12 and Pcdhb20) and the Parkinson’s disease related Park2 gene [Citation30] (Figure 4). All regions tested by pyrosequencing followed the same trend of DVD-induced loss of methylation observed in the bis-seq dataset. After correction for multiple testing (FDR< 0.05), 6/11 differentially methylated regions identified by bis-seq were also determined to be statistically significant by pyrosequencing (). Interestingly, effect sizes measured by pyrosequencing were lower than detected by bis-seq, (4 to 10 % vs. 10 to 28% mean methylation difference, respectively), suggesting that the extent of methylation response detected by this bis-seq method may be an overestimate of actual changes.
Figure 4. Pyrosequencing validation of bis-seq detected sperm DMCs. Line graphs of DNA methylation at individual CpGs (left panel) and mean methylation across the region assayed (right panel) measured by pyrosequencing. Location of assayed CpG is illustrated above each plot. Error bars represent standard error of the mean. Asteriks (*) represent significant difference using Wilcoxon test followed by Benjamini-Hochberg correction for multiple testing, FDR< 0.05. Arrow heads indicate bis-seq identified DMCs.
Since sperm samples chosen for bis-seq were partly selected on the basis of the animals having a phenotypic response to DVD, we determined whether methylation response to DVD only coincided with phenotypic response. We defined phenotypic ‘responders’ and ‘non-responders’ based on DVD-induced changes in relative body weight and testes weight described previously [Citation20] (Figure 5(a,b)). Interestingly, none of the DVD-induced methylation changes validated by pyrosequencing in phenotypic responders were detected in sperm from phenotypic non-responders (). The co-occurrence of epigenetic and phenotypic (growth/developmental) response to DVD support a hypothesis that individuals differ in their response to DVD.
Figure 5. Comparison of DVD-induced sperm CpG methylation changes between animals with and without phenotypic response to DVD. G1 8wk (a) body weight and (b) normalized testes weight of CON and DVD treated offspring stratified by cohort of ‘responders’ vs. ‘non-responders’ to DVD. (c) Methylation at 7 validated CpGs measured by bis-seq (top panel) and pyrosequencing in sperm of responders cohort (middle panel) and non-responders cohort (lower panel). Asterisks denote significant differences (**P < 0.01, and *P < 0.05) using Student’s t-test followed by Bonferroni correction for multiple testing. Statistical significance for bis-seq was determined by logistic regression with SLIM method for multiple testing (see methods); pyrosequencing significance determined by Wilcoxon test with Benjamini-Hochberg correction for multiple testing. Error bars represent standard error of the mean.
Discussion
This study demonstrates for the first time that vitamin D status during development has widespread effects on DNA methylation in the adult male germline. Changes were mostly loss of methylation and relatively evenly distributed across the genome suggesting a common mechanism of methylation dysregulation. Larger effect size methylation changes were more prevalent at intergenic regions and at partially methylated regions suggesting these regions are more susceptible to epigenetic dysregulation by DVD. Although most changes occurred at single CpGs, approximately 26% of DMCs occurred in regions of > 1 consecutive DMC with same direction of methylation change and these were more prevalent at exonic regions compared to singletons (16% vs. 9%). Finally, genes localized to DVD-induced sperm methylation changes were enriched for important developmental processes including Wnt and Cadherin signaling pathways.
One of the most interesting findings was that the closer the baseline (CON) methylation state was to the extremes of hypo- and hyper-methylation the smaller the methylation response to DVD. Further assessment of the baseline methylation state across different genic regions in our dataset revealed that the fully hypomethylated regions were more likely to be in promoter regions (5kb upstream of TSS & 5ʹUTR) vs. non-promoter regions (adjusted P = 4.32e-182); the fully hypermethylated regions were more likely to be in gene body regions (introns, exons & 3ʹUTR) than non-gene body regions (adjusted P = 7.87e-37); and the partially methylated regions were more likely to be in intergenic regions (downstream of 3ʹUTR + intergenic) than non-intergenic regions (adjusted P = 1.45e-49) (Supplemental Figure S2). This is in concordance with what has been described previously (reviewed in [Citation31]) and indicates as expected that gene promoters and bodies may be more resistant to DVD-induced epigenetic perturbation while intergenic regions are more susceptible. Additional studies would be necessary to further elucidate the role of sequence context in epigenetic sensitivity to vitamin D depletion and the functional consequences of these changes.
A large number of the genome-wide loss of methylation changes detected here localize to genes involved in Wnt (168 genes, 68 with effect size > 10%) and Cadherin (95 genes, 45 with effect size > 10%) signaling pathways, demonstrating enrichment of genes in these pathways, which could be indicative of perturbed sperm development [Citation32,Citation33] or perturbed development of the second generation which could inherit these changes. Any sperm developmental changes in these first generation animals would likely be subtle since our previous assessment of DVD in males showed no difference in sperm count or litter size [Citation20]. We did show that the DVD-induced sperm methylation response at validated loci was only present in offspring that also exhibited an increase in bodyweight and testes weight. Although no causal relationship could be determined with the present study, co-occurrence of the two types of DVD-induced responses, in light of the Wnt and Cadherin sperm methylation changes, further implicates a developmental effect of DVD. Alternatively, since mature sperm are normally maintained in a hypermethylated state (reviewed in [Citation34,Citation35]), thought to restrict aberrant gene activation and protect germline genome integrity leading up to fertilization (reviewed in [Citation36]), it would be important in future studies to determine whether DVD-induced loss of methylation increases susceptibility to genome instability. In either case, this could represent a ‘sensitized’ epigenetic state that would be more susceptible to further environmental perturbation.
A potential cause for caution in interpretation of the biological relevance of these findings is the difference in methylation changes detected by bis-seq vs. pyrosequencing. Targeted bis-seq performed here identified 13,180 differentially methylated regions (including singletons), and statistical significance was validated at 6/11 regions although with lower effect sizes detected by pyrosequencing. This difference is not surprising since these two methods utilize very different techniques with different levels of intrinsic interindividual sample variance to arrive at an estimate of methylation levels for a CpG. Few studies report multiple methods of detection as a direct comparison but those that do report similar differences [Citation37]. However, if we assume that the pyrosequencing measure is the correct estimate, the more cautious conclusion based on the pyrosequencing estimates is that the overall number and effect sizes detected by the bis-seq method used here may be an overestimation of methylation response to DVD. Nonetheless, even when this lower estimate is taken into account, a substantial number of regions across the genome would still be considered perturbed (~ 7,249) and since the ability to validate by pyrosequencing was seemingly not related to effect size, genic location of the changes, or basal methylation state, the other conclusions remain supported by the data.
Conclusions
In summary, this study provides critical evidence of the ability of vitamin D status during development to perturb methylation states in the adult male germline. It also builds on our previous study to further support the hypothesis that vitamin D deficiency leads to methylation dysregulation. Our data provide an initial characterization of several potential factors related to susceptibility to DVD-induced methylation response including baseline methylation state and sequence context. Future studies will be important for addressing the mechanism of DVD-induced methylation perturbation, particularly whether this response is a direct effect of reduced availability of vitamin D metabolites important for epigenetic regulation or an indirect outcome of poor health related to vitamin D deficiency. Of equal importance is understanding the extent of methylation response in other cell types with relevance to human health, and the impact of methylation changes on sperm development and/or second generation phenotypes.
Methods
Animals
Animal handling was performed in accordance with the Guide for the Care and Use of Laboratory Animals under the corresponding animal protocol at the University of North Carolina at Chapel Hill. Collaborative Cross inbred strains CC001/Unc (CC001) and CC011/Unc (CC011) mice were obtained from the UNC Systems Genetics Core Facility [Citation38].
Dietary treatment and breeding scheme were previously described [Citation20]. Briefly, CC001 dams were fed vitamin D depleted diet (DVD, modified AIN-93G diet #119266, 0 IU/kg of vitamin D3, Dyets Inc.) or control diet (CON, AIN-93G #110700, 1000 IU/kg of vitamin D3, Dyets Inc.) five weeks prior to mating with CC011 sires until weaning. All offspring were transferred to standard rodent chow (Teklad 8604, Harlan Laboratories, 2400 IU/kg of vitamin D3) upon weaning. All samples were collected immediately after euthanasia.
Targeted bis-seq library preparation
Mature sperm was isolated from adult male offspring, snap-frozen in liquid nitrogen and stored at −80 °C and purity was confirmed as previously described [Citation20]. To ensure we compared bis-seq from affected animals and not just any treated animals, we intentionally selected samples from DVD males with the greatest differences in body weight compared to CON [Citation20]. Genomic DNA was extracted from sperm using phenol-chloroform as previously described [Citation39] and quality was assessed using the 260/230 wavelength ratio measured by NanoDrop 2000 spectrometer (Thermo Scientific). Quantity of double-stranded DNA (dsDNA) was measured using the Quant-it PicoGreen dsDNA assay (#P7589, Life technologies). 3 μg dsDNA was used as input and library preparation was carried out using the SureSelectXT Mouse Methyl-Seq system (Agilent) following the manufacturer’s instruction. Libraries were multiplexed and sequenced on the Illumina HiSeq2500 (Illumina).
High-throughput sequencing and data quality control (QC)
The workflow for identifying methylation calls and differentially methylated CpGs were illustrated in a diagram in Supplemental Figure S3. Illumina HiSeq single-end 100 bp long reads were generated and trimmed using Trimmomatic (v. 0.35) with a sliding window of four basepairs and a minimum quality of 15 [Citation40]. The resulting reads were mapped to UCSC mm9 mouse genome using Bowtie2 (v. 2.2.5) and methylation calls were made using Bismark (v. 0.14.5) [Citation41,Citation42]. Only CpGs with ≥ 10X coverage and ≥ 20 quality score were included in the analyses. Methylation bias plots produced by Bismark showed bias at the first 5 and last 9 bases and these bases were removed. Next, Single Nucleotide Polymorphisms (SNPs) and other sequences that would potentially interfere with CpG methylation calls were removed from the dataset. Specifically, SNPs were identified here by comparing the C57BL/6J NCBI37/mm9 reference genome to the pseudogenomes of CC001 and CC011 imputed by the UNC systems genetics core and publicly available on the website as MOD files (http://csbio.unc.edu/CCstatus/index.py?run=PseudoOld). ‘Blacklisted’ regions including repetitive regions and poorly annotated regions of the genome were also removed from the dataset [Citation27].
Methylation analysis
MethylKit (v. 0.9.5), an R (v. 3.2.3) package, was used to identify differentially methylated CpGs by logistic regression comparing among the reads for a given locus, the proportion of methylated cytosines between DVD and CON groups [Citation43,Citation44]. Regression analyses was performed on data after normalizing the coverage between loci using a scaling factor based on the differences in median coverage distributions among CpGs. P-values from the regression analyses were adjusted for multiple comparisons using the SLIM method, within the MethyKit package [Citation45]. A false discovery rate threshold of 0.01 was applied to identify differentially methylated CpGs (DMCs). DMC calls at positive strand were removed to eliminate potential off-target capture by the bait library that targeted negative strand.
DMCs identified by regression were filtered further to remove potential SNPs not present in the CC MOD files (http://csbio.unc.edu/CCstatus/index.py?run=PseudoOld). To identify which DMCs potentially overlapped a known SNP, DMC genomic locations were first converted from UCSC mm9 to mm10 using UCSC liftOver tool. SNPs that overlapped with DMCs were then identified by cross-referencing DMCs with a dbSNP142-based SNP variance file (accessed through Mouse Genomes Project at http://www.sanger.ac.uk/science/data/mouse-genomes-project) that included genotypes of the eight CC founder strains (A/J, C57BL/6J, 129S1Sv/ImJ, NOD/ShiLtJ, NZO/H1LtJ, CAST/EiJ, PWK/PhJ, and WSB/EiJ) using the intersectBed operation from the command line tool bedtools [Citation8,Citation46]. Next, founder strain(s) were assigned for each CpG-overlapping DMC using the founder probability tables for CC001 and CC011 (http://csbio.unc.edu/CCstatus/index.py?run=FounderProbs). Any DMC with a known SNP and different or unknown founder genotypes was removed from our dataset. DMCs with a bimodal methylation distribution were genotyped by Sanger sequencing and excluded if confirmed to be a SNP.
Heatmaps with hierarchical clustering for the 15,827 sperm DMCs was made in R version 3.3.1 using the ‘gplots’ package.
Gene ontology and pathway analysis
DMCs were queried for proximity to annotated genes based on the NCBI Reference Sequence Database (RefSeq). Genes with DMCs (effect size ≥ 10%) in the gene body or within 5kb of TSS (Refseq) were used in gene ontology (GO) and pathway analysis performed through the Protein Analysis through Evolutionary Relationships (PANTHER) database (Version 13.0, released 2017-11-12) [Citation47,Citation48]. A Fisher’s exact test with FDR multiple test correction was performed to determine overrepresentation of genes in biological processes or pathways that were enriched in our dataset relative to PANTHER’s reference list [Citation49]. Lastly, GO analysis and overrepresentation tests were performed for DMCs of all effect sizes to confirm if terms significantly overrepresented for DMCs of ≥ 10% effect size were also present for DMCs of all effect sizes.
Pyrosequencing validation
Pyrosequencing was performed on sperm samples used for bis-seq (n = 5) and additional sperm samples (CON, n = 5 and DVD, n = 6). DNA from frozen mature sperm samples was extracted by phenol-chloroform method [Citation39]. DNA purity was assessed by NanoDrop 2000 spectrometer (Thermo Scientific) using the optical density at wavelengths 260/230 and double stranded DNA quantity was determined by the Quant-it PicoGreen dsDNA assay (#P7589, Life technologies). Genomic DNA was bisulfite-converted using the EZ DNA methylation Gold kit (#D5006, Zymo research) according to the manufacture’s instruction. Pyrosequencing PCR and sequencing primers were designed to avoid known SNPs/deletions that would interfere with PCR or sequencing. Pyrosequencing was performed using the Pyromark Q96MD instrument (QIAGEN) with corresponding primers (Supplemental Table S1). PCR and sequencing were performed in duplicates and the mean methylation of duplicates was used. Mean methylation percentage for each assay represented here is the average of all CpGs assayed across the given region.
Statistical analysis
Statistical analyses were performed using JMP Pro software version 12.2.0 (SAS, NC) unless otherwise specified. Two-tailed Fisher’s exact test was used to separately test the null hypotheses that (i) the proportions of intergenic vs. non-intergenic DMCs were the same for small and large effect size DMCs; (ii) the proportions of promoter vs. non-promoter DMCs were the same for small and large effect size DMCs; (iii) the proportions of partially methylated (10–90% methylation) vs. fully unmethylated/methylated (< 10% and > 90%) DMCs were the same for CON and DVD samples; (iv) the proportions of exonic vs. non-exonic DMCs were the same between clustered DMCs and singleton DMCs and (v) the proportions of DMCs that localized to different genic locations (promoter (5kb upstream of TSS & 5ʹUTR), gene body (introns, exons & 3ʹUTR) and intergenic regions (downstream of 3ʹUTR + intergenic)) were the same for different methylation states in CON samples (fully hypomethylated, partially methylated and fully hypermethylated). P-values for the set of fisher’s exact tests in (v) were adjusted for 9 comparisons using Bonferroni correction [Citation50].
Linear regression was performed to determine the relationship between the extent of DNA methylation changes and DMC clustering. Specifically, number of DMCs per cluster (log transformed) was used to predict cluster effect size averaged across DMCs within the cluster. The model adjusted for length of clusters and diet effect (GOM or LOM). Normal distribution of residuals was examined using histogram and normal quantile plot. Singletons and the two Rn45s clusters (with 54 and 245 DMCs, respectively) were excluded.
Statistical analysis for pyrosequencing results was carried out using R version 3.3.1. Shapiro-Wilk goodness-of-fit test was performed on original data as well as log transformed data. Data was not normally distributed and therefore non-parametric Wilcoxon tests were performed for methylation percent at single CpGs and average methylation percent across each assayed region. Correction for multiple comparisons was performed using the Benjamini-Hochberg approach and false discovery rate (FDR) less than 0.05 was considered statistically significant [Citation51].
Body weight and testes weight were analyzed using two-tailed Student’s t-test after confirming normality using the Shapiro-Wilk goodness-of-fit test and confirming equal variance using Bartlett’s test. P values were adjusted for 2 comparisons using Bonferroni correction [Citation50].
Author contributions
The experimental question and study design was conceived by FI. Mouse crosses and treatment scheme were conceived and supervised by LT and WV. Experimental animal handling, tissue collection, sample selection and preparation were performed by JX and FI. Post-sequencing quality control and data analyses to identify DMCs were performed by RZG and CB. All other data generation, analyses and interpretation were performed by JX and EP under the supervision of FI. The manuscript was drafted by JX and revised by FI with input from all authors. All authors have read and approved this manuscript.
Ethical disclosure
All animal handling was performed in accordance with the Guide for the Care and Use of Laboratory Animals under the corresponding animal use protocol at the University of North Carolina at Chapel Hill.
Supplemental Material
Download MS Power Point (274.4 KB)Acknowledgments
We thank the UNC Systems Genetics Core Facility for providing the Collaborative Cross mice; Fernando Pardo Manuel de Villena for advice in selection of the CC strain; Terry Furey for advice in filtering bis-seq reads at repetitive regions and Mark Calaway, Kiristin Clement, Alisha Coffey, Kunjie Hua, Ryan Kuster, Judy Oakes and Sarah Schoenrock for providing technical assistance.
Disclosure statement
No potential conflict of interest was reported by the authors.
Supplementary material
Supplementary data for this article can be accessed here.
Additional information
Funding
Related Research Data
References
- Fox J, Kollenkirchen U. Normal plasma calcium, phosphate, and parathyroid hormone levels during 1,25(OH)2D3 infusions in rats. Am J Physiol. 1992 Jan;262(1 Pt 1):E126–9. PubMed PMID: 1733243.
- De Vizia B, Mansi A. Calcium and phosphorus metabolism in full-term infants. Monatsschrift Kinderheilkunde. 1992 Sep;140(9 Suppl 1):S8–12. PubMed PMID: 1435829.
- Wei R, Christakos S. Mechanisms underlying the regulation of innate and adaptive immunity by Vitamin D. Nutrients. 2015 Sep 24;7(10):8251–8260. PubMed PMID: 26404359; PubMed Central PMCID: PMC4632412.
- Lugg ST, Howells PA, Thickett DR. Optimal Vitamin D supplementation levels for cardiovascular disease protection. Dis Markers. 2015;2015:864370. PubMed PMID: 26435569; PubMed Central PMCID: PMC4578836.
- Cui X, Gooch H, Groves NJ, et al. Vitamin D and the brain: key questions for future research. J Steroid Biochem Mol Biol. 2015 Apr;148:305–309. PubMed PMID: 25448739.
- Blomberg Jensen M. Vitamin D and male reproduction. Nat Reviews Endocrinol. 2014 Mar;10(3):175–186. PubMed PMID: 24419359.
- Fetahu IS, Hobaus J, Kallay E. Vitamin D and the epigenome. Front Physiol. 2014;5:164. PubMed PMID: 24808866; PubMed Central PMCID: PMC4010791.
- Keane TM, Goodstadt L, Danecek P, et al. Mouse genomic variation and its effect on phenotypes and gene regulation. Nature. 2011 Sep 14;477(7364):289–294. PubMed PMID: 21921910; PubMed Central PMCID: PMC3276836.
- Zhu H, Wang X, Shi H, et al. A genome-wide methylation study of severe vitamin D deficiency in African American adolescents. J Pediatr. 2013 May;162(5):1004–9 e1. PubMed PMID: 23219444; PubMed Central PMCID: PMC3935318.
- Malinen M, Saramaki A, Ropponen A, et al. Distinct HDACs regulate the transcriptional response of human cyclin-dependent kinase inhibitor genes to Trichostatin A and 1alpha,25-dihydroxyvitamin D3. Nucleic Acids Res. 2008 Jan;36(1):121–132. PubMed PMID: 17999998; PubMed Central PMCID: PMC2248733.
- Pereira F, Barbachano A, Silva J, et al. KDM6B/JMJD3 histone demethylase is induced by vitamin D and modulates its effects in colon cancer cells. Hum Mol Genet. 2011 Dec 1;20(23):4655–4665. PubMed PMID: 21890490.
- Pereira F, Barbachano A, Singh PK, et al. Vitamin D has wide regulatory effects on histone demethylase genes. Cell Cycle. 2012 Mar 15;11(6):1081–1089. PubMed PMID: 22370479.
- Padi SK, Zhang Q, Rustum YM, et al. MicroRNA-627 mediates the epigenetic mechanisms of vitamin D to suppress proliferation of human colorectal cancer cells and growth of xenograft tumors in mice. Gastroenterology. 2013 Aug;145(2):437–446. PubMed PMID: 23619147; PubMed Central PMCID: PMC3722307.
- Seuter S, Pehkonen P, Heikkinen S, et al. Dynamics of 1alpha,25-dihydroxyvitamin D3-dependent chromatin accessibility of early vitamin D receptor target genes. Biochim Biophys Acta. 2013 Dec;1829(12):1266–1275. PubMed PMID: 24185200.
- Seuter S, Heikkinen S, Carlberg C. Chromatin acetylation at transcription start sites and vitamin D receptor binding regions relates to effects of 1alpha,25-dihydroxyvitamin D3 and histone deacetylase inhibitors on gene expression. Nucleic Acids Res. 2013 Jan 07;41(1):110–124. PubMed PMID: 23093607; PubMed Central PMCID: PMC3592476.
- Anderson CM, Gillespie SL, Thiele DK, et al. Effects of maternal Vitamin D supplementation on the maternal and infant epigenome. Breastfeeding Med. 2018 Jun;13(5):371–380. PubMed PMID: 29782187.
- Zhang H, Chu X, Huang Y, et al. Maternal vitamin D deficiency during pregnancy results in insulin resistance in rat offspring, which is associated with inflammation and Ikappabalpha methylation. Diabetologia. 2014 Oct;57(10):2165–2172. PubMed PMID: 24985146.
- Meems LM, Mahmud H, Buikema H, et al. Parental vitamin D deficiency during pregnancy is associated with increased blood pressure in offspring via Panx1 hypermethylation. Am J Physiol Heart Circ Physiol. 2016 Dec 1;311(6):H1459–H1469. PubMed PMID: 27769995.
- Wen J, Hong Q, Wang X, et al. The effect of maternal vitamin D deficiency during pregnancy on body fat and adipogenesis in rat offspring. Sci Rep. 2018 Jan 10;8(1):365. PubMed PMID: 29321608; PubMed Central PMCID: PMC5762667.
- Xue J, Schoenrock SA, Valdar W, et al. Maternal vitamin D depletion alters DNA methylation at imprinted loci in multiple generations. Clin Epigenetics. 2016;8:107. PubMed PMID: 27777636; PubMed Central PMCID: PMC5062906.
- Jenkins TG, James ER, Alonso DF, et al. Cigarette smoking significantly alters sperm DNA methylation patterns. Andrology. 2017 Nov;5(6):1089–1099. PubMed PMID: 28950428; PubMed Central PMCID: PMC5679018.
- Wu H, Estill MS, Shershebnev A, et al. Preconception urinary phthalate concentrations and sperm DNA methylation profiles among men undergoing IVF treatment: a cross-sectional study. Hum Reproduction. 2017 Nov 1;32(11):2159–2169. PubMed PMID: 29024969.
- Radford EJ, Ito M, Shi H, et al. In utero effects. In utero undernourishment perturbs the adult sperm methylome and intergenerational metabolism. Science. 2014 Aug 15;345(6198):1255903. PubMed PMID: 25011554; PubMed Central PMCID: PMC4404520.
- Santi D, De Vincentis S, Magnani E, et al. Impairment of sperm DNA methylation in male infertility: a meta-analytic study. Andrology. 2017 Jul;5(4):695–703. PubMed PMID: 28718528.
- Denomme MM, McCallie BR, Parks JC, et al. Alterations in the sperm histone-retained epigenome are associated with unexplained male factor infertility and poor blastocyst development in donor oocyte IVF cycles. Hum Reproduction. 2017 Dec 1;32(12):2443–2455. PubMed PMID: 29087470.
- Laqqan M, Solomayer EF, Hammadeh M. Aberrations in sperm DNA methylation patterns are associated with abnormalities in semen parameters of subfertile males. Reprod Biol. 2017 Sep;17(3):246–251. PubMed PMID: 28566207.
- Consortium EP. An integrated encyclopedia of DNA elements in the human genome. Nature. 2012 Sep 6;489(7414):57–74. PubMed PMID: 22955616; PubMed Central PMCID: PMC3439153.
- Zhao Z, Zhang F. Sequence context analysis in the mouse genome: single nucleotide polymorphisms and CpG island sequences. Genomics. 2006 Jan;87(1):68–74. PubMed PMID: 16316740.
- Shea JM, Serra RW, Carone BR, et al. Genetic and epigenetic variation, but not diet, shape the sperm methylome. Dev Cell. 2015 Dec 21;35(6):750–758. PubMed PMID: 26702833; PubMed Central PMCID: PMC4691283.
- Dallosso AR, Hancock AL, Szemes M, et al. Frequent long-range epigenetic silencing of protocadherin gene clusters on chromosome 5q31 in Wilms’ tumor. PLoS Genet. 2009 Nov;5(11):e1000745. PubMed PMID: 19956686; PubMed Central PMCID: PMC2776977.
- Guibert S, Weber M. Functions of DNA methylation and hydroxymethylation in mammalian development. Curr Top Dev Biol. 2013;104:47–83. PubMed PMID: 23587238.
- Anilkumar TR, Devi AN, Pillai SM, et al. Expression of protocadherin 11Yb (PCDH11Yb) in seminal germ cells is correlated with fertility status in men. Reprod Fertil Dev. 2017 Oct;29(11):2100–2111. PubMed PMID: 28241900.
- Koch S, Acebron SP, Herbst J, et al. Post-transcriptional Wnt signaling governs epididymal sperm maturation. Cell. 2015 Nov 19;163(5):1225–1236. PubMed PMID: 26590424.
- Miller D, Brinkworth M, Iles D. Paternal DNA packaging in spermatozoa: more than the sum of its parts? DNA, histones, protamines and epigenetics. Reproduction. 2010 Feb;139(2):287–301. PubMed PMID: 19759174.
- Marchal R, Chicheportiche A, Dutrillaux B, et al. DNA methylation in mouse gametogenesis. Cytogenet Genome Res. 2004;105(2–4):316–324. PubMed PMID: 15237219.
- McLay DW, Clarke HJ. Remodelling the paternal chromatin at fertilization in mammals. Reproduction. 2003 May;125(5):625–633. PubMed PMID: 12713425; PubMed Central PMCID: PMC5123868.
- Katz TA, Liao SG, Palmieri VJ, et al. Targeted DNA methylation screen in the mouse mammary genome reveals a parity-induced hypermethylation of Igf1r that persists long after parturition. Cancer Prev Res. 2015 Oct;8(10):1000–1009. PubMed PMID: 26290394; PubMed Central PMCID: PMC4677681.
- Welsh CE, Miller DR, Manly KF, et al. Status and access to the collaborative cross population. Mamm genome. 2012 Oct;23(9–10):706–712. PubMed PMID: 22847377; PubMed Central PMCID: PMC3463789.
- Bartolomei MS, Webber AL, Brunkow ME, et al. Epigenetic mechanisms underlying the imprinting of the mouse H19 gene. Genes Dev. 1993 Sep;7(9):1663–1673. PubMed PMID: 7690336.
- Bolger AM, Lohse M, Usadel B. Trimmomatic: a flexible trimmer for Illumina sequence data. Bioinformatics. 2014 Aug 01;30(15):2114–2120. PubMed PMID: 24695404; PubMed Central PMCID: PMC4103590.
- Krueger F, Andrews SR. Bismark: a flexible aligner and methylation caller for Bisulfite-Seq applications. Bioinformatics. 2011 Jun 01;27(11):1571–1572. PubMed PMID: 21493656; PubMed Central PMCID: PMC3102221.
- Langmead B, Salzberg SL. Fast gapped-read alignment with Bowtie 2. Nat Methods. 2012 Mar 04;9(4):357–359. PubMed PMID: 22388286; PubMed Central PMCID: PMC3322381.
- Akalin A, Kormaksson M, Li S, et al. methylKit: a comprehensive R package for the analysis of genome-wide DNA methylation profiles. Genome Biol. 2012 Oct 03;13(10):R87. PubMed PMID: 23034086; PubMed Central PMCID: PMC3491415.
- R Core Team. R: A language and environment for statistical computing R foundation for statistical computing. Vienna, Austria; 2015. Available from: https://www.R-project.org/
- Wang HQ, Tuominen LK, Tsai CJ. SLIM: a sliding linear model for estimating the proportion of true null hypotheses in datasets with dependence structures. Bioinformatics. 2011 Jan 15;27(2):225–231. PubMed PMID: 21098430.
- Sherry ST, Ward MH, Kholodov M, et al. dbSNP: the NCBI database of genetic variation. Nucleic Acids Res. 2001 Jan 1;29(1):308–311. PubMed PMID: 11125122; PubMed Central PMCID: PMC29783.
- Mi H, Huang X, Muruganujan A, et al. PANTHER version 11: expanded annotation data from Gene Ontology and Reactome pathways, and data analysis tool enhancements. Nucleic Acids Res. 2017 Jan 4;45(D1):D183–D189. PubMed PMID: 27899595; PubMed Central PMCID: PMC5210595.
- Mi H, Thomas P. PANTHER pathway: an ontology-based pathway database coupled with data analysis tools. Methods Mol Biol. 2009;563:123–140. PubMed PMID: 19597783.
- Mi H, Muruganujan A, Casagrande JT, et al. Large-scale gene function analysis with the PANTHER classification system. Nat Protoc. 2013 Aug;8(8):1551–1566. PubMed PMID: 23868073.
- Dunn OJ. Multiple comparison among means. J Am Stat Assoc. 1961;56:52–64.
- Hochberg Y, Ba Y. Controlling the false discovery rate: a practical and powerful approach to multiple testing. J R Stat Soc B Methodol. 1995;57:289–300.