
 ?Mathematical formulae have been encoded as MathML and are displayed in this HTML version using MathJax in order to improve their display. Uncheck the box to turn MathJax off. This feature requires Javascript. Click on a formula to zoom.
ABSTRACT
Age-related changes in DNA methylation were observed in cross-sectional studies, but longitudinal evidence is still limited. Here, we aimed to characterize longitudinal age-related methylation patterns using 1011 blood samples collected from 385 Swedish twins (age at entry: mean 69 and standard deviation 9.7, 73 monozygotic and 96 dizygotic pairs) up to five times (mean 2.6) over 20 years (mean 8.7). We identified 1316 age-associated methylation sites (P<1.3×10⁻⁷) using a longitudinal epigenome-wide association study design. We measured how estimated cellular compositions changed with age and how much they confounded the age effect. We validated the results in two independent longitudinal cohorts, where 118 CpGs were replicated in Prospective Investigation of the Vasculature in Uppsala Seniors (PIVUS, 390 samples) (P<3.9×10⁻⁵), 594 in Lothian Birth Cohort (LBC, 3018 samples) (P<5.1×10⁻⁵) and 63 in both. Functional annotation of age-associated CpGs showed enrichment in CCCTC-binding factor (CTCF) and other transcription factor binding sites. We further investigated genetic influences on methylation and found no interaction between age and genetic effects in the 1316 age-associated CpGs. Moreover, in the same CpGs, methylation differences within twin pairs increased with 6.4% over 10 years, where monozygotic twins had smaller intra-pair differences than dizygotic twins. In conclusion, we show that age-related methylation changes persist in a longitudinal perspective, and are fairly stable across cohorts. The changes are under genetic influence, although this effect is independent of age. Moreover, methylation variability increase over time, especially in age-associated CpGs, indicating the increase of environmental contributions on DNA methylation with age.
Introduction
DNA methylation is known as a key factor in human aging [Citation1]. In the human aging process, alterations of DNA methylation indicate a loss of epigenetic control and relate to pathological phenotypes [Citation2,Citation3]. Today, epigenome-wide association studies (EWAS) have established general knowledge on age-related methylation patterns in humans [Citation4-Citation8]. Overall, approximately 30% of cytosine-phosphate-guanine (CpG) sites measured by Illumina HumanMethylation450 (450K) array are associated with age [Citation7,Citation9] and they can be divided into hypo- or hyper-methylations [Citation10]. Moreover, individual variation of DNA methylation partly depends on genetic variants and methylation is believed to be a mediator of genetic effects [Citation11]. Several studies on methylation quantitative trait loci (meQTL) have identified genetic associations with methylation [Citation2,Citation12]. In addition, it has been suggested that age-related methylation alterations depend on genetic effects [Citation9], and another recent study on mother-children pairs reported that meQTL associations were stable over time [Citation12]. Twin studies of the epigenome have been used to estimate methylation heritability [Citation9,Citation13], and higher methylation correlation has been observed in monozygotic (MZ) than dizygotic (DZ) twin pairs [Citation5,Citation14]. However, the change of intra-twin-pair methylation difference over time has not been studied.
To date, most EWAS publications on age used cross-sectional data, while longitudinal studies on intra-individual change in methylation over time are still sparse [Citation15]. Hence, the aim of this study was to investigate longitudinal age-related alterations in DNA methylation, using whole blood samples from old Swedish twins (mean age of 69 at baseline) collected up to five times across 20 years. Age-associated CpGs were then validated in two independent longitudinal cohorts. Age-related changes of cellular compositions were estimated and their effects on age-related change of methylation were measured. In addition, we analyzed meQTL associations and studied genetic effects on age-related methylation patterns over time, with specific emphasis on twin-pair differences.
Results
Longitudinal EWAS on age
Using the Illumina 450K array, DNA methylation data of 390,894 autosomal CpGs were obtained from 385 twins (73 MZ, 96 DZ complete twin pairs) enrolled in the Swedish Adoption/Twin Study of Aging (SATSA) [Citation16] (), which is part of the Swedish Twin Registry [Citation17]. The longitudinal EWAS analysis revealed systematic changes of methylation with age. In total 1316 CpGs were identified as significantly associated with age using a Bonferroni-corrected threshold (P<1.3×10⁻⁷) (Figure S1, File S1), where 1026 CpGs were hypomethylated. The top CpG was found within the gene ELOVL2 (Figure S2). Sex was adjusted for as a covariate in the model, and 6509 CpGs were significantly associated with sex (P<1.3×10⁻⁷), of which 16 were also found among the 1316 age-related CpGs. Overall, sex-associated CpGs were not enriched in the age-associated CpGs. A sensitivity analysis showed that twin zygosity had little impact on results.
Table 1. Characteristics of the longitudinal DNA methylation samples collection in SATSA.
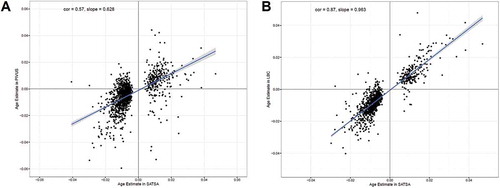
Validation of age-associated CpGs was done in two independent longitudinal cohorts; the Prospective Investigation of the Vasculature in Uppsala Seniors (PIVUS) [Citation18] and the Lothian Birth Cohort (LBC) [Citation19]. The PIVUS cohort measured methylation data from 196 individuals at age 70 and 80, and the LBC cohort, including two sub-cohorts of 906 and 436 individuals at baseline, measured blood samples at three time points, with mean ages of 70 and 79 at baseline (Table S1). Among the 1316 age-associated CpGs identified in SATSA, 1271 and 973 CpGs were available in PIVUS and LBC respectively. In PIVUS, 118 of the 1271 CpGs were consistent in effect directions and significant at a Bonferroni-correction threshold for validation P<3.9×10⁻⁵. In LBC, 594 out of 973 CpGs were consistent in effect directions and significant with P<5.1×10⁻⁵. The correlation of effect sizes between PIVUS and SATSA was 0.57, and 0.87 between LBC and SATSA ().
Figure 1. The effect sizes of age on age-associated CpGs in SATSA and two independent longitudinal cohorts. Effect sizes of age were estimated from a longitudinal epigenome-wide associated study of age in SATSA, using a mixed effect model. The 1316 Bonferroni significant CpGs (P<1.3×10⁻⁷) were tested for age associations in PIVUS and LBC. a) The Pearson correlation of the effect sizes is 0.57 (P<10−16) between PIVUS and SATSA. The slope of the linear regression line is 0.63. b) The Pearson correlation is 0.87 (P<10−16) between SATSA and LBC. The slope of linear regression is 0.96.
Cellular compositions change with age
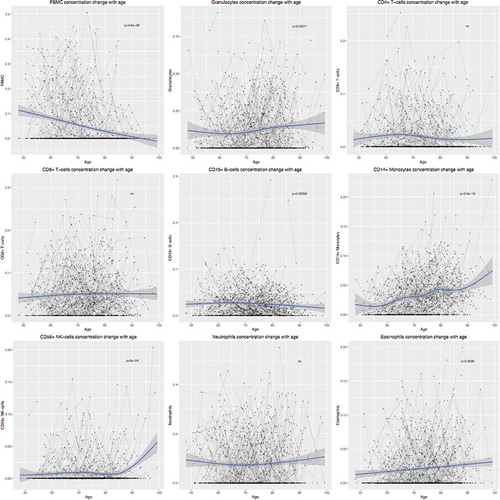
Cellular compositions were estimated from methylation data using the method by Houseman [Citation20] and the longitudinal change of cellular compositions with age was measured using a mixed effect model. The total peripheral blood mononuclear cell (PBMC) proportions increased with age (P=4.6×10⁻⁸) while granulocytes proportions decreased with age (P=1.1×10⁻⁴). Within PBMCs, CD14+ monocytes (P=9.4×10⁻¹⁶) and natural killer cells (P=6.0×10⁻⁴) significantly increased with age, while CD19+ B cells decreased with age (P=9.2×10⁻⁴). Within granulocytes, eosinophils increased with age (P=2.6×10⁻⁴) while neutrophils did not change with age (). However, in general, age only explains a small proportion of the variance of cellular compositions in our cohort (, File S1).
Figure 2. Longitudinal changes of cellular compositions with age. Estimated cellular compositions were plotted against age for each cell types. Grey lines indicate multiple observations of individuals. P-values were calculated from a mixed effect model measuring the longitudinal change of cellular proportions. PBMC, peripheral blood mononuclear cell; NK cell, natural killer cell.
Furthermore, the adjustment of cellular compositions in the 1316 age-associated CpGs only slightly increases the effect sizes of age, especially for hypermethylated CpGs. In total, 246 CpGs were significantly (P<3.8×10⁻⁵) associated with at least one cell type and 40 of them were associated with all estimated cell types. However, effect sizes of CpGs were highly correlated with or without adjusting for cellular compositions (r=98.4%) (Figure S3, File S1).
Regulatory and functional annotations of age-associated cpgs
The CpG island locations of the identified age-associated CpGs were obtained from the Illumina manifest file. Age-associated CpGs were less frequently found in CpG islands and open sea regions, and more frequently in CpG shores among the probes designed in the 450K chip. The majority (1026 of 1316) of the CpGs showed decreased methylation with age, and among the hypermethylated CpGs, the majority (85.2%) were located in CpG islands ()).
Figure 3. The distribution of age-associated CpGs in relation to CpG islands and regulatory features. a) Proportions of age-related hyper- and hypomethylated CpGs in different CpG island regions compared to proportions on the 450K array. Age-associated CpGs are enriched in CpG shores (North Shore P=3.7×10⁻¹² and South Shore P=1.8×10⁻¹⁸), and depleted in CpG islands (P=6.6×10⁻⁷) and open sea regions (P=1.1×10⁻¹⁷). Outside of CpG islands, 918 out of 961 CpGs are hypomethylated with age, and in CpG islands, 247 out of 355 CpGs are hypermethylated with age. B) The proportions of age-related hyper- and hypomethylation, as well as background CpGs, in different regulatory regions. Age-associated CpGs are highly enriched in CTCF binding cites (P=3.9×10⁻²⁷). Only in TF binding sites, the proportion of age-related hypermethylated CpGs is higher than hypomethylated CpGs. The enrichment or depletion is shown by p-values calculated from two-sample proportion tests. CpG, cytosine-phosphatate-guanine; ns, non-significant; CTCF, CCCTC-binding factor; TF, transcription factor.
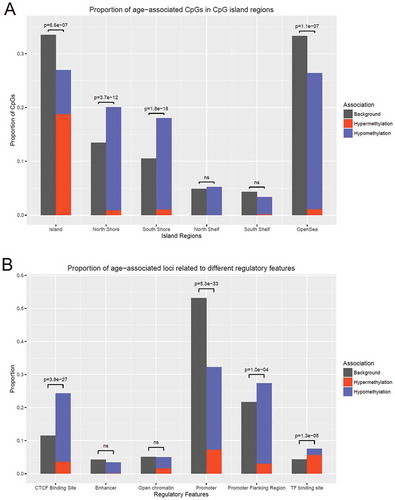
To explore biological functions, we annotated the age-associated CpGs using regulatory features from the Ensembl database, showing CpGs in relation with regulatory protein binding sites [Citation21]. Compared to regulatory features of the 450K probe background, age-associated CpGs were found enriched in CTCF binding sites, promoter flanking regions and other transcription factor binding sites ()). In particular, a much higher proportion of hypermethylated CpGs were found in transcription factor binding sites than other regulatory features.
We further mapped the 1316 age-associated CpGs to 878 genes according to the Illumina manifest file. Consequently, genes were annotated using the Database for Annotation, Visualization and Integrated Discovery (DAVID) online tool [Citation22,Citation23], and 85.3% of the genes were categorized according to the biological process term of gene ontology (GO). Seven GO terms were found significantly enriched (false discovery rate [FDR] < 0.05), and the top function was homophilic cell adhesion via plasma membrane adhesion molecules (). Moreover, many of the genes were found to be enriched in functions related to nervous system development and neurogenesis.
Table 2. Enriched Gene Ontology terms for genes mapped to the age-associated CpGs.
Identification of cis-meqtls
To investigate genetic influences on methylation, cis-meQTLs (distance between markers <1 million base pairs) from 1.9 billion possible associations between 6.5 million single nucleotide polymorphisms (SNPs) and 390,894 CpGs across the genome were analyzed. Over 1.4 million associations were statistically significant using a Bonferroni-corrected threshold (P<2.5×10⁻¹¹). As expected, we observed more associations and lower p-values when SNPs were closer to their associated CpGs (Figure S4). In total, 14,714 CpGs were significantly associated with at least one SNP.
Overall, our results were consistent with associations in the mQTL database [Citation12]. About 44% of SNP-CpG associations identified in SATSA were also significant (P<10−14) in the middle-age group in the mQTL database. Also, 8950 out of the 14,714 (61%) SNP-associated CpGs identified in SATSA were also significantly (P<10−14) associated with SNPs in the mQTL database.
Genetic effects on age-associated cpgs
To investigate the relationship between age and genetic effects on methylation, we specifically studied CpGs that were significantly associated with both age and genetic variants. Among the 1316 age-associated CpGs discovered in the longitudinal analysis, 123 (9.3%) were also associated with at least one SNP. The proportion of genetic-associated CpGs among the age-associated CpGs (9.3%) was higher than the proportion in all CpGs (3.7%; P=6.7×10⁻²⁶). For each of those CpGs, a longitudinal mixed effect model was performed including the associated SNP with the lowest p-value as a covariate. The age effects were still significant after adjusting for top associated SNPs (File S2). Moreover, interactions between age and SNPs were tested in the models as covariates, and no significant interaction was observed.
Methylation differences within twin pairs
We further calculated standardized Euclidean distances from genome-wide methylation data to measure intra-pair differences between MZ and DZ twins over time (Table S3). Only paired twin samples measured at the same time (660 samples from 154 twin pairs) were included in the analysis. Taking all CpGs into account, distances within twin pairs increased significantly with age (β=0.021, P=P=9.4×10⁻⁴) ()), with steeper slopes when using the 1316 age-associated CpGs only (β=0.029, P=2.9×10⁻⁵; )). The slope of the age effect on methylation differences in SNP-associated CpGs was smaller than that of all CpGs (β=0.015, P=3.32×10⁻⁵; )).
Figure 4. Regression plots of intra-twin-pair methylation differences over time in SATSA. Methylation differences within twin pairs at the same time point calculated by Euclidean distances of a) all CpGs, b) age-associated CpGs, and c) SNP-associated CpGs. Blue lines and points are MZ and red lines and points are DZ. Methylation differences within twin pairs increase with age, especially in age-associated CpGs. CpG, cytosine-phosphatate-guanine; MZ, monozygotic; DZ, dizygotic; SNP, single nucleotide polymorphism.

Furthermore, MZ and DZ twins showed significant intra-twin-pair Euclidean distances based on all CpGs, where MZ twins had significantly smaller distances compared to DZ twins (β=0.499, P=1.0×10⁻⁴; )). In particular, the difference was three times higher for the 14714 SNP-associated CpGs (β=1.689, P=1.46×10−65; )). The difference between zygosities for the 1316 age-associated CpGs was significant and the effect size was larger than that of all CpGs (β=0.697, P=6.75×10⁻⁸; )).
On average, the methylation difference within a dizygotic twin pair was 5.2% higher than that of a monozygotic twin pair using all CpGs. For age-associated CpGs, the number was 9.8% and for meQTLs it was 42.8%. For every 10 years, the methylation difference between twins increased with 5% of the difference between monozygotic twins for all CpGs, 6.4% for age-associated CpGs and 4.3% for meQTL CpGs.
Moreover, for each CpG, we performed an intra-twin-pair analysis to measure how much each one of them contributed to the total increasing methylation distances within twin pairs. Although no CpG passed the Bonferroni threshold (P<1e-7), 98% CpGs with P<0.05 had positive estimates of age, indicating that the differences in global methylation patterns between twins increased over time (Figure S5). On average, the age-associated CpGs had a higher effect size compared to all CpGs (15% higher, P=4.18×10−05 from a t-test), explaining the steeper slope of age-associated CpG in . However, the CpGs that contributed to the growing intra-twin-pair methylation distances (P<0.05), had a larger mean effect size than age-associated CpGs (Figure S5).
Discussion
In this study, we characterized longitudinal age-related DNA methylation patterns in old twins, and identified 1316 CpGs associated with age. The strongest age-associated CpG was found in the promoter of the ELOVL2 gene. Also, we described the longitudinal change of estimated cellular compositions with age and how cellular compositions affect age-associated methylation patterns. Moreover, genetic effects were observed for some age-associated CpGs, but they were independent of age effects. Furthermore, analyses of methylation differences within twin pairs revealed increasing differences over time, where MZ twins showed smaller dissimilarities than DZ twins in age-associated CpGs.
The age-related CpGs from SATSA were successfully validated in the longitudinal cohort LBC, but less consistent in PIVUS. The LBC cohort validated 594 of the 1316 age-related CpGs at P<5.1×10⁻⁵, with a large sample size and three longitudinal waves. The high correlation of effect sizes of age (r=0.87) between SATSA and LBC indicated that LBC verified the effect sizes estimated by SATSA as well. The PIVUS cohort validated 118 of the 1316 CpGs at P<3.9×10⁻⁵ and had an intermediate correlation (r=0.57) of age effect sizes with SATSA. Specifically, PIVUS failed to validate the convincing top hit cg16867657 from SATSA. One explanation could be that the PIVUS cohort only collected data from participants at two ages, 70 and 80 years. Thus, the PIVUS cohort was quite different from SATSA in study design, where SATSA had up to five longitudinal waves and a much wider age range (49-99 year). Moreover, the age-related CpGs identified in this study were generally consistent with several published cross-sectional studies using 450K data (Table S2). Johansson [Citation7] and Dongen [Citation9] reported around 30% of all CpGs to be age-related, which overlapped with a majority (91% and 66% respectively) of the 1316 age-associated CpGs we identified. Florath [Citation8] only reported 162 significant CpGs and half were also found in SATSA. The overlap between our results and the longitudinal study by Tan [Citation15] was not large (302 out of 2078 CpGs in Tan et al., Table S2); however, the set-up of the study with data from 43 twin pairs at two time points (10 years apart) was again different from ours. In general, when conducting a longitudinal EWAS study, many more covariates come into place and technical variation from different waves could bias the estimates. The SATSA methylation samples, however, were completely randomized on methylation arrays across waves. Overall, much of published cross-sectional results were relevant also in our longitudinal study, indicating that age-associated methylation alterations are persistent over time.
Cellular compositions estimated from methylation data are useful to show how white blood cells change with age. In our longitudinal cohort, T cell compositions were not observed to decrease with age, while the changes of other cell types were in accordance to a previous study [Citation24]. The discrepancy in T cells between studies may highlight differences regularly observed between cross-sectional and longitudinal associations where the former sometimes overestimate an association with age. However, it may also be explained by technical artifacts because many samples had cellular estimates very close to zero, making it difficult to perform good regression analyses. In addition, in spite of the observed cellular composition changes with age, they contributed little to the 1316 age-associated CpGs, where estimates of age were similar with and without adjusting for cellular compositions.
Regulatory annotation of age-associated CpGs indicated enrichment in predicted CTCF binding sites, promoter flanking regions and unannotated TF binding sites. DNA methylation has been reported to regulate CTCF binding to DNA, which in turn regulates gene expression through long range interactions with enhancers and promoters [Citation25]. Thus, we suggest that this methylation of CTCF is important in the aging process. Hypermethylated CpGs were not enriched in promoter regions, where age-related hypermethylation was believed to occur. Instead, hypermethylated CpGs were commonly associated with TF binding sites than in other regulatory regions, indicating the importance of age-related hypermethylation which occurs in TF binding sites unannotated to known regulatory features. The mechanism of age-related methylation in enhancers and open chromatin regions were not clear, because these regions were poorly covered by the 450K array.
The meQTL analysis identified a large number of CpG-SNP associations and showed that genetic variants have strong effects on DNA methylation. The higher proportion of genetic-associated CpGs found among the age-associated CpGs (9.2%) than in all CpGs (3.7%) indicates enriched genetic impact on age-related methylation. Our results suggested no interaction between genetic and age effects on methylation, which supports the conclusion by Gaunt [Citation12] that genetic effects on methylation are stable over time. Similarly, heritability analyses by Tan [Citation15] showed that intra-individual longitudinal change of age-associated CpGs was mostly (90%) explained by individual specific environmental factors. Thus, genetic variants can affect methylation levels of age-associated CpGs, but not the speed of methylation changes over time. A previous study on methylation heritability [Citation9] suggested gene-age interactions on methylation, but they were not detected in our study.
Furthermore, twin-pair methylation differences using information from all CpGs indicated a global increase in inter-individual methylation variations over time. Especially, the increase in methylation differences was stronger (steeper slope) in the age-associated CpGs. Thus, age-associated CpGs not only change with age, but also have higher age-induced variations than average. The result could imply that age-related methylation is more vulnerable to environmental and stochastic effects. Also, comparing MZ and DZ twins showed that genetic effects were stronger in the age-associated CpGs than all CpGs. It corresponded with meQTL results that a higher proportion of SNP-associated CpGs were found in age-associated CpGs.
The strength of this study was the use of longitudinal methylation data with repeated measures sampled up to five times over 20 years in the same individuals. Moreover, we successfully validated our results in two independent longitudinal studies with high correlations of effect sizes. Although blood samples were collected, stored, and DNA extracted at different times, methylation data were measured and processed together with complete randomization. Therefore, we largely reduced the influences of uncorrected batch effects in the analysis. The twin design further enabled us to investigate methylation differences within twin pairs to specifically study environmental influences on methylation.
Among the limitations for this study was that it was performed on a relatively small number of subjects (N=385) and some people only participated in one or two measures. Moreover, the results are only applicable in the old ages and for European ancestry populations.
Further, methylation data were obtained from 450K arrays, which have poor coverage of enhancer regions, an important feature of gene regulation. Also, the quality of data from methylation arrays is not always perfect due to potential unspecific hybridization and noises in signal detection. Stronger evidence could be provided by data from bisulfite pyrosequencing methods as validation.
DNA methylation includes both cell-specific and unspecific patterns. Some evidence show that age-related hypermethylation are more conserved across different tissues than hypomethylation [Citation5,Citation26]. However, we only studied blood samples and adjusted methylation data using estimated cellular compositions [Citation20]. Further investigation on cell-type specific and unspecific methylation alterations in longitudinal studies may reveal methylation patterns in relation to cell types, since cellular composition changes across age in blood [Citation24].
Materials and methods
Study aim, design and settings
This study used methylation data of people involved in SATSA [Citation16], which aims to understand individual differences in aging. The SATSA is part of the Swedish Twin Registry (STR) [Citation17], which is a population-based national register including twins born 1886-2000. The SATSA started in 1984, and continuously collected cognitive and health data every third year with up to ten waves in a total of 861 participants.
Study population
Blood samples were obtained from 402 SATSA participants, including 85 MZ and 116 DZ twin pairs. We collected in total 1122 samples at five time-points starting from 1992 to 2012. After quality control on methylation data, we retained 1011 samples from 385 twins. In the five longitudinal waves, numbers of participants with 1 to 5 measurements were 99, 86, 90, 80, 30 (). Among them, 200 participants were measured at least three times. Phenotype data were collected through comprehensive questionnaires and physical testing at each sampling wave. Phenotypes used in this study include chronological age, sex, zygosity.
Methylation data
For each sample, 200 ng of DNA were bisulfite converted using the EZ-96 DNA MagPrep methylation kit (Zymo Research Corp., Orange, CA, USA) according to the manufacturer’s protocol optimized for Illumina’s Infinium 450K assay. The bisulfite converted DNA samples were hybridized to the Infinium HumanMethylation450 BeadChips by the University College London Genomics Core Facility according to Illumina’s Infinium HD protocol (Illumina Inc., San Diego, CA, USA). Samples were randomly distributed into 13 plates. DNA methylation levels of 485,512 CpGs were measured for each sample.
We processed raw methylation data using the R package RnBeads [Citation27]. Quality control (QC) was performed in two steps removing; 1) samples having low median signal intensities, wrong predicted sex, or poor correlations (r<0.7) with genetic controls; 2) probes overlapping with a SNP and non-CpG probes. Additionally, we employed a greedy-cut algorithm that iteratively filtered out probes and samples. This was done by maximizing false positive rate minus sensitivity with a detection p-value cutoff of 0.05. In the end, probes on sex chromosomes were removed. After QC, we retained 1011 samples and 390,894 probes.
Subsequently, we used a background correction method ‘noob’ [Citation28] from the methylumi package and a normalization method ‘dasen’ [Citation29] from the watermelon package. Next, we corrected normalized data for cellular compositions, which were estimated by the Houseman method [Citation20] using a blood cell reference panel [Citation30]. In order to detect and remove technical variance, we used the Sammon mapping method [Citation31] to achieve a lower-dimension projection preserving the original data structure. The low-dimensional data were then fitted to a linear regression model to test potential batch effects. The strongest batch effects were identified as array slides, and corrected for using the ComBat method from the R package sva [Citation32]. Data (beta-values) were then transformed to M-values for statistical analysis through a logit transformation.
Genotype data and imputation
We generated genotype data using the Illumina PsychChip (Illumina Inc., San Diego, CA, USA), which detected 588,454 SNPs for each individual. We applied QC criteria by removing; 1) samples having >1% missing genotype, estimated inbreeding coefficient >3 standard deviations from the sample mean, wrong relatedness between individuals and wrong predicted sex; 2) SNPs not mapped to a chromosome, with over 2% missing calls, deviating from the Hardy-Weinberg equilibrium (P<10−6) and with no observed minor alleles.
After QC, we performed pre-phasing on genotype data using SHAPEIT v2.r837 with default parameters. Imputation was then performed in chunks of around 5 Mb using IMPUTE2 version 2.3.2 with default parameters [Citation33]. The imputation reference was based on the 1000 Genomes Project phase 1 [Citation34]. Next, a QC step was performed on imputed genotype data to filter out low imputation quality variants (Info<0.6) and low minor allele frequency variants (MAF < 0.05). After imputation and QC, in total 363 individuals from SATSA had genetic data including 6,528,198 imputed SNPs.
PIVUS and LBC cohorts
The PIVUS [Citation18] study included 390 samples from 196 individuals collected at two specific ages, 70 and 80 years. Half of the participants from PIVUS were women. Methylation data were obtained from blood samples using the Illumina 450K array which has been described previously [Citation35].
The LBC study was composed of two different birth cohorts, LBC1936 and LBC1921 [Citation19], with 3018 samples collected in max of three time points. In the three waves, LBC1936 included 906, 801 and 619 individuals with mean ages of 69.6, 72.5 and 76.3 years; LBC1921 included 436, 174, 82 individuals with mean ages of 79.1, 86.7 and 90.2 years. Proportions of women were 49.4% and 53.7% in LBC1936 and LBC1921 at baseline. Methylation data were obtained from blood samples using the Illumina 450K array as presented elsewhere [Citation13].
Statistical analyses
We fitted a linear mixed model to describe longitudinal changes of methylation with age. The model included fixed effects of age and sex, and random intercepts and slopes between twins nested in twin pairs. In the model formula below, i, j and k denote twins, twin pairs and time points; γ, β1, β2, u, ω and ε denote fixed intercept, fixed coefficient of age, fixed coefficient of sex, random intercept, random coefficient of age and random error.
The sensitivity analysis on twin zygosity adjusted zygosity as a random effect in the mixed model.
We used two longitudinal cohorts, PIVUS and LBC, to validate our results. In PIVUS validation, a linear regression model using general least squares was performed to estimate methylation changes over 10 years for each CpG. Confounders included sex, smoking status, cell counts and batch effects were adjusted for in the model. In LBC validation, a mixed effect model allowing for random intercepts and slopes of age were performed to measure age-associated methylation longitudinally. Cell counts was adjusted as a covariate, and sex, sub-cohort, plates, array, position and hybridization date were adjusted as random effects.
The cis-meQTL analysis was performed on 363 participants in SATSA with both genotype and methylation data available. Methylation data from the first observation were used to identify meQTLs. To reduce the computational complexity, we employed the R package matrixEQTL [Citation36] to perform a fast rough screening for cis-meQTLs. Genotypes were treated to have additive effects in the model. The screening method used a linear regression model, including age, sex and the first four genetic principle components as covariates, to calculate all cis-methylation-genotype associations. We selected associations with P<1×10⁻⁸ from the screening results and further fit to a linear regression model including the same covariates. After that, sandwich estimators were used to correct standard errors for the effect of having correlated observations from twins in the sample.
The intra-twin-pair differences of methylation patterns were measured by Euclidean distances. Methylation distances were calculated within twin pairs at the same time point across the CpGs used. In total 154 complete twin pairs (69 MZ, 85 DZ pairs, 660 samples) were available at the same time point. Methylation distances were standardized before regression.
Three sets of methylation distances were calculated using all CpGs, age-associated CpGs and SNP-associated CpGs respectively. Then, a linear mixed effect model was fitted to measure how intra-twin-pair methylation differences changed over time. The mixed effect model included age, sex and twin zygosity as fixed effects and twin pair as the random effect shown below, where i and j denote twin pairs and time points, γ, β1, β2, β3, u, and ε denote fixed intercept, fixed coefficient of age, fixed coefficient of sex, fixed coefficient of zygosity, random intercept and random error.
The probe-wise methylation distances were calculated from the absolute difference between M-values. The same regression model (Equation 3) was employed to estimate the change of intra-twin-pair distances overtime.
Regulatory annotation and functional analysis
We annotated genome locations and related regulatory features of identified age-associated CpGs using Ensembl Funcgen database [Citation21]. Regulatory features were classified according to the Ensembl Regulatory Build [Citation37]. In addition, we performed functional annotation on enriched genes using DAVID [Citation22,Citation23] online tools.
Ethics approval and consent to participate
All participants in SATSA, PIVUS and LBC have provided written informed consents. This study was approved by the ethics committee at Karolinska Institutet with Dnr 2015/1729-31/5.
Availability of data and material
The methylation array data have been submitted to the Array Express database of EMBL-EBL (www.ebi.ac.uk/arrayexpress) under accession number E-MTAB-7309.
Competing interests
EI is a scientific advisor for Precision Wellness, Cellink and Olink Proteomics for work unrelated to the present project.
Supplemental Material
Download Zip (2 MB)Acknowledgement
Lothian Birth Cohort methylation typing was supported by Centre for Cognitive Ageing and Cognitive Epidemiology (Pilot Fund award), Age UK, The Wellcome Trust Institutional Strategic Support Fund, The University of Edinburgh, and The University of Queensland. REM, IJD, and PMV are members of the University of Edinburgh Centre for Cognitive Ageing and Cognitive Epidemiology (CCACE), which is supported by funding from the BBSRC, the Medical Research Council (MRC), and the University of Edinburgh as part of the cross-council Lifelong Health and Wellbeing initiative [MR/K026992/1].
Supplementary material
Supplementary data for this article can be accessed here
Additional information
Funding
Related Research Data
References
- López-Otín C, Blasco MA, Partridge L, et al. The Hallmarks of Aging. Cell. 2013 Jun 6;153(6):1194–1217.
- Bell JT, Pai AA, Pickrell JK, et al. DNA methylation patterns associate with genetic and gene expression variation in HapMap cell lines. Genome Biol. 2011;12:R10.
- Gentilini D, Mari D, Castaldi D, et al. Role of epigenetics in human aging and longevity: genome-wide DNA methylation profile in centenarians and centenarians’ offspring. AGE. 2012 Aug 25;35(5):1961–1973.
- Hannum G, Guinney J, Zhao L, et al. Genome-wide Methylation Profiles Reveal Quantitative Views of Human Aging Rates. Mol Cell. 2013 Jan 24;49(2):359–367.
- Bell JT, Tsai P-C, Yang T-P, et al. Epigenome-Wide Scans Identify Differentially Methylated Regions for Age and Age-Related Phenotypes in a Healthy Ageing Population. PLoS Genet. 2012 Apr 19;8(4):e1002629.
- Alisch RS, Barwick BG, Chopra P, et al. Age-associated DNA methylation in pediatric populations. Genome Res. 2012 Apr;22(4):623–632.
- Johansson Å, Enroth S, Gyllensten U, Continuous Aging of the Human DNA Methylome Throughout the Human Lifespan. PLoS ONE Internet. 2013 Jun 27;8(6):e67378. [cited 2015 Mar 31] Available from: http://www.ncbi.nlm.nih.gov/pmc/articles/PMC3695075/
- Florath I, Butterbach K, Muller H, et al. Cross-sectional and longitudinal changes in DNA methylation with age: an epigenome-wide analysis revealing over 60 novel age-associated CpG sites. Hum Mol Genet. 2014 Mar 1;23(5):1186–1201.
- van Dongen J, Nivard MG, Willemsen G, et al. Genetic and environmental influences interact with age and sex in shaping the human methylome. Nat Commun. 2016 Apr;7(7):11115.
- Richardson B. Impact of aging on DNA methylation. Ageing Res Rev. 2003 Jul;2(3):245–261.
- Liu Y, Aryee MJ, Padyukov L, et al. Epigenome-wide association data implicate DNA methylation as an intermediary of genetic risk in rheumatoid arthritis. Nat Biotechnol. 2013 Feb;31(2):142–147.
- Gaunt TR, Shihab HA, Hemani G, et al. Systematic identification of genetic influences on methylation across the human life course. Genome Biol. 2016;17:61.
- Marioni RE, Shah S, McRae AF, et al. DNA methylation age of blood predicts all-cause mortality in later life. Genome Biol. 2015;16:25.
- Kaminsky ZA, Tang T, Wang S-C, et al. DNA methylation profiles in monozygotic and dizygotic twins. Nat Genet. 2009 Feb;41(2):240–245.
- Tan Q, Heijmans BT, Hjelmborg JVB, et al. Epigenetic drift in the aging genome: a ten-year follow-up in an elderly twin cohort. Int J Epidemiol. 2016 Aug 1;45(4):1146–1158.
- Finkel D, Nl P. Processing Speed and Longitudinal Trajectories of Change for Cognitive Abilities: The Swedish Adoption/Twin Study of Aging. Aging Neuropsychol Cogn. 2004 Jun 1;11(2–3):325–345.
- Magnusson PKE, Almqvist C, Rahman I, et al. The Swedish Twin Registry: establishment of a biobank and other recent developments. Twin Res Hum Genet Off J Int Soc Twin Stud. 2013 Feb;16(1):317–329.
- Lind L, Fors N, Hall J, et al. Comparison of Three Different Methods to Evaluate Endothelium-Dependent Vasodilation in the Elderly. Arterioscler Thromb Vasc Biol. 2005 Nov 1;25(11):2368–2375.
- Deary IJ, Gow AJ, Pattie A, et al. Cohort Profile: The Lothian Birth Cohorts of 1921 and 1936. Int J Epidemiol. 2012 Dec 1;41(6):1576–1584.
- Houseman EA, Accomando WP, Koestler DC, et al. DNA methylation arrays as surrogate measures of cell mixture distribution. BMC Bioinformatics. 2012 May 8;13(1):86.
- Zerbino DR, Johnson N, Juetteman T, et al. Ensembl regulation resources. Database. 2016 Jan 1;bav119.
- Huang DW, Sherman BT, Lempicki RA. Systematic and integrative analysis of large gene lists using DAVID bioinformatics resources. Nat Protoc. 2009;4(1):44–57.
- Huang DW, Sherman BT, Lempicki RA. Bioinformatics enrichment tools: paths toward the comprehensive functional analysis of large gene lists. Nucleic Acids Res. 2009 Jan;37(1):1–13.
- Jaffe AE, Irizarry RA. Accounting for cellular heterogeneity is critical in epigenome-wide association studies. Genome Biol. 2014 Feb 4;15(2):R31.
- Ong C-T, Corces VG. CTCF: an architectural protein bridging genome topology and function. Nat Rev Genet. 2014 Apr;15(4):234–246.
- Day K, Ll W, Thalacker-Mercer A, et al. Differential DNA methylation with age displays both common and dynamic features across human tissues that are influenced by CpG landscape. Genome Biol. 2013;14(9):R102.
- Assenov Y, Müller F, Lutsik P, et al. Comprehensive analysis of DNA methylation data with RnBeads. Nat Methods. 2014 Nov;11(11):1138–1140.
- Triche TJ, Weisenberger DJ, Berg DVD, et al. Low-level processing of Illumina Infinium DNA Methylation BeadArrays. Nucleic Acids Res. 2013 Apr 1;41(7):e90–e90.
- Pidsley R, Wong CCY, Volta M, et al. A data-driven approach to preprocessing Illumina 450K methylation array data. BMC Genomics. 2013 May 1;14(1):293.
- Reinius LE, Acevedo N, Joerink M, et al. Differential DNA Methylation in Purified Human Blood Cells: Implications for Cell Lineage and Studies on Disease Susceptibility. PLoS ONE. 2012 Jul 25;7(7):e41361.
- Sammon JW, Nonlinear A. Mapping for Data Structure Analysis. IEEE Trans Comput. 1969 May;C-18(5):401–409.
- Leek JT, Johnson WE, Parker HS, et al. The sva package for removing batch effects and other unwanted variation in high-throughput experiments. Bioinformatics. 2012 Mar 15;28(6):882–883.
- Howie BN, Donnelly P, Marchini J, et al. Accurate Genotype Imputation Method for the Next Generation of Genome-Wide Association Studies. PLOS Genet. 2009 Jun 19;5(6):e1000529.
- The 1000 Genomes Project Consortium. A global reference for human genetic variation. Nature. 2015 Oct 1;526(7571):68–74.
- Hedman ÅK, Zilmer M, Sundström J, et al. DNA methylation patterns associated with oxidative stress in an ageing population. BMC Med Genomics. 2016;9:72.
- Shabalin AA. Matrix eQTL: ultra fast eQTL analysis via large matrix operations. Bioinforma Oxf Engl. 2012 May 15;28(10):1353–1358.
- Zerbino DR, Wilder SP, Johnson N, et al. The Ensembl Regulatory Build. Genome Biol. 2015;16:56.